
On 8 May, an M5 flare took place in sunspot region NOAA 2056. This active region was part of a cluster of sunspot groups that had appeared from behind the Sun's east limb between 4 and 6 May.
A movie of the event can be seen here.
Image underneath shows the flare near its maximum (10:07UT) as seen through SDO's AIA 131 filter (temperature of million degrees) overlaid on a white light image (SDO/HMI). The flare is located over the trailing part of NOAA 2056, which harbored a delta (i.e. 2 spots of opposite magnetic polarity within the same penumbra).
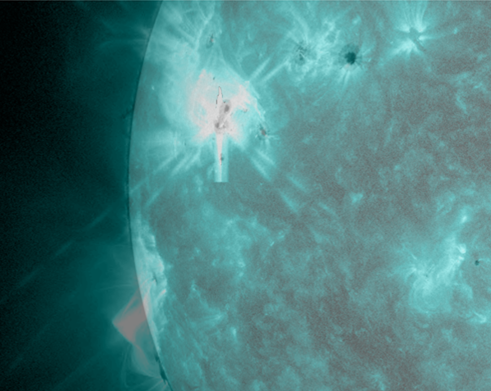
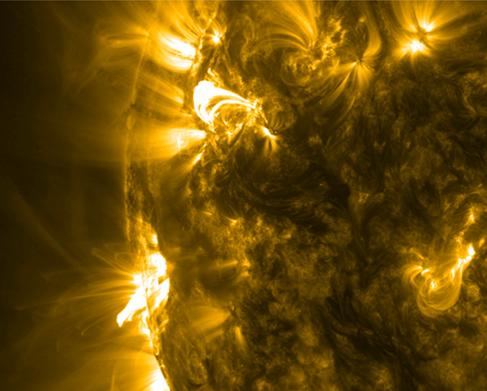
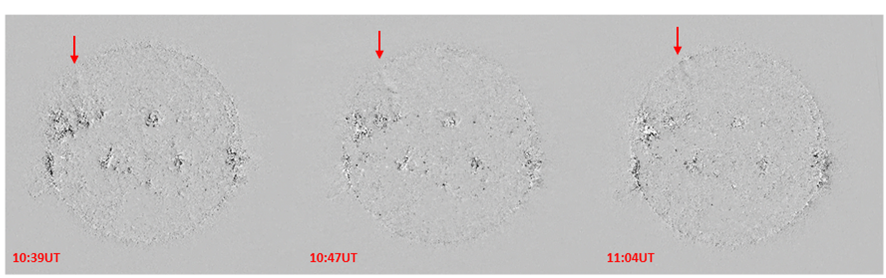
After the flare, SDO filters showing somewhat "cooler" temperatures of the Sun's atmosphere revealed the presence of post-flare coronal loops over the blast site (AIA 171 image above at 11:38UT). Scientists of the PROBA2 Science Centre noticed also a weak EIT-wave heading to the north between 10:30 and 11:10UT. The wave is best seen in difference images made by PROBA2's SWAP instrument (image underneath, and related movie). SOHO's coronagraphs did not reveal a clear coronal mass ejection (CME) associated to this event.
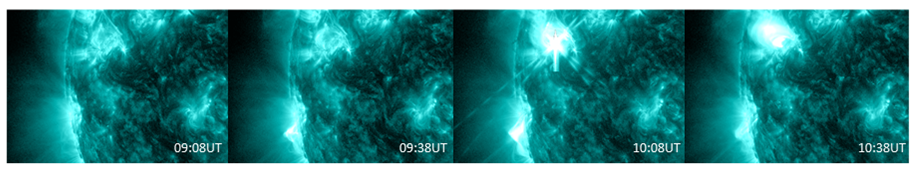
Interestingly, the x-ray flux as observed by the GOES15 satellite shows an increase well before the flare's peak at 10:07UT. Indeed, around 09:15UT, the x-ray flux gradually started to increase and stayed at C2-level for nearly half an hour (see graph underneath).
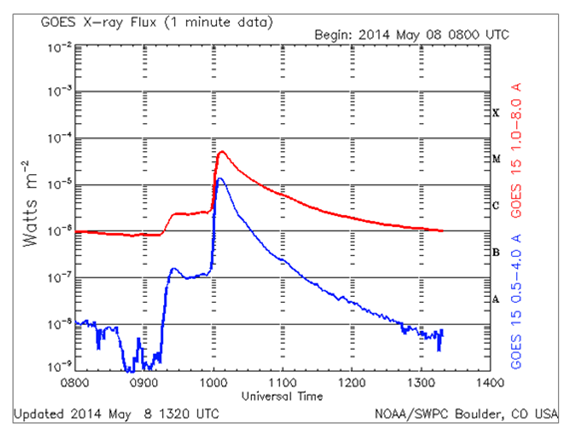
However, this "step-up" originated from a region at or just beyond the southeast solar limb. SDO-imagery (AIA 131) clearly demonstrates a flare starting around 09:15UT. At nearly 10:00UT, as the x-ray flux from the flare in NOAA 2056 rapidly rose, the x-ray flux from the source near the east limb declined. Hence, the stepped x-ray flux profile originated from two different sources.
Credits - Data and imagery for the movie clips were taken from SDO/AIA and HMI, PROBA2/SWAP, and GOES15/XRS.
 |
 |
