
In several previous news items, solar flares are often tagged as impulsive or long duration events, meaning they last resp. only a few minutes or more than one hour. This news item will focus on the typical duration of a solar flare, thus providing a reference to appreciate the extreme duration of some solar flares.
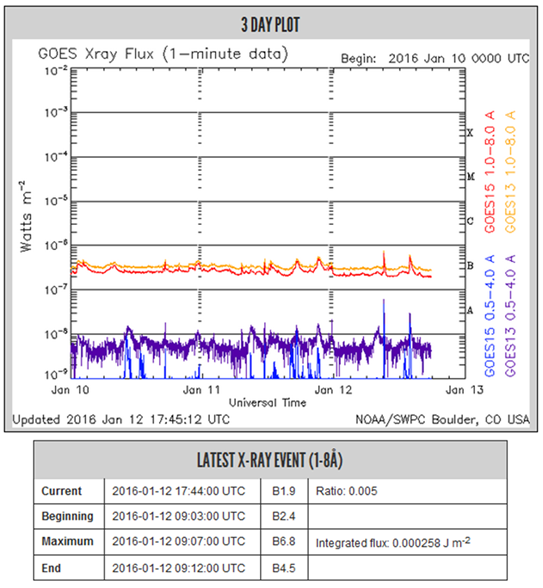
The x-ray signatures of solar flares are observed by the GOES series of satellites since 1976, and are published by NOAA and archived at NGDC. The begin time of an x-ray event is defined as the first minute, in a sequence of 4 minutes, of steep monotonic increase in the 0.1-0.8 nm x-ray flux. The x-ray event maximum is taken as the minute of the peak x-ray flux. The end time is the time when the flux level decays to a point halfway between the maximum flux and the pre-flare background level, as illustrated underneath. Note also the logarithmic scale of the vertical axis (x-ray flux), with each x-ray class (B, C, M, X) 10 times stronger than the foregoing and the X-class ("eXtreme") being the strongest.
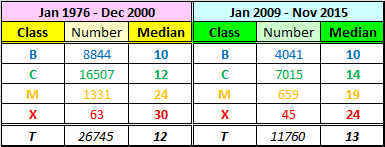
The duration for all flares that have occurred between January 2009 and November 2015 (solar cycle 24) was determined. For each x-ray class, the median duration (minutes) was calculated. The median is that number separating the higher half of a data sample from the lower half. The results can be found in the table underneath, and was compared to a result from Veronig et al. (2002; Table 3) that concerned the period January 1976 to December 2000. A more detailed, technical result can be found here. The table shows that, based on 11.760 flaring events with valid timings, a B-class flare lasts about 10 minutes, a C-class flare 14 minutes, an M-class flare has a duration of about 19 minutes, and X-class flares usually last about 24 minutes. These results indicate indeed that stronger flares last longer. The duration of M- and X-class flares seem to be a bit shorter than in the Veronig et al. research, which may be due to the smaller number of flares, as well as the fact that only part of the relatively weak SC24 has elapsed so far.
The reason why the median was used for this investigation, and not the average, has all to do with the frequency distribution of solar flares. Indeed, if one bins the number of flares per 5 minutes of duration (e.g. 5-9 minutes, 10-14 minutes, and so on up to 2 hours), one can clearly see that this distribution is skewed. This is demonstrated by the figure underneath, showing the flare distribution for the 4 x-ray classes (same color code as table above). It shows a concentration of flares towards the short duration, followed by a long tail towards ever increasing durations. Simply taking the "average" of the durations would then give a too high value for the "mean" duration of most flares within that class. The graphs also show how the peak number of the distribution moves towards longer durations as the strength of the x-ray class increases. Another conclusion is that the wording "impulsive" (events lasting less than 10 minutes) should not be used for B- and C-class flares, as 25-45% of these flares fall in this duration bin.
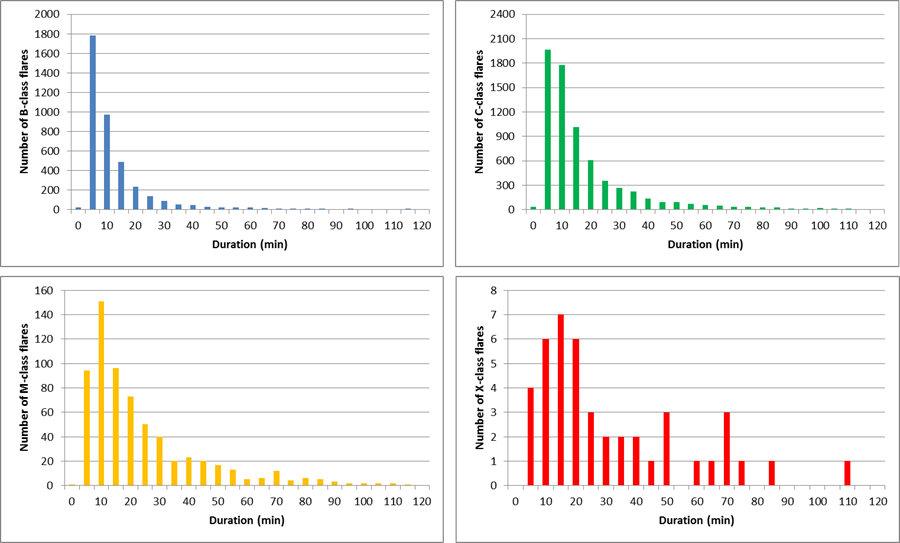
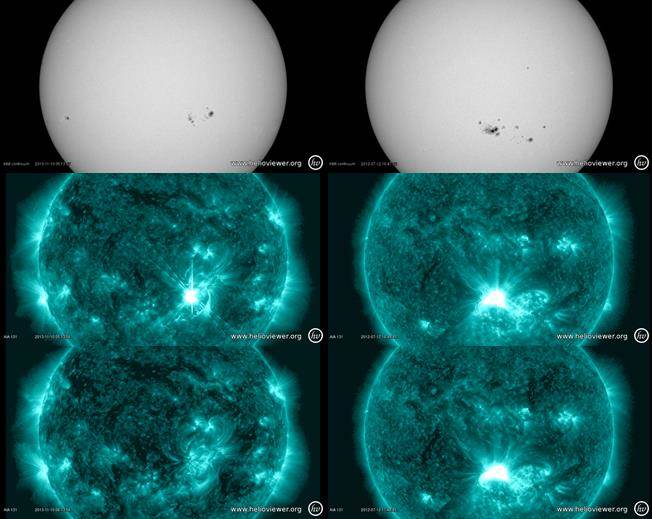
The above histograms suggest a wide range of durations within a single x-ray class. This is true, and applies even to the peak flux within a class. As an example, there are M1 flares that last barely 5 or 6 minutes, but there are also M1 flares with a duration of several hours, such as the one on 17 July 2012 in sunspot group NOAA 11520 lasting a whopping 7 hours and 1 minute! Another example illustrates the different outlook these impulsive and long duration flaring events have in extreme ultraviolet (EUV) imagery. The figure underneath shows a white light image (SDO/HMI) of the active regions responsible for a short and a long duration X1 flaring event. These took place resp. in NOAA 11890 on 10 November 2013 (duration: 10 minutes) and in NOAA 11520 on 12 July 2012 (duration: 113 minutes or nearly 2 hours). The EUV images and clip (SDO/AIA 131) show the outlook during the timing of the x-ray peak, and just 1 hour later. The difference is remarkable to say the least.

Studies of frequency distributions of solar flares are useful for the physics behind solar flares, for any evolution over multiple solar cycles, as well as for providing a first idea in space weather forecasts and on potential space weather effects. As an example, long duration events (LDE; duration greater than 60 minutes; other possible definition at NOAA) are usually associated with coronal mass ejections (CME), whereas impulsive flares are not. Of course there are notorious exceptions such as the long duration flares produced by NOAA 12192 in October 2014, which had no associated CME at all.
 |
 |
