- Table of Content
- 1.Sunspot number...
- 2.First Proba-3 ...
- 3.Review of Sola...
- 4.International ...
- 5.PROBA2 Observa...
- 6.Noticeable Sol...
- 7.Geomagnetic Ob...
- 8.The SIDC Space...
- 9.Upcoming Activ...
2. First Proba-3 ASPIICS Guest Investigator Call
3. Review of Solar and Geomagnetic Activity
4. International Sunspot Number by SILSO
5. PROBA2 Observations
6. Noticeable Solar Events
7. Geomagnetic Observations in Belgium
8. The SIDC Space Weather Briefing (29 Dec 2025 - 4 Jan 2026)
9. Upcoming Activities
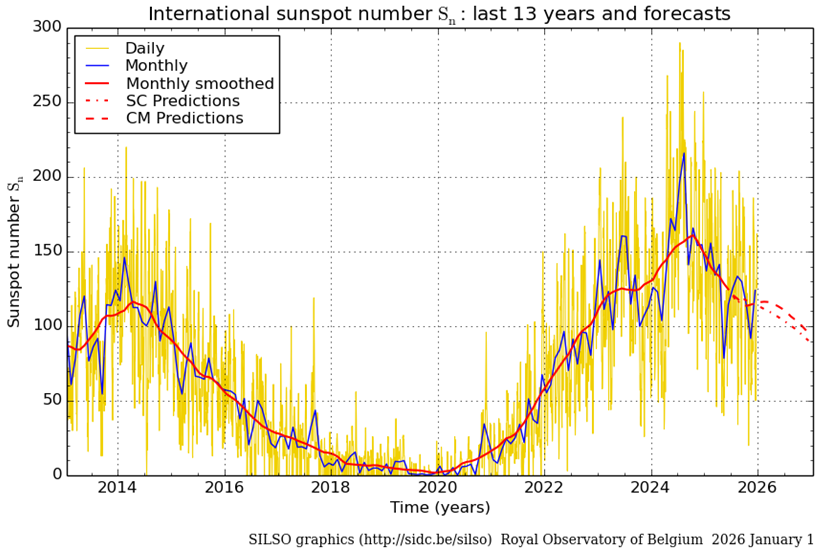
Sunspot numbers
SILSO (https://www.sidc.be/SILSO/home ), the World Data Center for the production, preservation and dissemination of the international sunspot number, has just released the sunspot numbers for December 2025. The sunspot number is the number of sunspot groups multiplied by 10 to which then the number of individual sunspots is added. The -provisional- monthly sunspot number for December is 124.0, which is up from the preceding 2 months. The overall trend remains declining. This is shown in the graph underneath, with the daily sunspot numbers in yellow, the monthly numbers in blue, and the smoothed (nearly "13-month averaged"; see https://www.sidc.be/SILSO/faq-page for more details) sunspot numbers in red. The dashed red lines show the expected evolution, based on different models.
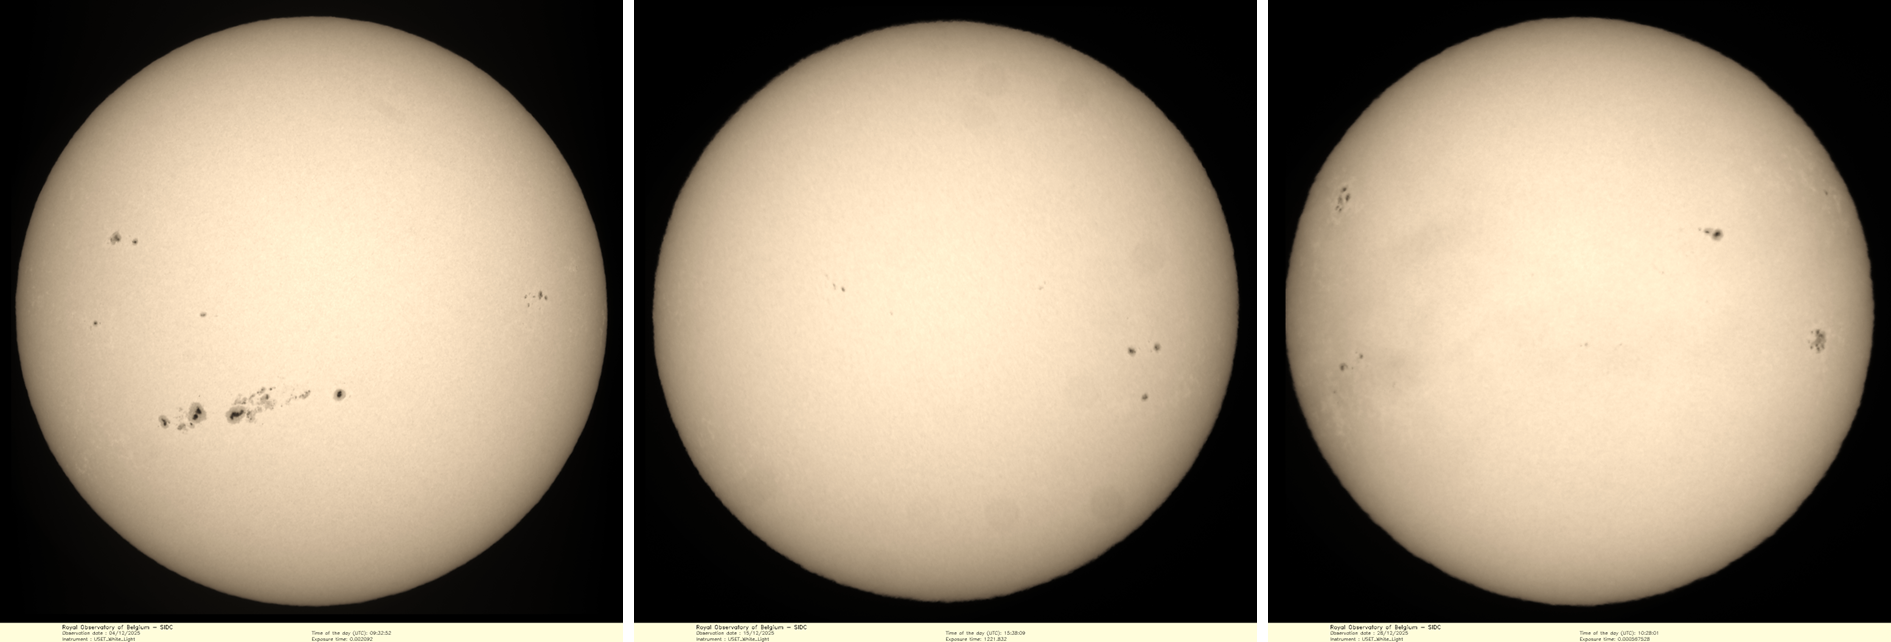
The Sun showed us two different faces during December. During the middle of the month, only few sunspots were visible with the daily sunspot number around 60-70. However, during the beginning and end of the month, the sunspot numbers were relatively high and around 180 and 150 respectively. This varying sunspot activity can be seen in the solar pictures underneath, taken by the solar telescopes un Uccle (USET - https://www.sidc.be/uset/) on resp. 4, 15 and 28 December. Some of the smudges are due to passing clouds. Using eclipse glasses, the largest sunspots were visible to the protected naked eye - in particular during the days around 5 December. The first week of December also saw 2 X-class flares: an X1.9 on 1 December (https://www.stce.be/news/794/welcome.html ), and an X1.1 on 8 December (https://www.stce.be/news/796/welcome.html ). The last week of December saw compact sunspot groups, but with little complex magnetic structures resulting in only medium-class flares.
First Proba-3 ASPIICS Guest Investigator Call
The first Proba-3 ASPIICS Guest Investigator Programme was announced at the end of 2025, with a submission deadline of 12 February 2026. This annual opportunity is open to scientists from ESA Member States, offering not only access to Proba-3 ASPIICS data but also the unique chance to participate in instrument commanding. Successful applicants will spend time at the Science Operations Centre, hosted by the Royal Observatory of Belgium, enabling direct interaction with the science team and hands-on experience in data processing and calibration.
The purpose of the Guest Investigators programme is to spread the use of, and complement, ASPIICS data more widely in the heliophysics science community. The GIs can propose their own ASPIICS science observation programmes that will complement those currently being run by the ASPIICS team. The GIs are expected to have an active role in operations planning and they will have immediate access to all data from their observation campaign, after reception on the ground. The ASPIICS team will support the GIs in all operational and technical aspects, including data processing and calibration. This approach has the added benefit (apart from maximising the science output) of providing a unique hands-on training opportunity for the involved scientists, allowing them to operate a live instrument and to acquire the understanding necessary to best exploit the data.
Find all information, requirements and conditions on the ESA Cosmos Pages: https://www.cosmos.esa.int/web/proba-3-ao-2025
Review of Solar and Geomagnetic Activity
WEEK 1305 from 2025 Dec 29
Solar Active Regions (ARs) and flares
Solar flaring activity was low to high over the week. There were 18 numbered regions on disk, but many of these were magnetically simple. The largest regions on disk were SIDC Sunspot Groups 744 and 745 (NOAA Active Regions 4324 and 4325) and these were responsible for most of the flaring activity.
The largest flare was an M7.1 flare (SIDC Flare 6547) peaking on December 31 at 13:51 UTC, which was produced by SIDC Sunspot Group 744 (NOAA Active Region 4324).
After January 01, the flaring activity decreased to low levels for the rest of the week.
Coronal Mass Ejections
Three Coronal Mass Ejections (CMEs) with possible Earth-directed components were identified. The first CME (SIDC CME 616), directed to the north-west, was detected in LASCO-C2 data from 23:00 UTC on December 28. This was associated with an M4.2 flare (SIDC Flare 6518) peaking on December 28 at 22:39 UTC.
The second, a partial halo CME (SIDC CME 617), predominantly directed to the north-east, was observed in LASCO-C2 data from 14:12 UTC on December 31 and was associated with an M7.1 flare. This eruption had an associated on-disk dimming and a Type II and Type IV radio emission.
The third CME (SIDC CME 618), directed to the north-east, was first seen in LACSCO-C2 data from 18:48 UTC on January 01. This was associated with a C6.2 flare from SIDC Sunspot Group 744 (NOAA Active Region 4324), with peak time 17:59 UTC.
Coronal Holes
A negative polarity coronal hole (SIDC Coronal Hole 140) continued to transit the central meridian at the start of the week on December 29.
A small positive polarity coronal hole in the southern hemisphere (SIDC Coronal Hole 143) began to transit the central meridian on December 30.
Proton flux levels
The greater than 10 MeV proton flux was at background levels throughout the week.
Electron fluxes at GEO
The greater than 2 MeV electron flux measured by GOES 19 and 18 was above the 1000 pfu threshold for a period on every day of the week, due to the influence of the high-speed stream from the previous week. The strongest electron flux values were recorded at the start of the week with a maximum value of 6980 pfu at 21:20 UTC on December 29, and then gradually decreased over the week.
The 24-hour electron fluence was at moderate levels.
Solar wind
Between December 28 and 31, the solar wind parameters reflected the gradual decline towards a slow solar wind regime. From 12:00 UTC on December 31, the solar wind speed began to increase gradually to values above 500 km/s. The interplanetary magnetic field phi angle switched from the positive to the negative sector (directed towards the Sun) from around this time on December 31, indicating a likely connection with the solar wind from SIDC Coronal Hole 140. The solar wind speed increased further on January 02, reaching a maximum of near 700 km/s. The magnetic field ranged between 2 and 12 nT. From January 03, the solar wind speed began to decrease but structures in the magnetic field indicated a possible weak ICME signature. A shock was registered in the solar wind data around 20:40 UTC on January 04, likely associated with a CME that lifted off the solar surface at around 18:50 on January 01 (SIDC CME 618). The interplanetary magnetic field quickly jumped from 440 to 470 km/s. The southward component of the interplanetary magnetic field reached minimum values -10 nT.
Geomagnetism
Geomagnetic conditions were at quiet to unsettled levels at the start of the week and then increased, due to the high speed stream influence, to reach minor storm levels globally (NOAA Kp 5) and active levels locally (K BEL 4) on January 02. Quiet to unsettled conditions then returned by the end of the week on January 04.
International Sunspot Number by SILSO

The daily Estimated International Sunspot Number (EISN, red curve with shaded error) derived by a simplified method from real-time data from the worldwide SILSO network. It extends the official Sunspot Number from the full processing of the preceding month (green line), a few days more than one solar rotation. The horizontal blue line shows the current monthly average. The yellow dots give the number of stations that provided valid data. Valid data are used to calculate the EISN. The triangle gives the number of stations providing data. When a triangle and a yellow dot coincide, it means that all the data is used to calculate the EISN of that day.
PROBA2 Observations
Solar Activity
Solar flare activity fluctuated from low to moderate during the week. In order to view the activity of this week in more detail, we suggest to go to the following website from which all the daily (normal and difference) movies can be accessed here: https://proba2.oma.be/ssa.
This page also lists the recorded flaring events. A weekly overview movie can be found here (SWAP week 823): https://proba2.sidc.be/swap/data/mpg/movies/weekly_movies/weekly_movie_2025_12-29.mp4
Details about some of this week's events can be found further below. If any of the linked movies are unavailable they can be found in the P2SC movie repository here: https://proba2.oma.be/swap/data/mpg/movies/
Wednesday Dec 31
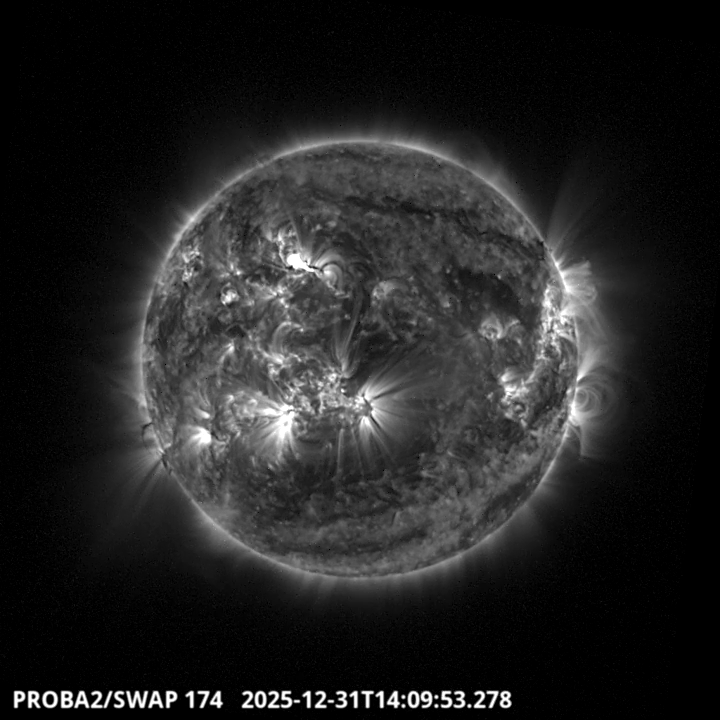
The largest flare of this week was an M7.1, and it was observed by SWAP (image above). The flare peaked on 2025-Dec-31 at 13:51 UT and occurred on the North-East part of the solar disk, originating from active region NOAA4324. Find a SWAP movie of the event here: https://proba2.sidc.be/swap/movies/20251231_swap_movie.mp4
Noticeable Solar Events
| DAY | BEGIN | MAX | END | LOC | XRAY | OP | 10CM | TYPE | Cat | NOAA |
| 29 | 0634 | 0651 | 0656 | S10E43 | M1.0 | SF | 53 | 4325 | ||
| 31 | 1312 | 1351 | 1411 | M7.1 | II/1IV/2III/2 | 54 | 4324 |
| LOC: approximate heliographic location | TYPE: radio burst type |
| XRAY: X-ray flare class | Cat: Catania sunspot group number |
| OP: optical flare class | NOAA: NOAA active region number |
| 10CM: peak 10 cm radio flux |
Geomagnetic Observations in Belgium

Local K-type magnetic activity index for Belgium based on data from Dourbes (DOU) and Manhay (MAB). Comparing the data from both measurement stations allows to reliably remove outliers from the magnetic data. At the same time the operational service availability is improved: whenever data from one observatory is not available, the single-station index obtained from the other can be used as a fallback system.
Both the two-station index and the single station indices are available here: http://ionosphere.meteo.be/geomagnetism/K_BEL/
The SIDC Space Weather Briefing (29 Dec 2025 - 4 Jan 2026)
The forecaster on duty presented the SIDC briefing that gives an overview of space weather from 29 December 2025 to 4 January 2026.
The pdf of the presentation can be found here: https://www.stce.be/briefings/20260105_SWbriefing.pdf
Upcoming Activities
Courses, seminars, presentations and events with the Sun-Space-Earth system and Space Weather as the main theme. We provide occasions to get submerged in our world through educational, informative and instructive activities.
* Feb 9-11, 2026, STCE Space Weather Introductory Course, Brussels, Belgium - register: https://events.spacepole.be/event/255/
* Mar 16-18, 2026, STCE course: Role of the ionosphere and space weather in military communications, Brussels, Belgium - register: https://events.spacepole.be/event/258/
* Apr 20-21, 2026, STCE cursus: inleiding tot het ruimteweer, Brussels, Belgium - register: https://events.spacepole.be/event/260/
* Mar 23, 2026, STCE lecture: From physics to forecasting, Space Weather course, ESA Academy, Redu, Belgium
* Jun 15-17, 2026, STCE Space Weather Introductory Course, Brussels, Belgium - register: https://events.spacepole.be/event/256/
* Oct 12-14, 2026, STCE Space Weather Introductory Course, Brussels, Belgium - register: https://events.spacepole.be/event/257/
* Nov 23-25, 2026, STCE course: Role of the ionosphere and space weather in military communications, Brussels, Belgium - register: https://events.spacepole.be/event/259/
* Dec 7-9, 2026, STCE Space Weather Introductory Course for Aviation, Brussels, Belgium - register: https://events.spacepole.be/event/262/
To register for a course and check the seminar details, navigate to the STCE Space Weather Education Center: https://www.stce.be/SWEC
If you want your event in the STCE newsletter, contact us: stce_coordination at stce.be
Website: https://www.stce.be/SWEC