
The Solar-Terrestrial Centre of Excellence (STCE) is a collaborative network of the Belgian Institute for Space Aeronomy, the Royal Observatory of Belgium and the Royal Meteorological Institute of Belgium.
|
Published by the STCE - this issue : 28 Dec 2013. The Solar-Terrestrial Centre of Excellence (STCE) is a collaborative network of the Belgian Institute for Space Aeronomy, the Royal Observatory of Belgium and the Royal Meteorological Institute of Belgium. |
| Archive of the newsletters | Subscribe to this newsletter by mail |
During the first half of the week, the X-ray flux peaked in the C-level, with a C4.0 flare as strongest one. From the end of December 19 onwards, the X-ray flux level increased and several C- and M-flares occurred. In total 51 C-flares and 8 M-flares were observed during the week. NOAA active region (AR) 1928 was responsible for most of the flares. The strongest flare was a M3.5 flare with peak on December 19 at 23h19 UTC, originating from NOAA AR 1934.
A CME, associated with a C3.1 long-duration flare, was observed in LASCO/C2 (first measurement on December 16 at 21h27 UTC). The CME was travelling to the west with an estimated speed of 650 km/s, but did not arrive at Earth.
A coronal hole reached the central meridian on December 22, located in the north hemisphere at a latitude of 25 to 50 degrees.
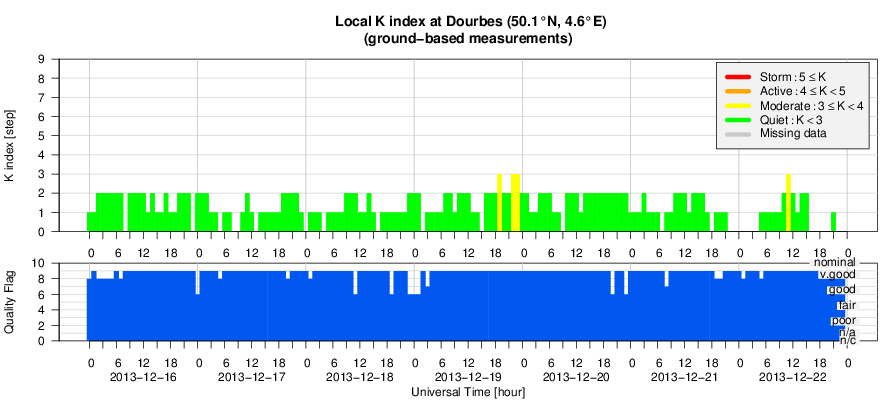
During the full week we were inside a slow solar wind stream. The solar wind speed, measured by ACE, slowly decreased from 450 km/s to 300 km/s. The interplanetary magnetic field (IMF) was stable around a magnitude of 5 nT. The Bz-component of the interplanetary magnetic field varied from -6 to +5 nT. Geomagnetic conditions were mostly quiet (K Dourbes less than 3) with unsettled levels (K Dourbes equal 3) only during a few time slots.
| DAY | BEGIN | MAX | END | LOC | XRAY | OP | 10CM | TYPE | Cat | NOAA |
| 19 | 2306 | 2319 | 2326 | M3.5 | 1934 | |||||
| 20 | 1135 | 1157 | 1207 | M1.6 | 1934 | |||||
| 22 | 0805 | 0811 | 0818 | S20W49 | M1.9 | SF | 87 | 1928 | ||
| 22 | 0833 | 0837 | 0841 | S17W52 | M1.1 | SF | 87 | 1928 | ||
| 22 | 1424 | 1438 | 1448 | S18E44 | M1.6 | 1F | 1934 | |||
| 22 | 1506 | 1512 | 1519 | S19W56 | M3.3 | 1N | 87 | 1928 | ||
| 22 | 2123 | 2208 | 2213 | S17W58 | M1.6 | SN | 87 | 1928 | ||
| 22 | 2344 | 0003 | 0005 | S17W60 | M1.3 | SF | III/1 | 87 | 1928 |
| LOC: approximate heliographic location | TYPE: radio burst type |
| XRAY: X-ray flare class | Cat: Catania sunspot group number |
| OP: optical flare class | NOAA: NOAA active region number |
| 10CM: peak 10 cm radio flux |
Start : 2014-04-27 - End : 2014-05-02
The EGU General Assembly 2014 will bring together geoscientists
from all over the world to one meeting covering all disciplines of
the Earth, planetary and space sciences. The EGU aims to provide a
forum where scientists, especially early career researchers, can
present their work and discuss their ideas with experts in all
fields of geosciences.
http://www.spaceweather.eu/en/repository/show?id=485
CMEs and flares are transient phenomena with huge energy releases originating from the solar corona. We investigate and analyze the evolution of the X1.4-class flare/CME event of 22 September 2011 that produced a distinct system of flare loops. Viewed from Earth, the event was observed on the solar limb, enabling us to derive height-time curves of the evolving loops. For a continuous tracking of the loop system in high-temporal resolution EUV data using SDO/AIA data, we developed a method that automatically detects the height of the loop tops over a given reference point by analyzing the intensity profile perpendicular to the solar limb. With this method, we measure the height-time profiles of the loop system in the different wavelength channels over a time period of 12 hours after the flare onset. We identify characteristic features in the height-time curves which stem from a non-uniform growth of the flare loop system related to the ongoing magnetic reconnection process. We put special focus on the early phase of the event for which we compare the growth of the loop system with the kinematics of the associated CME and aim to connect the physics behind the rapid growth of the loop system with changes in the kinematical behavior of the CME or enhanced soft X-ray flux.
http://www.spaceweather.eu/en/repository/show?id=486