
The Solar-Terrestrial Centre of Excellence (STCE) is a collaborative network of the Belgian Institute for Space Aeronomy, the Royal Observatory of Belgium and the Royal Meteorological Institute of Belgium.
|
Published by the STCE - this issue : 10 Jan 2014. The Solar-Terrestrial Centre of Excellence (STCE) is a collaborative network of the Belgian Institute for Space Aeronomy, the Royal Observatory of Belgium and the Royal Meteorological Institute of Belgium. |
| Archive of the newsletters | Subscribe to this newsletter by mail |
This promising letter arrived at the STCE's Public Outreach Office on 1 January. It reads:

The Sun apparently wants to keep its New Year's resolutions. Indeed, on the very first day of the year it produced a great prominence eruption, a very strong solar flare, and one of the largest sunspot groups so far this solar cycle. This can be seen in this movie at http://www.youtube.com/watch?v=fwokCrFhljo
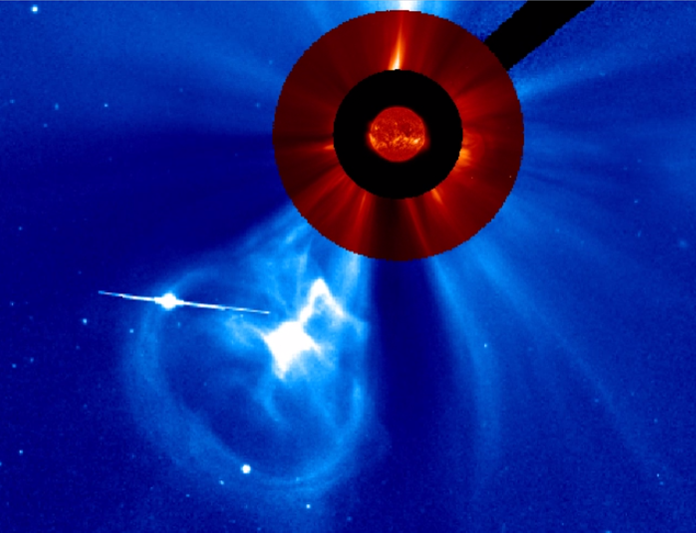
A solid and large prominence near the south east solar limb erupted around noon on 1 January. The accompanying bulb-like coronal mass ejection (CME) was not directed to Earth. The typical structure of a CME could easily be seen: a bright leading edge, a dark cavity, and the bright core filament. The CME moved at a rather slow speed of about 300 km/s.
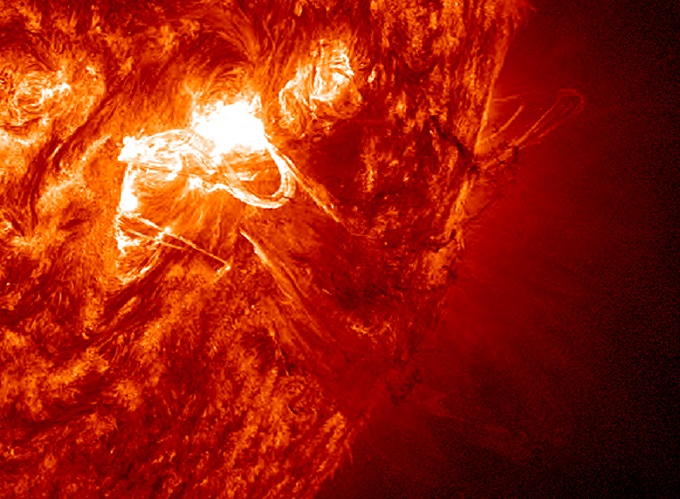
At 18:52UT, magnetically complex sunspot group NOAA 1936 produced a strong M9.9 flare. It highlighted the increase in flaring activity which was already ongoing for several days (including an M3 flare on 29 December and an M6 flare on 31 December). The accompanying CME was not particularly significant and was mostly directed away from Earth.
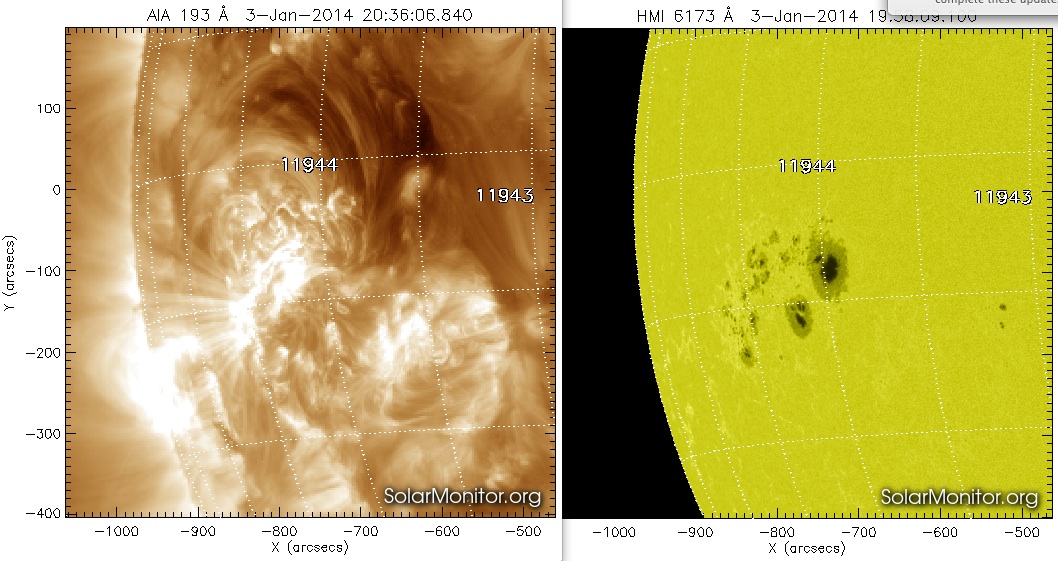
In the course of the day, one of the largest sunspot groups so far this solar cycle rounded the south eastern solar limb. NOAA 1944 has about 9 times the surface area of the Earth. It has produced already various medium flares, the strongest of which was an M4-flare on 4 January. If the sunspots that currently compose the few magnetic deltas get larger, then more and stronger flares can be expected. No surprise this group continues to attract all the attention!

Credits - Imagery was taken from SOHO/LASCO (http://sohowww.nascom.nasa.gov/ ) and SDO/AIA (http://sdo.gsfc.nasa.gov/ ).
In the week of December 30 to January 5, 38 C flares and 9 M flares were observed. In the graph below, the X-ray radiation measured by GOES is averaged over an hour and gives a general trend over the week. The background radiation was in the C-level from December 31.
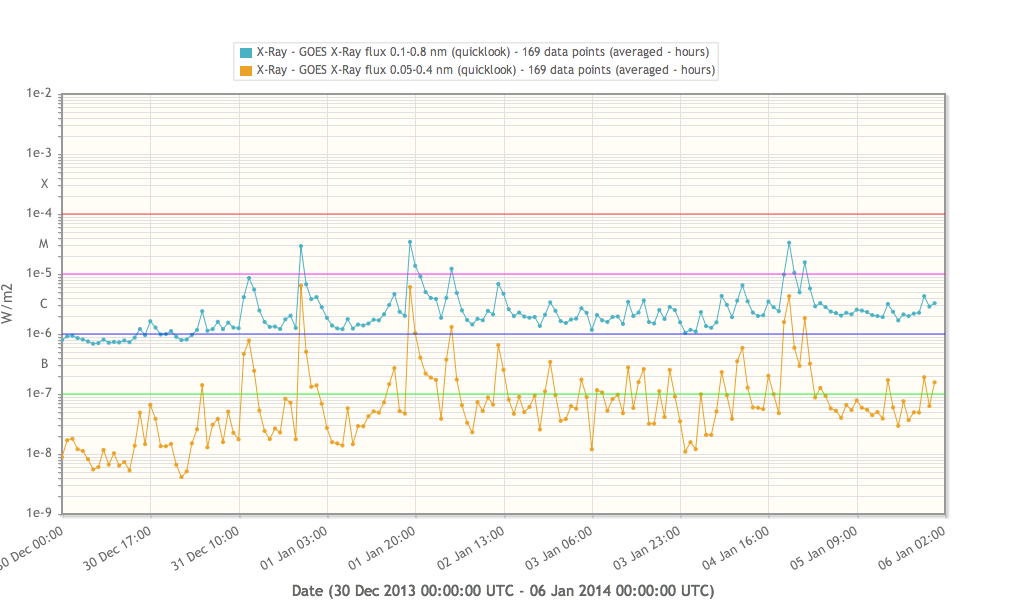

Also NOAA ARs 1937, 1938, 1940 and 1943 produced a few single C flares. NOAA ARs 1936 and 1938 produced many C flares on December 30 and 31.
The beta-gamma-delta region NOAA AR 1936 produced two M flares in the begin of the week; M6.4 on December 31 at 21:58 UTC and M9.9 on January 1 at 18:52 UTC. Both M flares were associated with a slow CME.
From January 2 on NOAA AR 1944 rotated clearly on the visible solar disk. The region showed growth and became a very large and complex active region of a magnetic beta-gamma configuration, and later on also with a delta component. NOAA AR 1944 produced many C flares and a few small M flares, with an M4.0 flare as strongest one on January 4 at 19:46 UTC. The M4.0 event was associated with a CME that was mainly propagating southward.

Also an M2.0 flare erupted on January 4 at 22:52 UT from NOAA AR 1936 that was located at the west limb. A related CME was propagating in the westward direction. (It arrived Tuesday January 7, see next bulletin)

The >10 MeV proton flux was enhanced during most of the day on January 5, but remained below the threshold level. The enhancement probably was related to the M2.0 flare on January 4.

| DAY | BEGIN | MAX | END | LOC | XRAY | OP | 10CM | TYPE | Cat | NOAA |
| 31 | 2145 | 2158 | 2220 | S16W35 | M6.4 | 2N | 160 | 1936 | ||
| 01 | 1840 | 1852 | 1903 | S14W47 | M9.9 | 2B | 1936 | |||
| 02 | 0224 | 0233 | 0256 | S5E76 | M1.7 | SF | CTM/1III/1 | 1944 | ||
| 02 | 2212 | 2218 | 2222 | S5E72 | M1.2 | 1N | 1944 | |||
| 03 | 1241 | 1250 | 1254 | M1.0 | III/1 | 1944 | ||||
| 03 | 2109 | 2114 | 2119 | S6E56 | M1.1 | SF | 1944 | |||
| 04 | 1016 | 1025 | 1041 | S5E48 | M1.3 | 2N | 140 | 1944 | ||
| 04 | 1905 | 1946 | 2023 | M4.0 | 550 | VI/2IV/1 | 1944 | |||
| 04 | 2212 | 2252 | 2322 | M1.9 | 1936 | |||||
| 04 | 1847 | 1946 | 2023 | M4.0 | 550 | VI/2IV/1 |
| LOC: approximate heliographic location | TYPE: radio burst type |
| XRAY: X-ray flare class | Cat: Catania sunspot group number |
| OP: optical flare class | NOAA: NOAA active region number |
| 10CM: peak 10 cm radio flux |
The solar wind showed normal values in the beginning of the week, till the arrival of the coronal hole high speed stream on January 1. Solar wind speed increased from 400 to about 650 km/s. The magnitude of the interplanetary magnetic field reached a maximum of 17 nT, with a Bz-component varying between -13 and +8 nT. From January 3 on the solar wind parameters returned back to normal values.

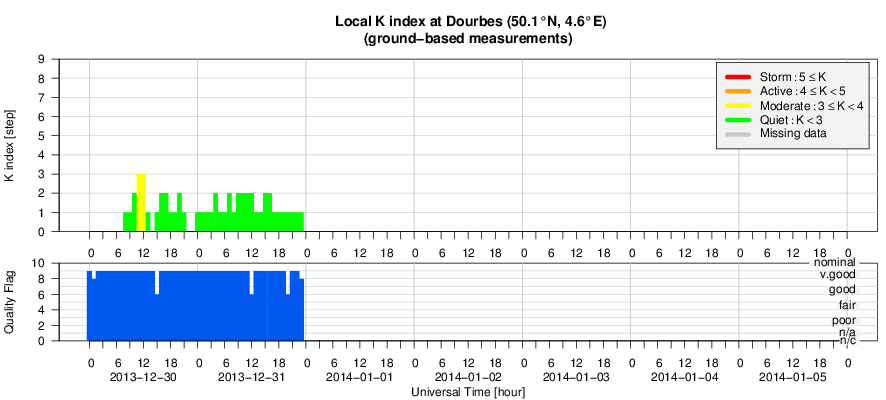
Geomagnetic conditions were unsettled to active (Kp 3 to 4), with a few isolated time slots of minor storm conditions (Kp=5) on January 1 and 2. Enhanced geomagnetic activity was due to the arrival of the high speed stream. From January 3 on quiet geomagnetic conditions returned.

The figure shows the time evolution of the Vertical Total Electron Content (VTEC) (in red) during the last week at three locations:
a) in the northern part of Europe(N61°, 5°E)
b) above Brussels(N50.5°, 4.5°E)
c) in the southern part of Europe(N36°, 5°E)
This figure also shows (in grey) the normal ionospheric behaviour expected based on the median VTEC from the 15 previous days.
The VTEC is expressed in TECu (with TECu=10^16 electrons per square meter) and is directly related to the signal propagation delay due to the ionosphere (in figure: delay on GPS L1 frequency).
The Sun's radiation ionizes the Earth's upper atmosphere, the ionosphere, located from about 60km to 1000km above the Earth's surface.The ionization process in the ionosphere produces ions and free electrons. These electrons perturb the propagation of the GNSS (Global Navigation Satellite System) signals by inducing a so-called ionospheric delay.
See http://stce.be/newsletter/GNSS_final.pdf for some more explanations ; for detailed information, see http://gnss.be/ionosphere_tutorial.php