
The Solar-Terrestrial Centre of Excellence (STCE) is a collaborative network of the Belgian Institute for Space Aeronomy, the Royal Observatory of Belgium and the Royal Meteorological Institute of Belgium.
|
Published by the STCE - this issue : 16 Jan 2014. The Solar-Terrestrial Centre of Excellence (STCE) is a collaborative network of the Belgian Institute for Space Aeronomy, the Royal Observatory of Belgium and the Royal Meteorological Institute of Belgium. |
| Archive of the newsletters | Subscribe to this newsletter by mail |
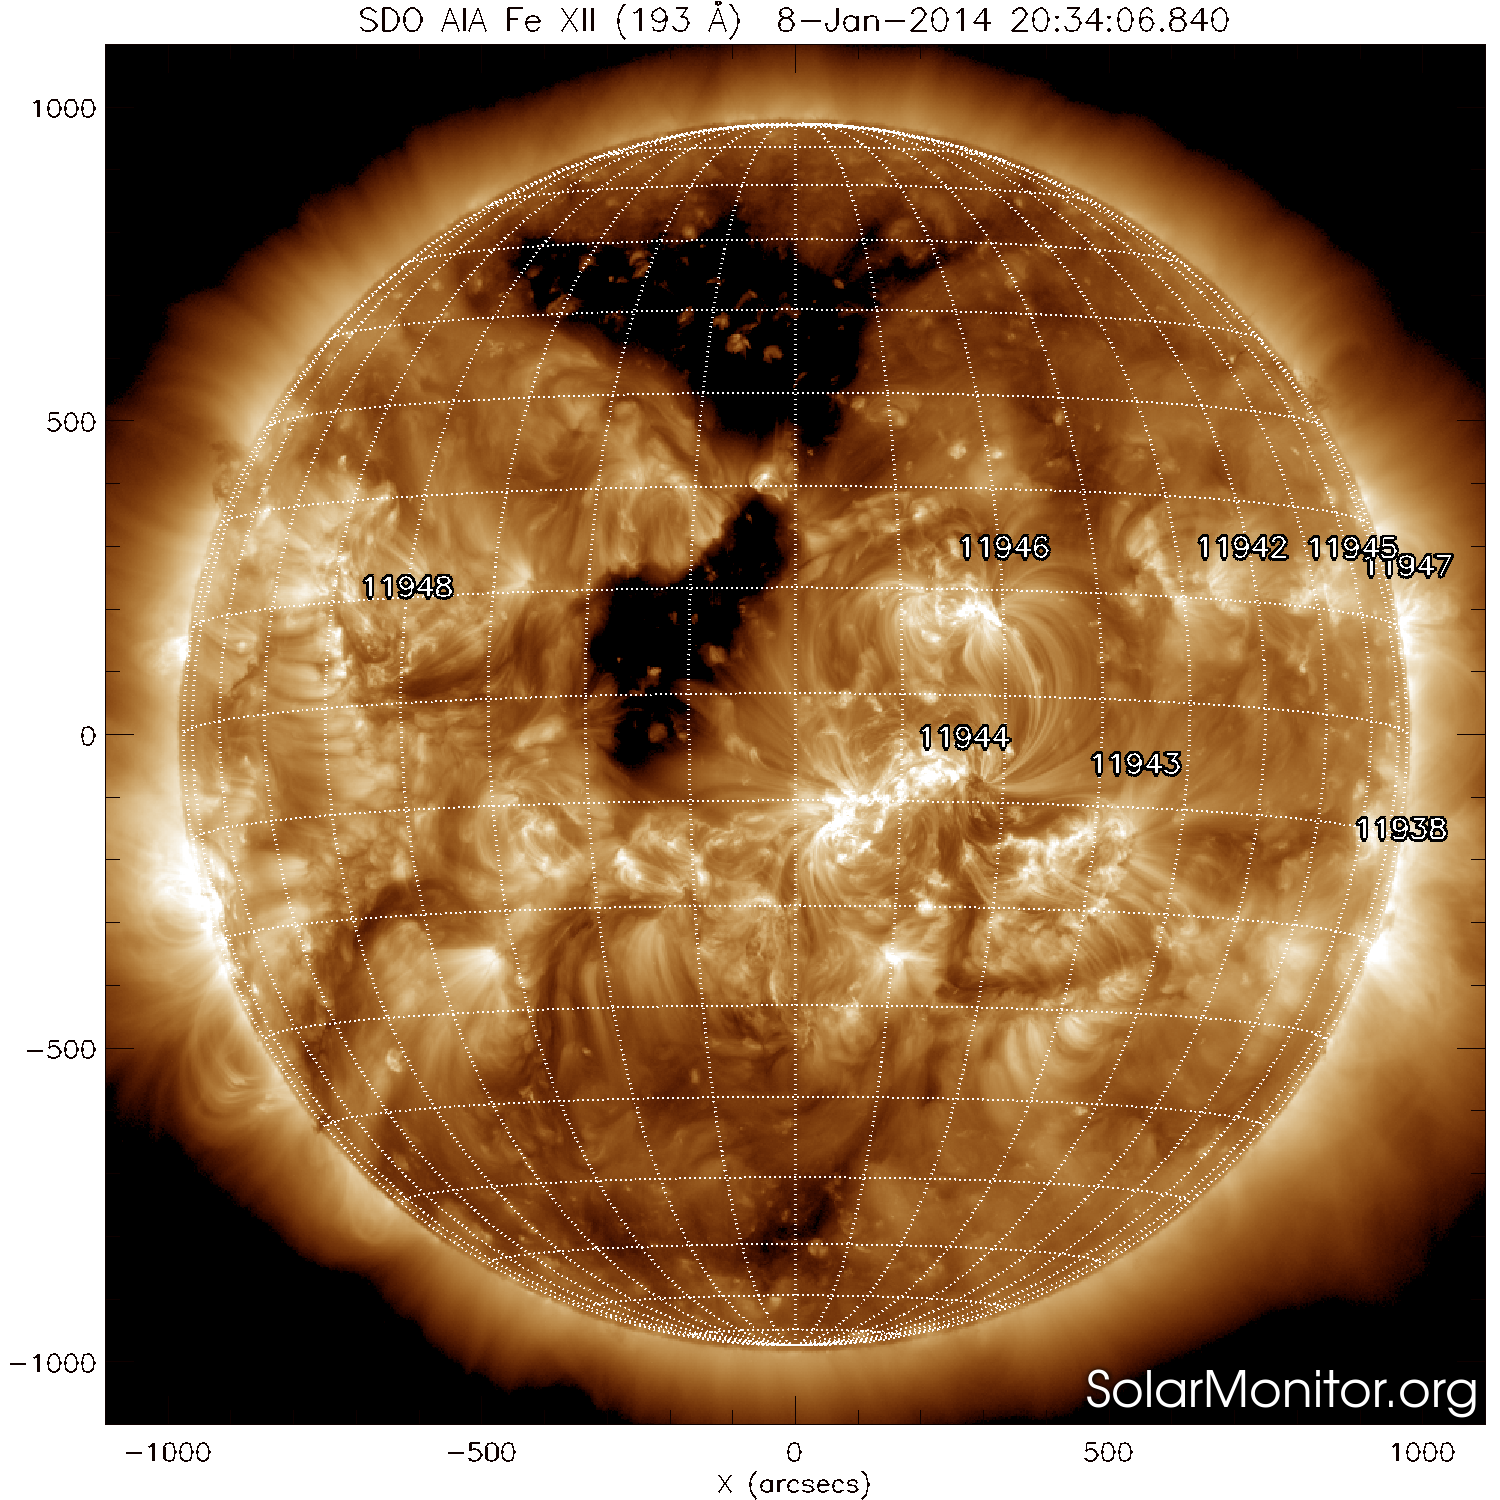
Without a doubt, the big and complex sunspot group NOAA 1944 was the talk of the week. During its transit over the solar disk (1-14 January), it produced 1 X- and 7 M-class solar flares. Here we will deal with some of the more enigmatic aspects of the group's size and the X-class flare it produced.
The short answer is yes. We have to go back to July 2004 (previous solar cycle SC23) to find a significantly bigger group (NOAA 10652). However, determining the area of a sunspot group is not an easy task. It depends on factors such as the medium used (drawing, picture, filter,...) and the calculation methodology (e.g. area of individual spots or one size fits all,...), as can be seen in sketches underneath. Moreover, if one wants to know the true size of the group, one has to correct for the line-of-sight. Indeed as the Sun is a sphere, a sunspot near the limb looks a lot smaller than an equally sized sunspot near the disk's center. Hence, small deviations in the measurements may result in a very different outcome for the sunspot area.
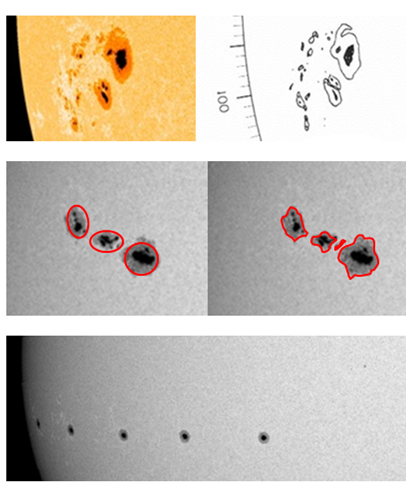
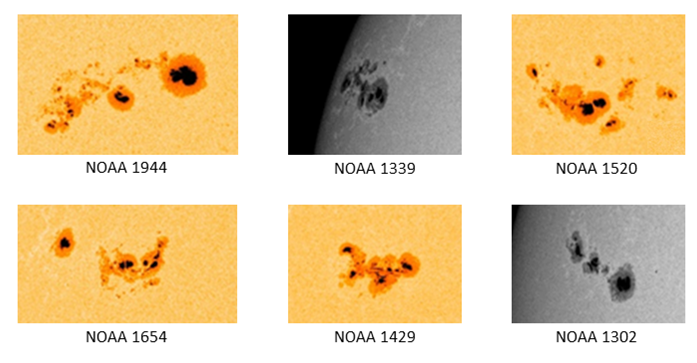
For all these reasons, the area data can differ substantially from one source to the other. Applying this consistently on SDO/HMI imagery, it turns out that the maximum area for NOAA 1944 (7 January 2014) seems indeed to be slightly larger than that of NOAA 1339 (3 November 2011, limb!) and NOAA 1520 (10 July 2012), resp. about 1% and 4%. These three groups were significantly larger than 3 other substantial groups of SC24: NOAA 1654 (11 January 2013), NOAA 1429 (7 March 2012), and NOAA 1302 (24 September 2011), by about 40%. A family portrait of these sunspot regions can be found underneath.
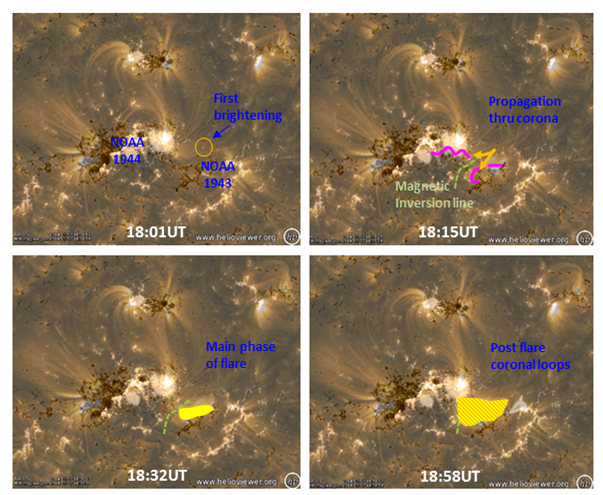
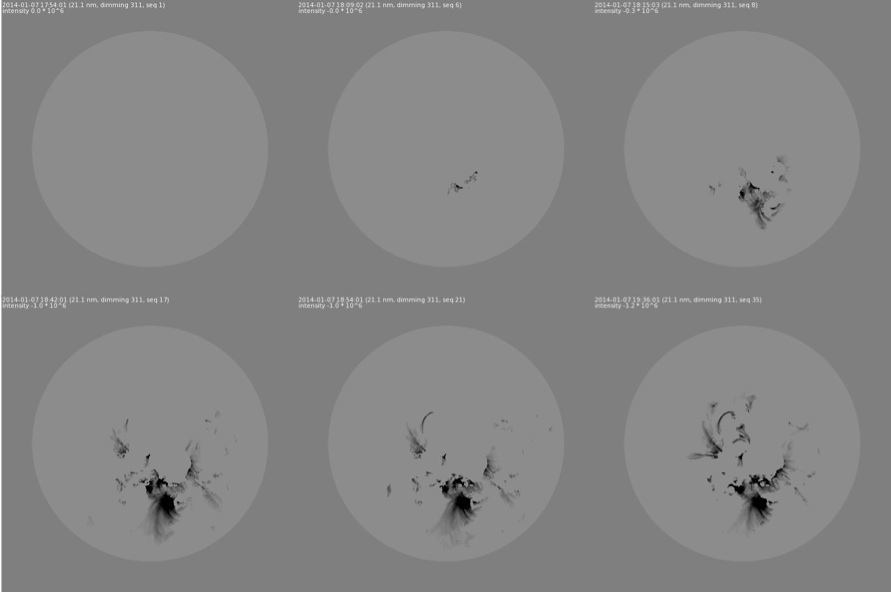
On 7 January, NOAA 1944 produced 2 strong flares: An M7 flare peaking at 10:13UT, and a few hours later at 18:32UT, a powerful X-class flare (number 28 of the ongoing solar cycle 24). The M-class flare clearly took place in the trailing part of NOAA 1944, but ascribing the location of the X1.2 flare to NOAA 1944 proved to be a little more difficult, as can be seen in this movie at http://youtu.be/Khru9ig_pS4
The reason for the problem was that the brightest part of the flare was located over the trailing part of the -at that time- spotless region NOAA 1943. The movie shows that the initial brightening took place to the north of the trailing part of NOAA 1943, and to the west of NOAA 1944's main spot. Then, it propagated southwards alongside the magnetic inversion line (see sketch underneath). Clearly, there's an interaction between the two regions, i.e. the positive (white) magnetic polarity part of NOAA 1944 and the negative (black) spotless portion of NOAA 1943. From a forecaster's point of view, the attribution of the X-class flare to NOAA 1944 is certainly a great decision. Indeed, it avoids exceedingly high probabilities on X-class flares for future spotless active regions! But on what exactly happened during the 7 January event in the solar corona, the jury is still out.
The issue here is that proton flares are not considered as separate events if the proton flux (particle energies larger than 10 MeV) at the time of the event is still above the threshold of 10 protons per flux unit (pfu). A nice example is the sunspot group NOAA 10720 from January 2005 (very similar in size as NOAA 1944): There was one single proton event covering 3 strong X-class solar flares (all from NOAA 10720) that kept the proton flux well above the 10-pfu-threshold for nearly a week (16-22 January 2005)!
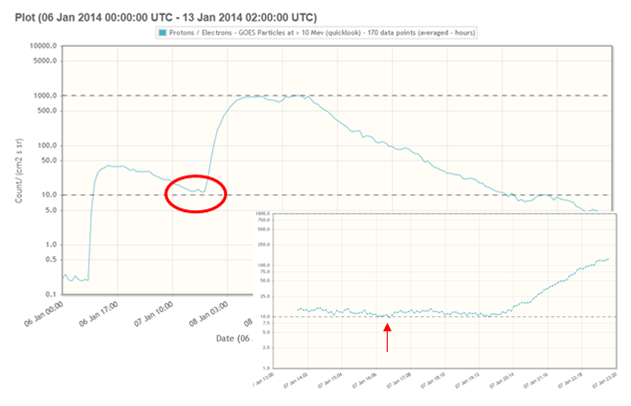
In the case of the 7 January X1-flare, the proton flux was already elevated due to a flare from NOAA 1936 which had rounded the west solar limb 2 days before (so not visible anymore from Earth!). As a result, this flare did not leave an x-ray signature, but the protons started to increase the flux on 6 January at 08:20UT. The flux peaked already at 42 pfu in the afternoon of the same day. The flux only gradually decreased, and by the time it started to increase again due to the X1-flare (around 19:00UT the next day), it was still slightly above the event threshold. However, at one data-point (16:30UT), it had dipped just below the threshold. So technically, this can be considered as a separate proton flare. The proton events are currently listed as separate items on the NOAA's Solar Energetic Particle page (http://umbra.nascom.nasa.gov/SEP/ ). In the end, the proton flux rose to 1033 pfu, making it the strongest event since 22-25 May 2013.
Credits - Data and imagery were taken from SDO (http://sdo.gsfc.nasa.gov/), SOHO (http://sohowww.nascom.nasa.gov/ ), Kanzelhohe (http://cesar.kso.ac.at/), NOAA/GOES (http://www.swpc.noaa.gov/ftpdir/lists/particle/), and NOAA/SESC (http://umbra.nascom.nasa.gov/SEP/). Tools used were STAFF (http://www.staff.oma.be/#) and (J)Helioviewer (http://www.helioviewer.org/).
Solar flare activity fluctuated between low and high during the week.
In order to view the activity of this week in more detail, we suggest to go to the following website from which all the daily (normal and difference) movies can be accessed: http://proba2.oma.be/ssa
This page also lists the recorded flaring events.
A weekly overview movie can be found here (SWAP week 198).
http://proba2.oma.be/swap/data/mpg/movies/WeeklyReportMovies/WR198_Jan06_Jan12/weekly_movie_2014_01_06.mp4
Details about some of this week's events, can be found further below.
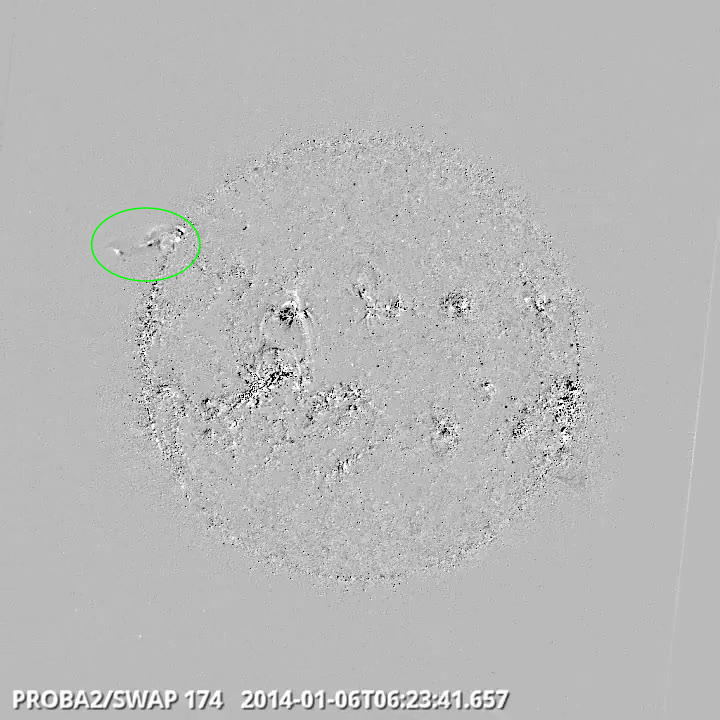
Eruption on the north east limb @ 06:23 SWAP difference image
Find a movie of the events here (SWAP difference movie)
http://proba2.oma.be/swap/data/mpg/movies/WeeklyReportMovies/WR198_Jan06_Jan12/Events/20140106_Eruption_NortEastLimb_0623_swap_diff.mp4
Find a movie of the events here (SWAP movie)
http://proba2.oma.be/swap/data/mpg/movies/WeeklyReportMovies/WR198_Jan06_Jan12/Events/20140106_Eruption_NortEastLimb_0623_swap_movie.mp4
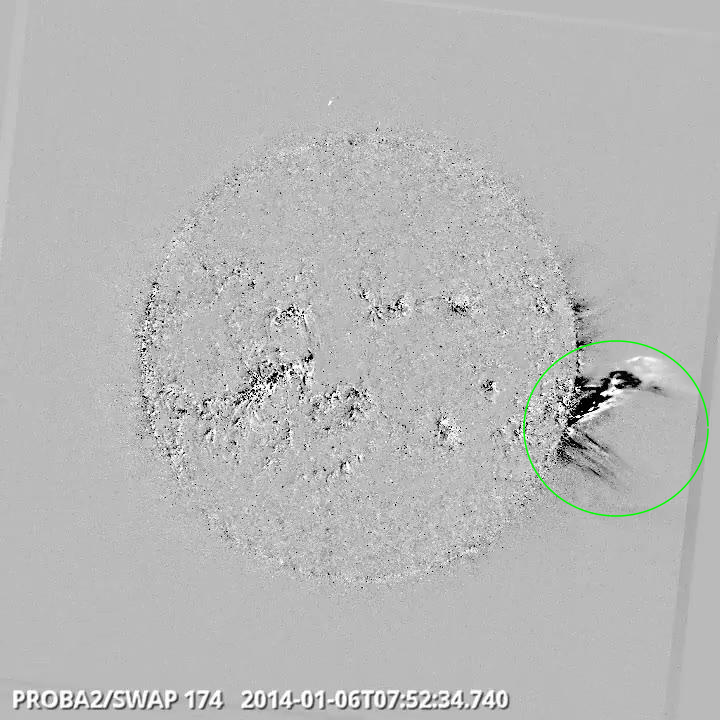
Eruption on the west limb @ 07:52 SWAP difference image
Find a movie of the events here (SWAP difference movie)
http://proba2.oma.be/swap/data/mpg/movies/WeeklyReportMovies/WR198_Jan06_Jan12/Events/20140106_Eruption_WestLimb_0752_swap_diff.mp4
Find a movie of the events here (SWAP movie)
http://proba2.oma.be/swap/data/mpg/movies/WeeklyReportMovies/WR198_Jan06_Jan12/Events/20140106_Eruption_WestLimb_0752_swap_movie.mp4

Xflare and eitwave on the south half @ 18:11 SWAP difference image
Find a movie of the events here (SWAP difference movie)
http://proba2.oma.be/swap/data/mpg/movies/WeeklyReportMovies/WR198_Jan06_Jan12/Events/20140107_XflareEitwave_SouthHalf_1811_swap_diff.mp4
Find a movie of the events here (SWAP movie)
http://proba2.oma.be/swap/data/mpg/movies/WeeklyReportMovies/WR198_Jan06_Jan12/Events/20140107_XflareEitwave_SouthHalf_1811_swap_movie.mp4
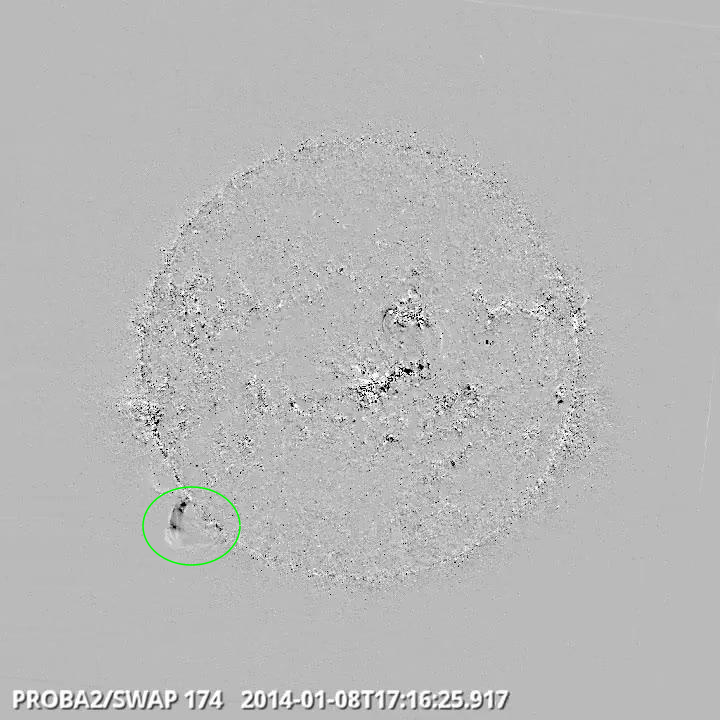
Eruption on the southeast Limb @ 17:16 SWAP difference image
Find a movie of the event here (SWAP difference movie)
http://proba2.oma.be/swap/data/mpg/movies/WeeklyReportMovies/WR198_Jan06_Jan12/Events/20140108_Eruption_SouthEastLimb_1716_swap_diff.mp4
In the week of January 6 to January 12, 34 C flares, 3 M flares and one X flare were observed.
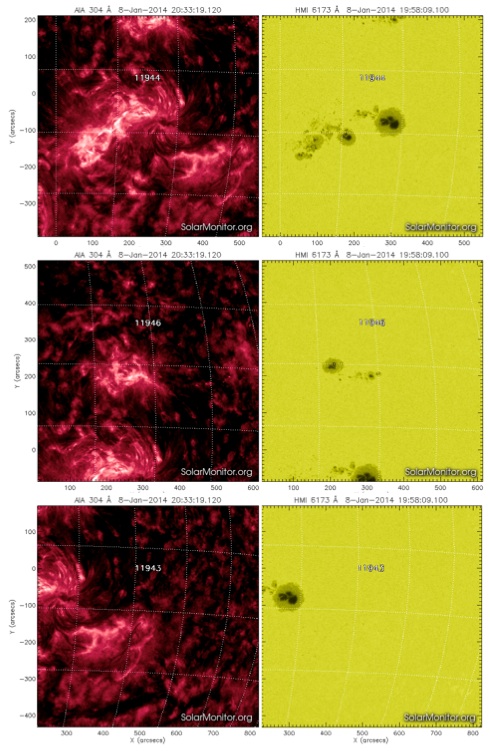
Catania sunspot group 98 (NOAA AR 1944), classified as a beta-gamma-delta group, was the most active throughout the whole week. The sunspot group was magnetically connected with Catania sunspot group 97 (NOAA AR 1946) and spotless region NOAA AR 1943. See below the active regions and underlying sunspots as they appeared in SDO/AIA 193, 304 and HMI 6173.

| DAY | BEGIN | MAX | END | LOC | XRAY | OP | 10CM | TYPE | Cat | NOAA |
| 07 | 0349 | 0353 | 0356 | N7E8 | M1.0 | 1N | 97 | 1946 | ||
| 07 | 1007 | 1013 | 1037 | S13E11 | M7.2 | 2B | 480 | 98 | 1944 | |
| 07 | 1804 | 1832 | 1858 | S15W11 | X1.2 | 2N | 8300 | II/2 | 98 | 1944 |
| 08 | 0339 | 0347 | 0354 | N11W81 | M3.6 | SF | 100 | III/2II/2 | 1947 |
| LOC: approximate heliographic location | TYPE: radio burst type |
| XRAY: X-ray flare class | Cat: Catania sunspot group number |
| OP: optical flare class | NOAA: NOAA active region number |
| 10CM: peak 10 cm radio flux |
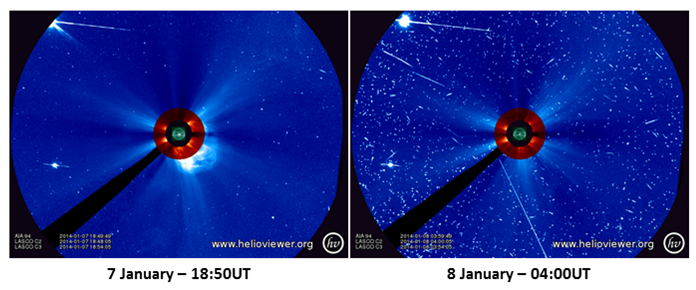
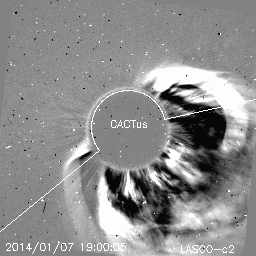
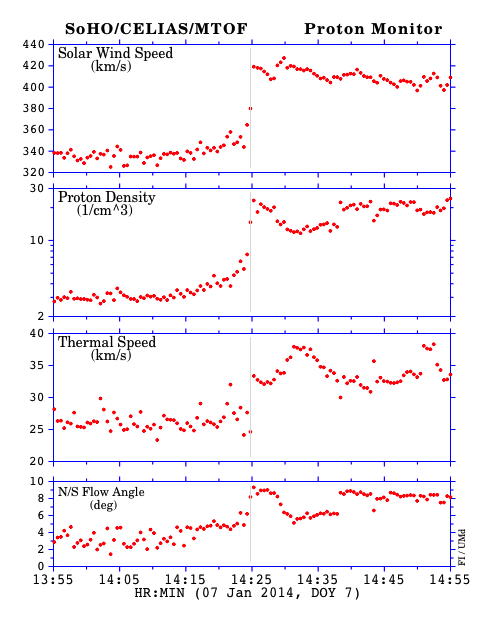
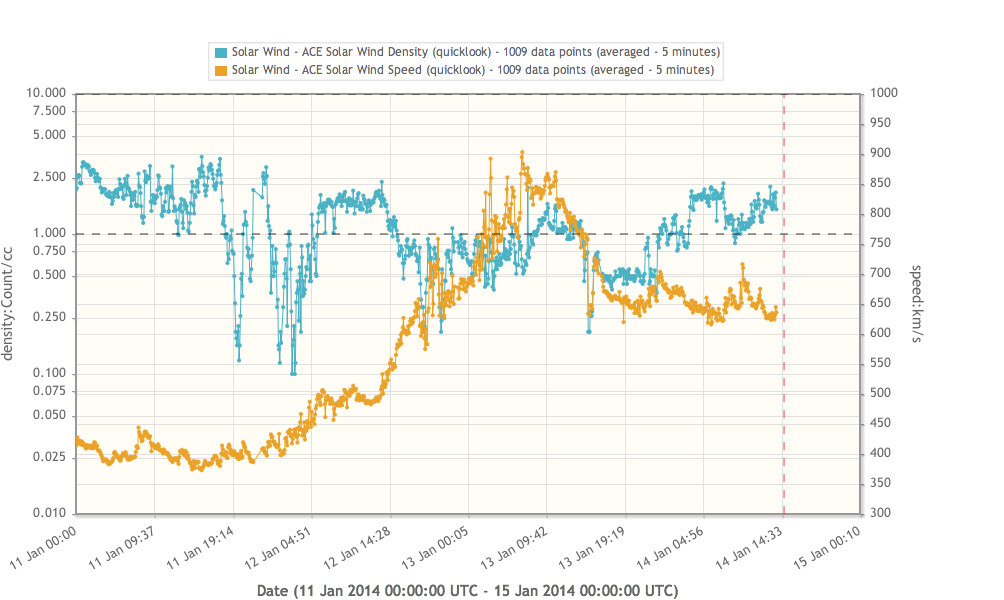
A shock in the solar wind data was observed on January 7 at 14:20 UTC. The shock was related to the arrival of the CME erupting on January 4 which came according into the LASCO/C2 FOV at 21:48 UTC (check http://sidc.oma.be/cactus/catalog/LASCO/2_5_0/qkl/2014/01/latestCMEs.html)
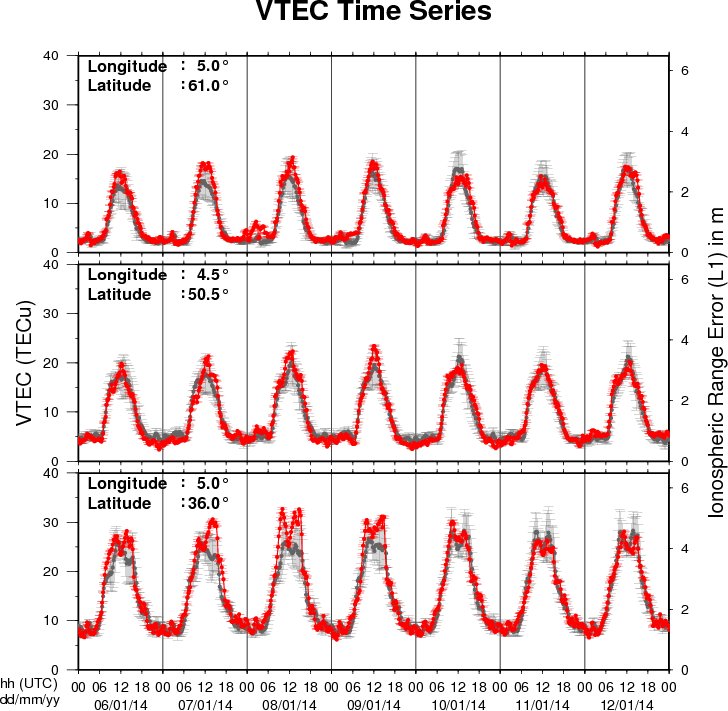
The figure shows the time evolution of the Vertical Total Electron Content (VTEC) (in red) during the last week at three locations:
a) in the northern part of Europe(N61°, 5°E)
b) above Brussels(N50.5°, 4.5°E)
c) in the southern part of Europe(N36°, 5°E)
This figure also shows (in grey) the normal ionospheric behaviour expected based on the median VTEC from the 15 previous days.
The VTEC is expressed in TECu (with TECu=10^16 electrons per square meter) and is directly related to the signal propagation delay due to the ionosphere (in figure: delay on GPS L1 frequency).
The Sun's radiation ionizes the Earth's upper atmosphere, the ionosphere, located from about 60km to 1000km above the Earth's surface.The ionization process in the ionosphere produces ions and free electrons. These electrons perturb the propagation of the GNSS (Global Navigation Satellite System) signals by inducing a so-called ionospheric delay.
See http://stce.be/newsletter/GNSS_final.pdf for some more explanations ; for detailed information, see http://gnss.be/ionosphere_tutorial.php