
The Solar-Terrestrial Centre of Excellence (STCE) is a collaborative network of the Belgian Institute for Space Aeronomy, the Royal Observatory of Belgium and the Royal Meteorological Institute of Belgium.
|
Published by the STCE - this issue : 31 Jan 2014. The Solar-Terrestrial Centre of Excellence (STCE) is a collaborative network of the Belgian Institute for Space Aeronomy, the Royal Observatory of Belgium and the Royal Meteorological Institute of Belgium. |
| Archive of the newsletters | Subscribe to this newsletter by mail |
390 scientists, satellite and network operators from 36 countries worldwide gathered in Antwerp from November 18-22, 2013 to discuss the theme Space Weather during the tenth edition of the European Space Weather Week (ESWW). It was the community itself that proposed the discussion topics, workshops, discussion fora, work meetings.
This successful approach will be extrapolated to the 2014 edition that takes place from November 17-21, Belgium.
The ESWW committee wants to offer a discussion and work platform for the space weather community and launches hereby a call for sessions and splinters: go to
http://www.stce.be/esww11
or directly to the online application form
http://www.stce.be/Survey/
We are looking forward for your input!

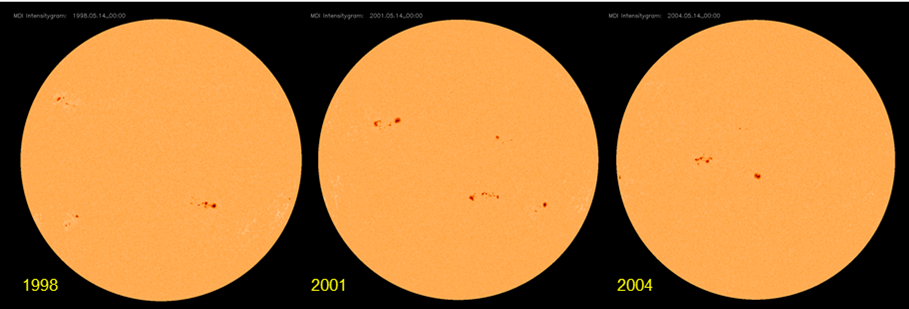
It is a well-known feature of the solar cycle that its first sunspot groups appear at high solar latitudes. These sunspots appear a few months prior to the solar cycle minimum around 30 degrees away from the solar equator. As the solar cycle progresses, the sunspot groups gradually appear closer to the solar equator, with -during maximum- a heliographic latitude of about 15 degrees. As the solar cycle heads for the next minimum, the sunspot groups appear even closer to the solar equator, gradually becoming smaller and disappearing while the sunspots of the new solar cycle manifest themselves again at high latitudes. The evolution can be seen in images underneath for solar cycle 23 (SOHO/MDI: June 1998, 2001, and 2004).
This movement of sunspots can also be followed in a diagram showing the latitude of sunspot groups over time. As it resembles the wings of a butterfly, it is called a butterfly-diagram. The first such diagram was published by Walter Maunder (yes, the guy from the "Maunder Minimum"!) in the early 1900's. More than 100 years later, it is believed this butterfly-diagram is a manifestation of the solar dynamo, but the precise mechanism still eludes scientists.
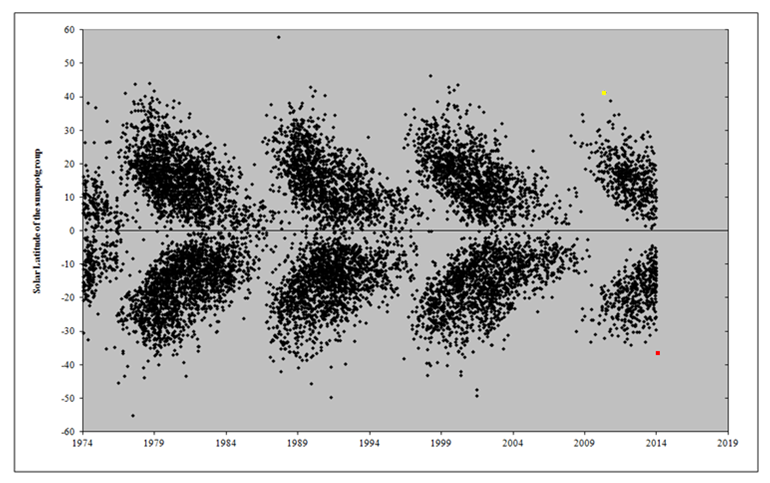
Nearly 95% of all sunspot groups appear in a belt extending 30 degrees on each site of the solar equator, and nearly three quarters appear within 20 degrees of the solar equator. For the ongoing solar cycle, this was not different. Only a handful of spots had a latitude of more than 35 degrees. NOAA 11069, a reasonably sized sunspot group that appeared in May 2010, has the highest latitude with +41 degrees.
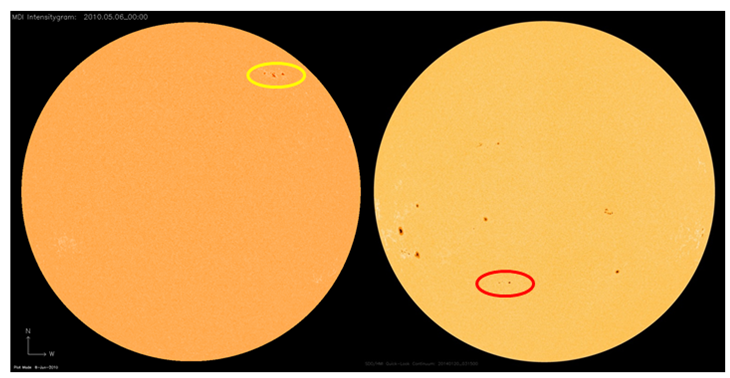
On the southern hemisphere, not a single sunspot group with a latitude over 35 degrees had been observed so far. That changed last week, with the appearance of NOAA 11962 attaining a latitude of -37 degrees. It is not uncommon that at this phase (maximum) of the solar cycle, sunspot groups still appear at these high latitudes. Also, they are not necessarily small and inactive. An extreme example is NOAA 6659 which appeared in June 1991. This sunspot region was one of the largest and most flare active of solar cycle 22, and had a respectable latitude of +31 degrees.
Credits - Data and imagery were taken from SDO (http://sdo.gsfc.nasa.gov/) and SOHO (http://sohowww.nascom.nasa.gov/), USET (http://www.sidc.be/uset/), and Solar Monitor (http://www.solarmonitor.org/).
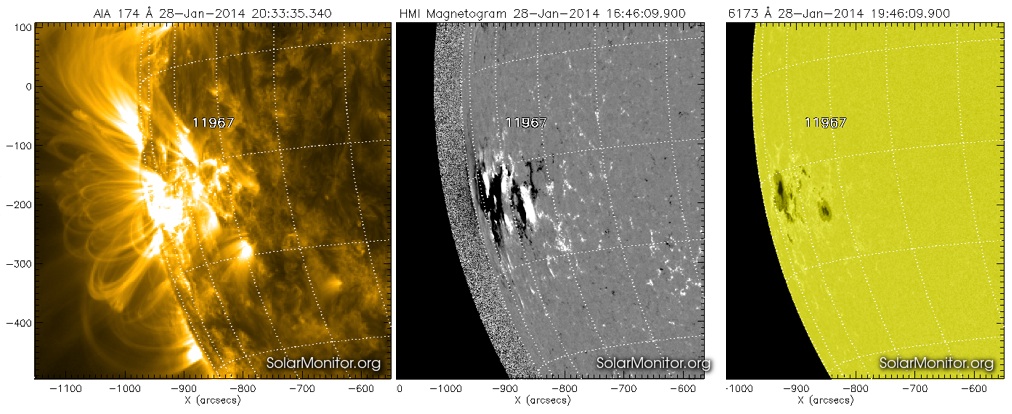
Five sunspot groups exhibited flaring activity on the C-level, with Catania numbers 10, 15, 17, 18, and 20 (NOAA ARs 1952, 1955, 1959, 1960, and 1963, respectively). Two weak C-class flares also originated from two active regions (NOAA AR 1967/Cat 28 and NOAA AR 1968/Cat 27) situated right behind the east limb on January 26. The strongest flare of the week was the C6.1 flare peaking at 10:13 UT on January 26 in the NOAA AR 1960.
NOAA AR 1967/Cat 28 looked indeed promising turning in its full glory over the east limb.
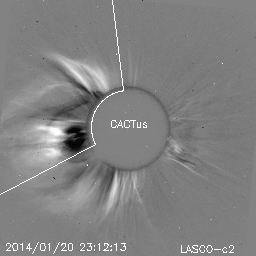
A partial halo CME was detected by SOHO/LASCO on January 20, first visible in the LASCO C2 field of view at 15:24 UT. The CME had the angular width of around 230 degrees and the speed around 550 km/s. STEREO/EUVI B data show that the CME was associated with a far side eruption (as seen from the Earth) with the source region located around S15E170.
Another halo CME was detected by SOHO/LASCO on January 20, first visible in the LASCO C2 field of view at 22:12 UT. The bulk of the CME erupted toward the east, but there were weak extensions to form a full halo. The projected plane-of-the-sky speed of the CME was around 1000 km/s (with a big uncertainty due to a not well-formed front). SDO/AIA data show that the CME was associated with coronal dimmings and a C3.6 flare peaking at 22:49 UT in the Catania sunspot group 20 (NOAA AR 1963). The CME-associated interplanetary disturbance did not arrive at the Earth.
A partial halo CME was detected by SOHO/LASCO on January 21. The CME was first seen in LASCO/C2 at 21:28UT, an angular width of around 180 degrees at 22:24UT and a speed around 900 km/s. Inspection of STEREO/EUVI B data indicates that the CME was associated with a far side eruption (as seen from the Earth) starting around 21:06 UT, with the source region situated around S15E150.
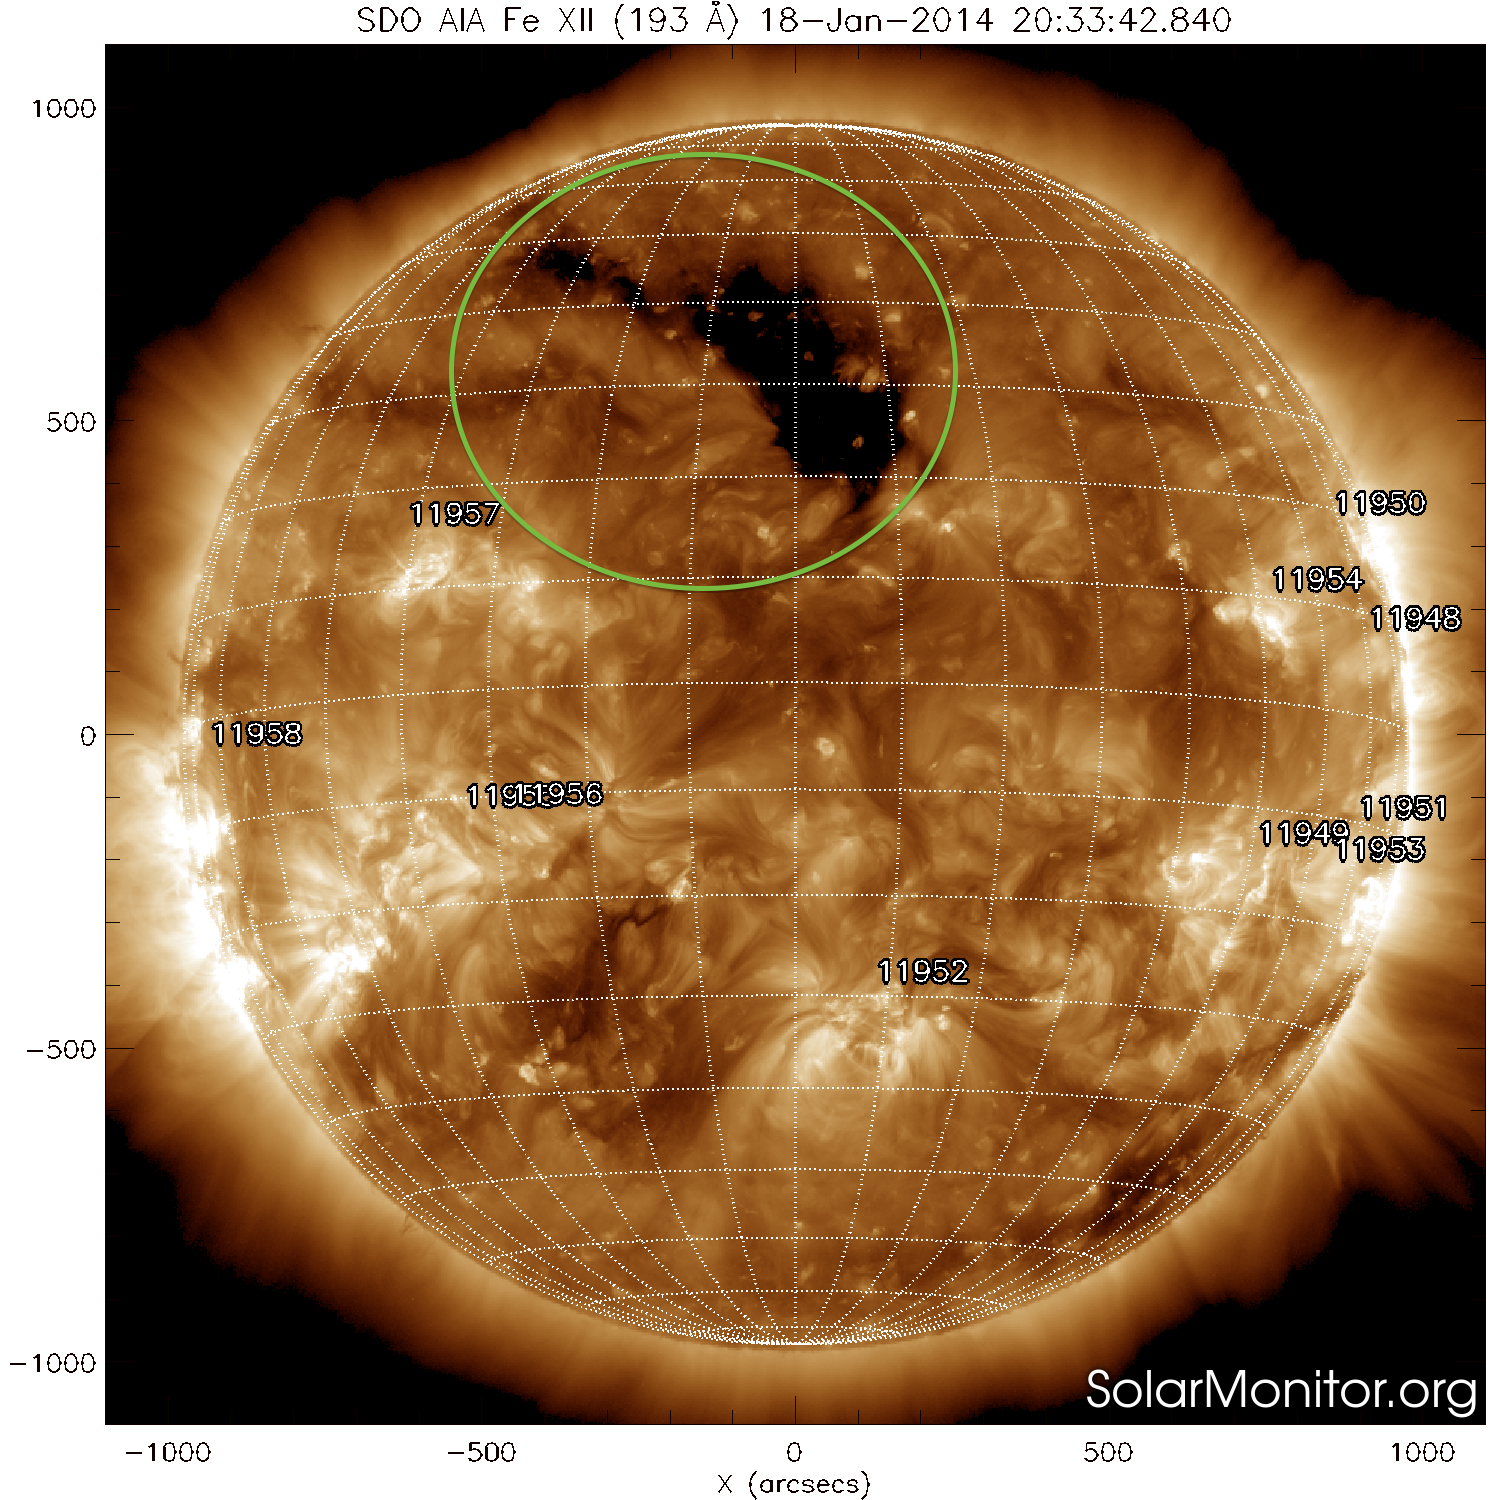
In the beginning of the week, the Earth was inside a slow solar wind flow, and the geomagnetic conditions were quiet. Late on January 20, an interaction region between the slow and the fast solar wind flows arrived, followed by the fast flow late on January 21. The fast flow (with its peak speed around 620 km/s) was produced by a low-latitude coronal hole in the northern hemisphere that reached the solar central meridian on January 18.
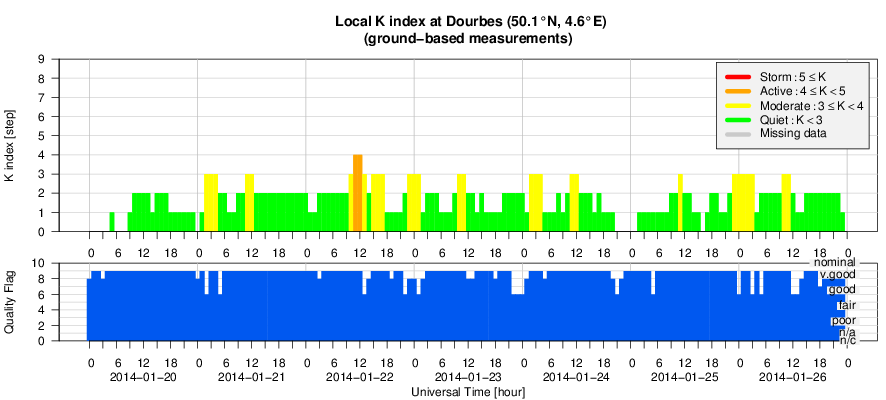
Solar flare activity fluctuated between very low and low during the week.
In order to view the activity of this week in more detail, we suggest to go to the following website from which all the daily (normal and difference) movies can be accessed: http://proba2.oma.be/ssa
This page also lists the recorded flaring events.
A weekly overview movie can be found here (SWAP week 200)
http://proba2.oma.be/swap/data/mpg/movies/WeeklyReportMovies/WR200_Jan20_Jan26/weekly_movie_2014_01_20.mp4
Details about some of this week's events, can be found further below.
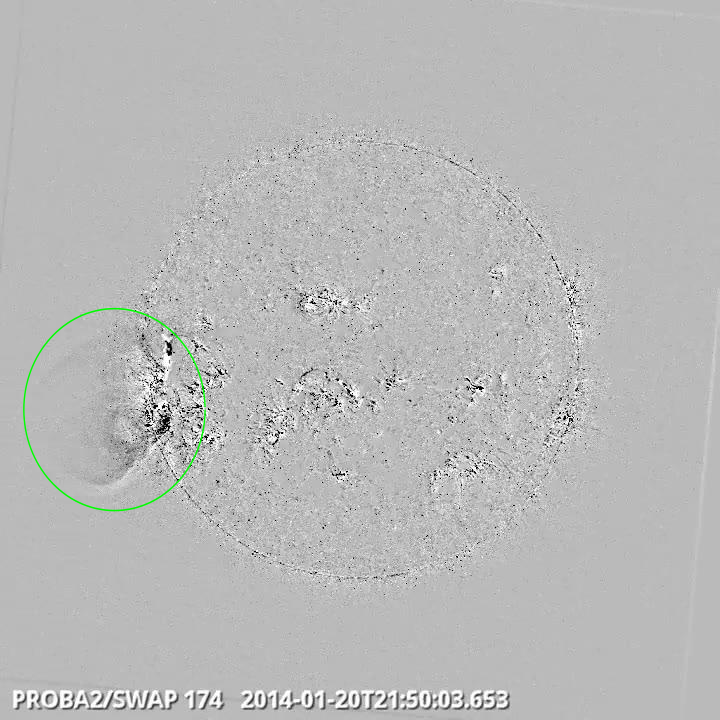
Eruption on the east limb @ 21:50 SWAP difference image
Find a movie of the events here (SWAP difference movie)
http://proba2.oma.be/swap/data/mpg/movies/WeeklyReportMovies/WR200_Jan20_Jan26/Events/20140120_Eruption_EastLimb_2150_swap_diff.mp4

Eruption on the south west quad @ 17:01 SWAP difference image
Find a movie of the event here (SWAP difference movie)
http://proba2.oma.be/swap/data/mpg/movies/WeeklyReportMovies/WR200_Jan20_Jan26/Events/20140121_Eruption_SouthWest_1701_swap_diff.mp4
Find a movie of the event here (SWAP movie)
http://proba2.oma.be/swap/data/mpg/movies/WeeklyReportMovies/WR200_Jan20_Jan26/Events/20140121_Eruption_SouthWest_1701_swap_movie.mp4
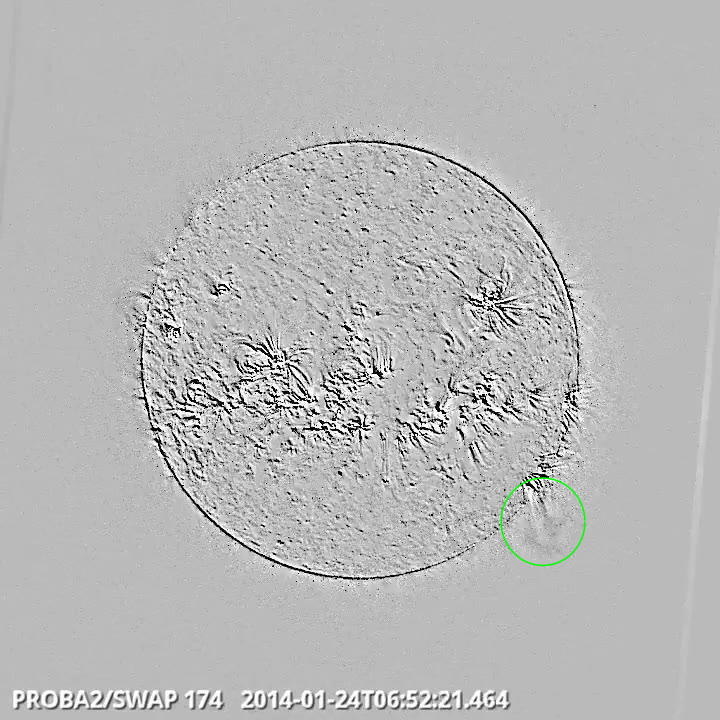
Eruption on the south west quad @ 06:21 SWAP difference image
Find a movie of the event here (SWAP difference movie)
http://proba2.oma.be/swap/data/mpg/movies/WeeklyReportMovies/WR200_Jan20_Jan26/Events/20140124_Eruption_SouthWestLimb_0652_swap_diff.mp4
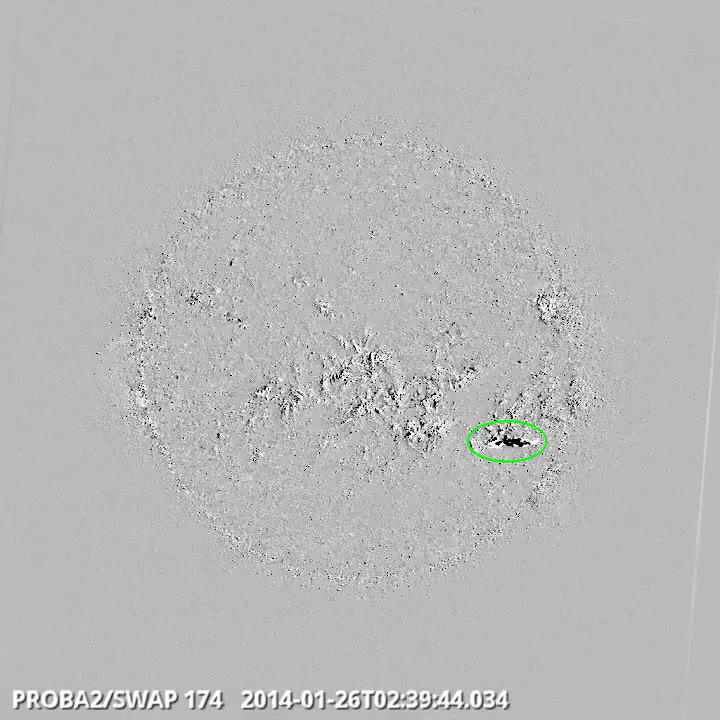
Eruption on the south west quad @ 02:39 SWAP difference image
Find a movie of the event here (SWAP difference movie)
http://proba2.oma.be/swap/data/mpg/movies/WeeklyReportMovies/WR200_Jan20_Jan26/Events/20140126_Eruption_SouthWestQuad_0239_swap_diff.mp4
Find a movie of the event here (SWAP movie)
http://proba2.oma.be/swap/data/mpg/movies/WeeklyReportMovies/WR200_Jan20_Jan26/Events/20140126_Eruption_SouthWestQuad_0239_swap_movie.mp4
Verbeeck, C. et al. 2014: "The SPoCA suite: Software for extraction, characterization, and tracking of active regions and coronal holes on EUV images", A A, 561, 29.
http://adsabs.harvard.edu/abs/2014A%26A...561A..29V
The article discusses the improvements added to the Spatial Possibilistic Clustering Algorithm (SPoCA), which characterizes active regions and coronal holes in EUV images from several satellites, amongst them PROBA2/SWAP.
Kumara, S. T. et al. 2014: "Segmentation of coronal features to understand the solar EUV and UV irradiance variability", A A, 561, 9.
http://adsabs.harvard.edu/abs/2014A%26A...561A...9K
The article discusses the impact that active regions have on the irradiance fluctuations of the Sun using the spatial possibilistic clustering algorithm (SPoCA) on two years of PROBA2/SWAP and SDO/AIA data.
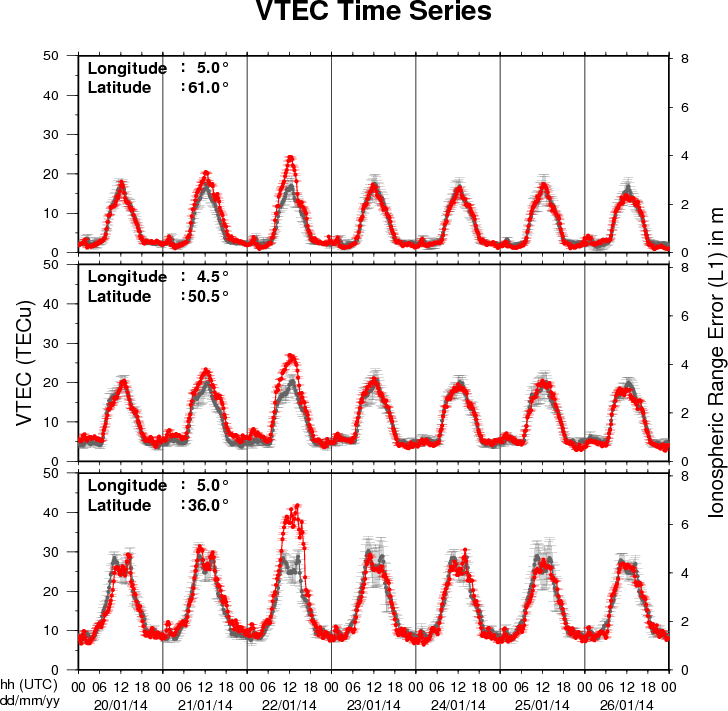
The figure shows the time evolution of the Vertical Total Electron Content (VTEC) (in red) during the last week at three locations:
a) in the northern part of Europe(N61°, 5°E)
b) above Brussels(N50.5°, 4.5°E)
c) in the southern part of Europe(N36°, 5°E)
This figure also shows (in grey) the normal ionospheric behaviour expected based on the median VTEC from the 15 previous days.
The VTEC is expressed in TECu (with TECu=10^16 electrons per square meter) and is directly related to the signal propagation delay due to the ionosphere (in figure: delay on GPS L1 frequency).
The Sun's radiation ionizes the Earth's upper atmosphere, the ionosphere, located from about 60km to 1000km above the Earth's surface.The ionization process in the ionosphere produces ions and free electrons. These electrons perturb the propagation of the GNSS (Global Navigation Satellite System) signals by inducing a so-called ionospheric delay.
See http://stce.be/newsletter/GNSS_final.pdf for some more explanations ; for detailed information, see http://gnss.be/ionosphere_tutorial.php