
The Solar-Terrestrial Centre of Excellence (STCE) is a collaborative network of the Belgian Institute for Space Aeronomy, the Royal Observatory of Belgium and the Royal Meteorological Institute of Belgium.
|
Published by the STCE - this issue : 7 Feb 2014. The Solar-Terrestrial Centre of Excellence (STCE) is a collaborative network of the Belgian Institute for Space Aeronomy, the Royal Observatory of Belgium and the Royal Meteorological Institute of Belgium. |
| Archive of the newsletters | Subscribe to this newsletter by mail |
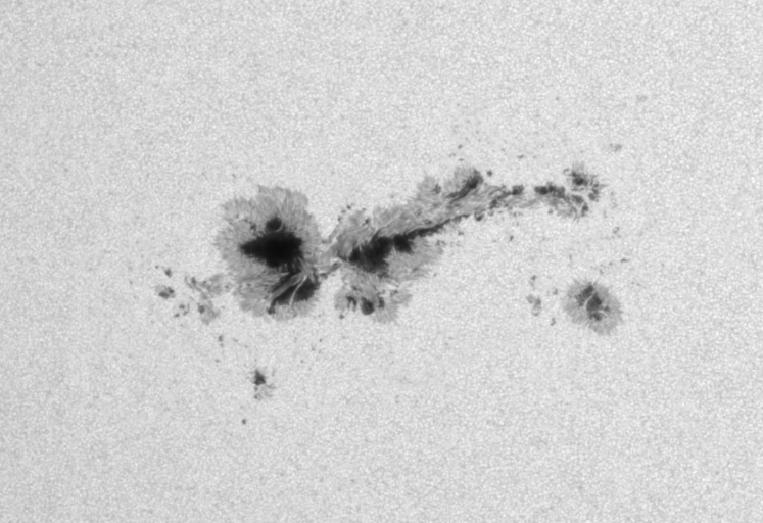
On 27 January, a big, complex region rounded the Sun's east limb and was labelled NOAA 1967. This large sunspot group was the return of NOAA 1944 which appeared early January and was very active at that time, including 7 M- and 1 X-class flare. Using solar eclipse glasses, both groups were easy naked-eye objects.
During the week, NOAA 1967 increased its sunspot area and magnetic complexity. So far, this has resulted in 34 C- and 20 M-class flares. The strongest flare occurred on 30 January (M6.6 peaking at 16:11UT) and was associated with a filament eruption east of NOAA 1967's trailing portion.
Interestingly, this flare did not take place in one of the various strong delta structures of the group (sunspots of opposite magnetic polarity very close to each other: see http://stce.be/news/222/welcome.html). Instead, the eruption took place behind the main spots of the group's trailing section.
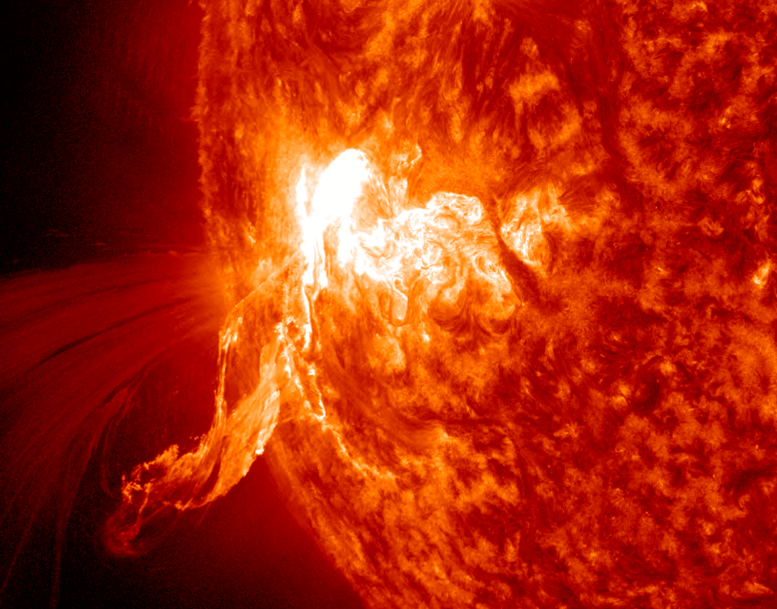
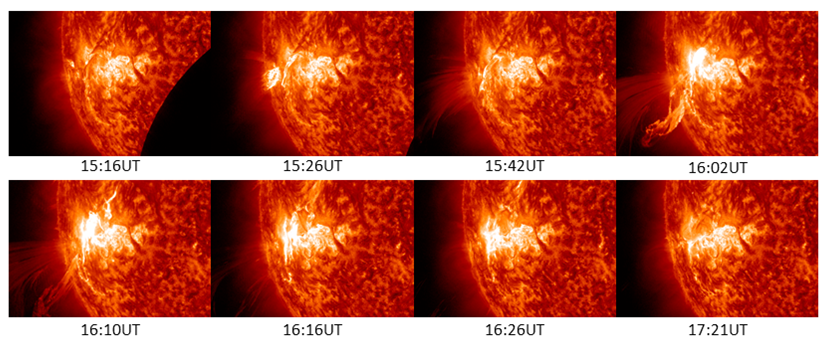
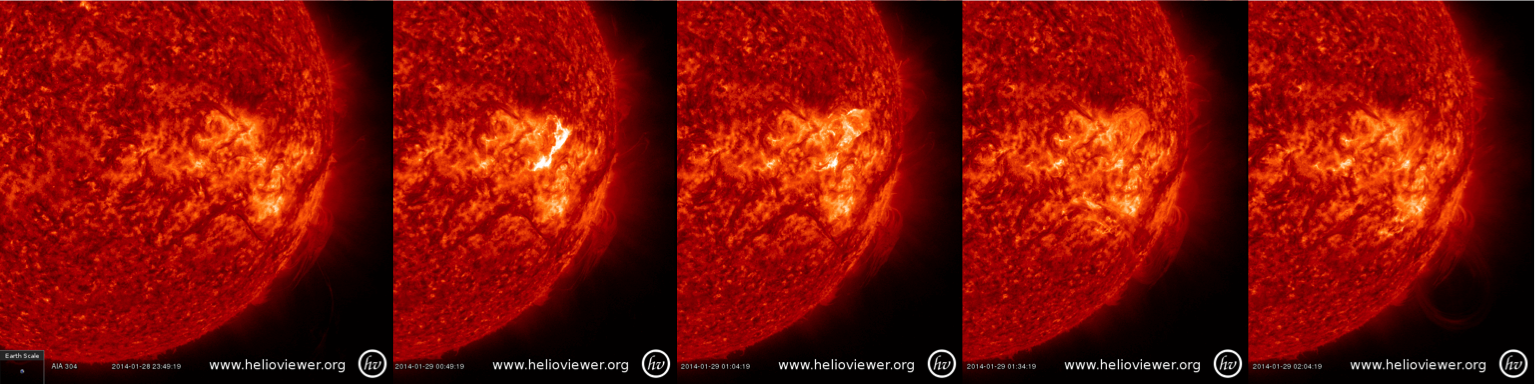
The mosaic underneath shows the various phases of this flare (15:00-18:00UT). First, there was a small flare just behind the filament resulting in a fan shaped plasma ejection. This event resulted in the filament becoming unstable and being ejected. The brightest phase of the flare took place near the top end of the area where the filament was ejected. Finally, over the location of the blast site, a series of post-flare coronal loops were formed (a so-called "arcade").
The movie at http://youtu.be/rKjPA3wDWbo first shows the evolution of NOAA 1967 in white light from 30 January till 2 February. Then follow 3 movies in successively higher temperatures (SDO/AIA 304, 171 and 131 - http://sdo.gsfc.nasa.gov/) showing the evolution of the M6-event from 15:00UT till 18:00UT. In the beginning of each of these 3 movies, the end of a partial lunar eclipse can be seen and the Sun is a little bit shaky. Indeed, the fine guidance systems on AIA and HMI can't work because they need to see the whole Sun to keep the images centered from exposure to exposure. Steady images resumed once the eclipse was over.
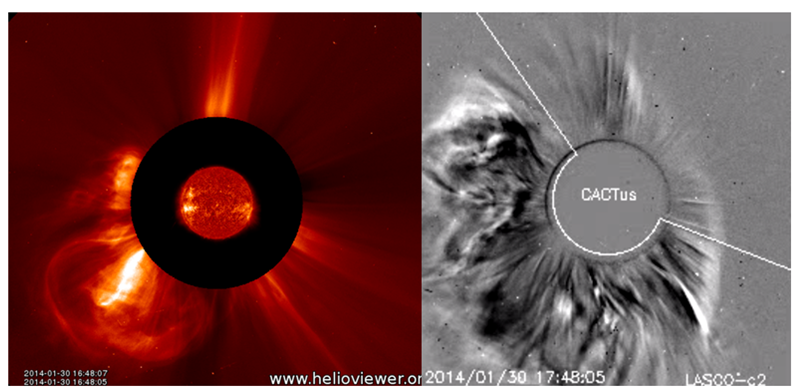
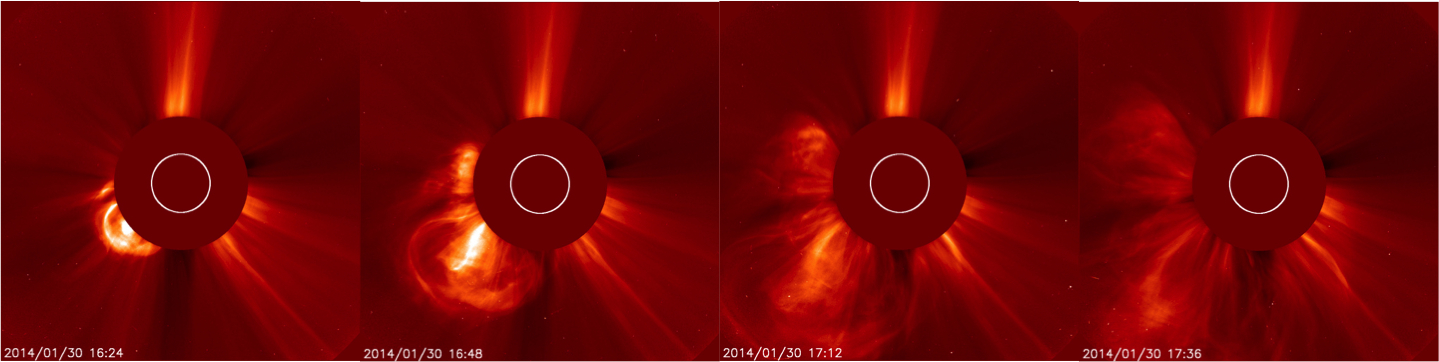
The movie ends with LASCO/C2 clips from the associated full halo coronal mass ejection (CME) in white light and difference imagery, first seen in LASCO/C2 (SOHO: http://sohowww.nascom.nasa.gov/home.html ) imagery at 16:12UT. The glancing blow of this CME arrived late on 2 February, but the impact was weak and geomagnetic conditions remained quiet.
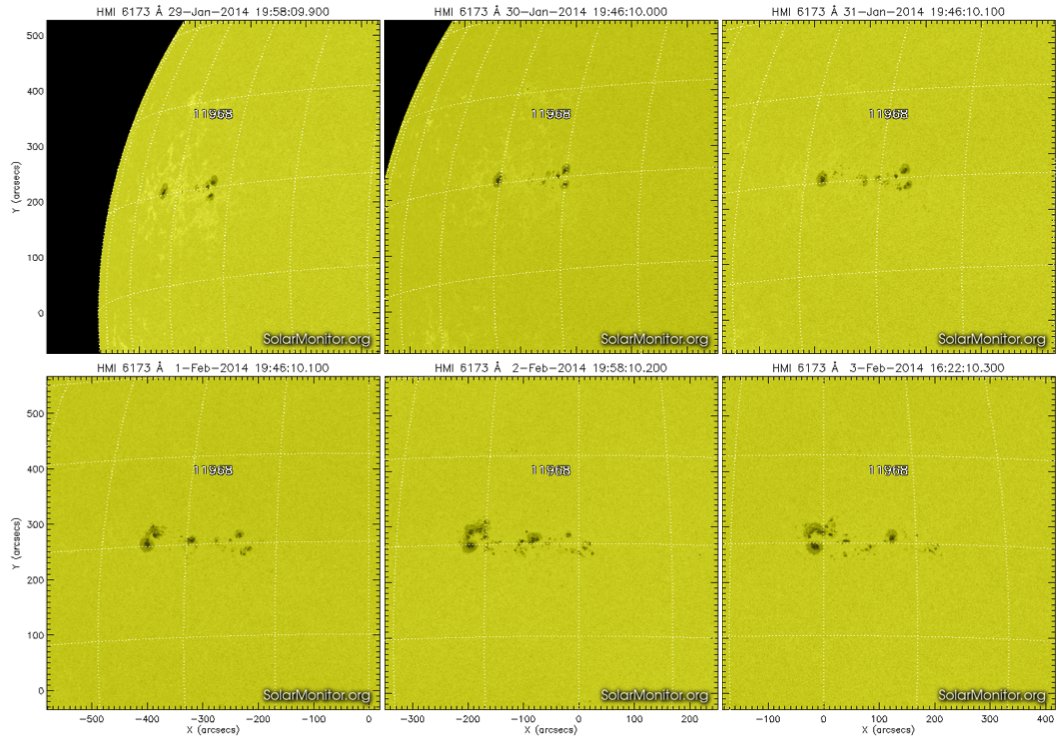
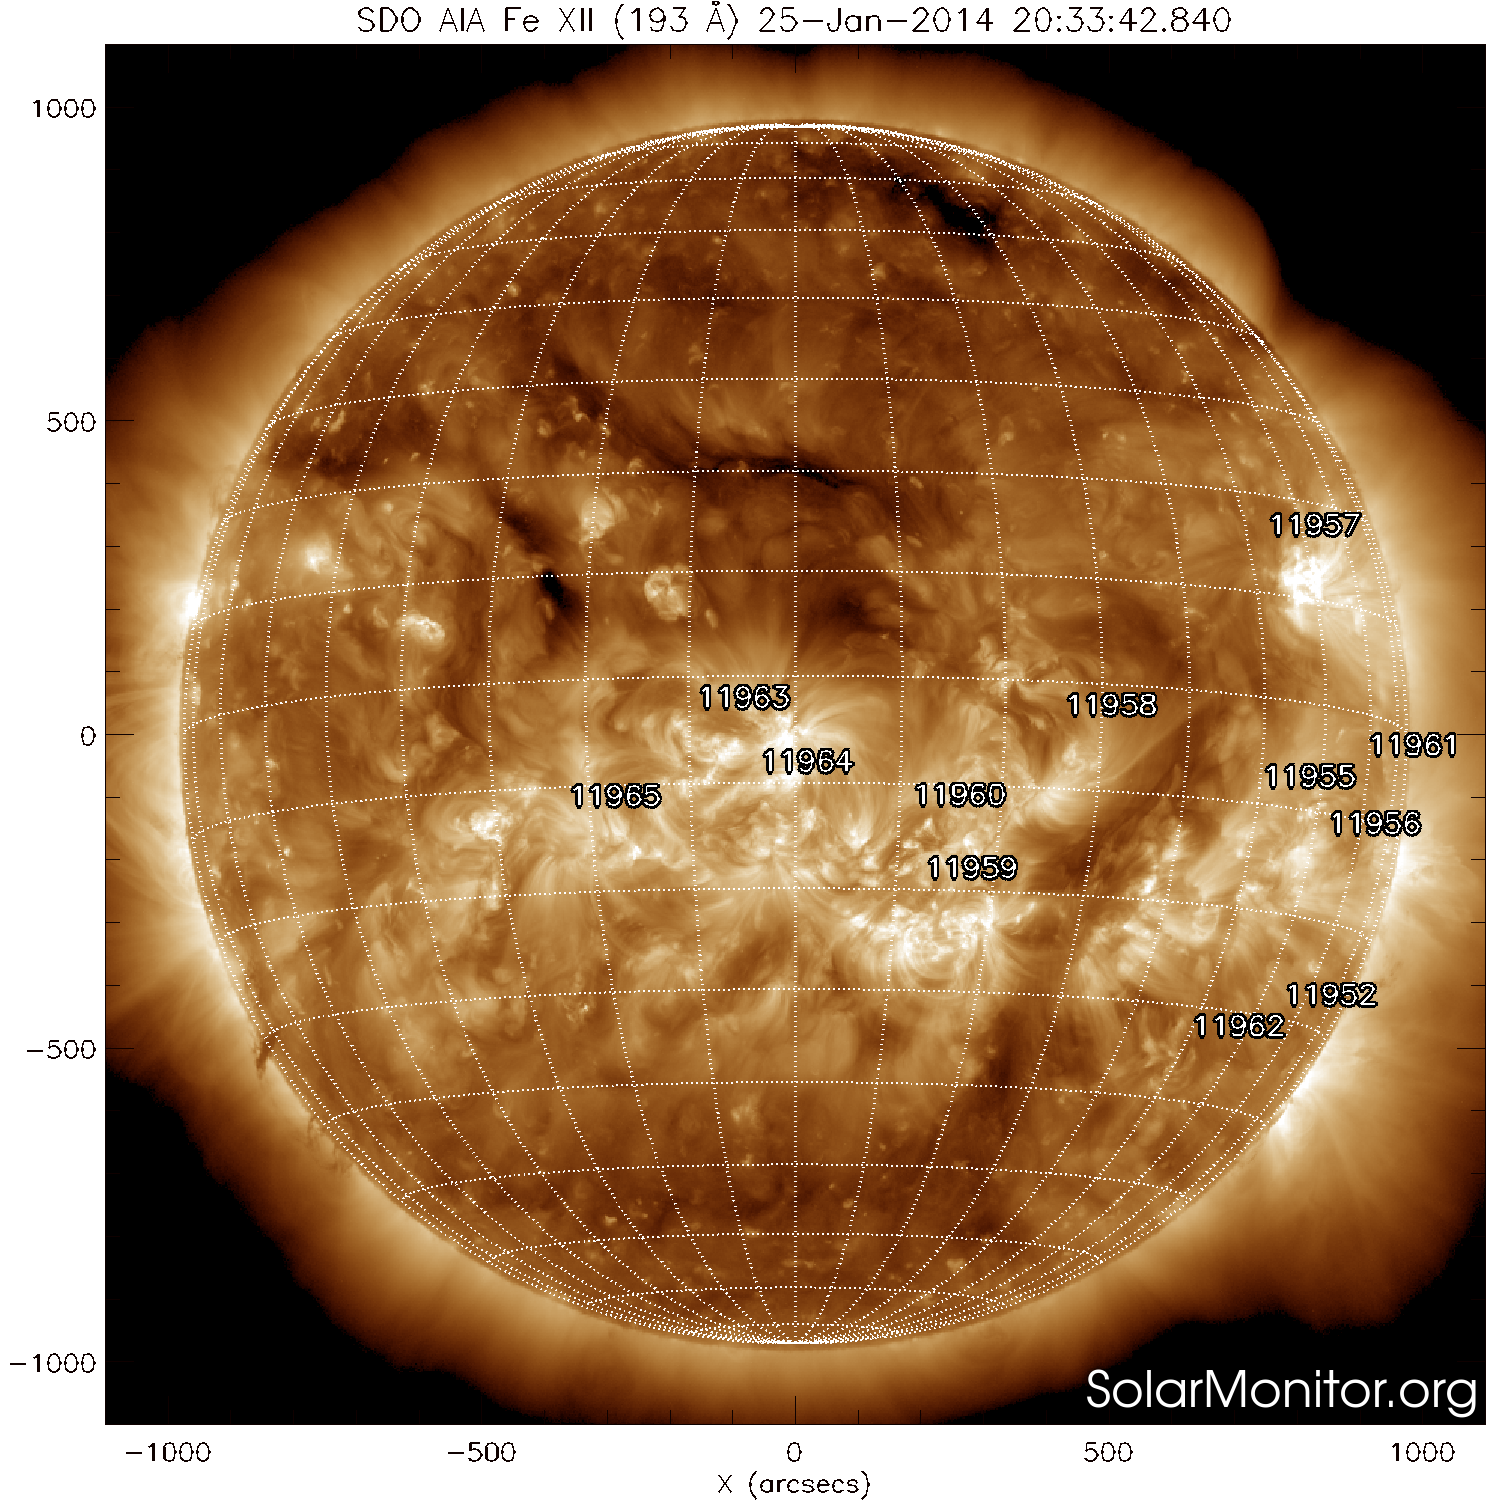
Solar activity has been at active levels all week, mainly due to active region NOAA 1967. This large sunspot group was the return of NOAA 1944 which appeared early January and was very active at that time (incl. 7 M- and 1 X-class flare). NOAA 1967 rounded the east limb on 27 January and increased its sunspot area and magnetic complexity during the summary week. Below you see the active region on 4 and 31 January in the EUV (left) and in visible light (right).

So far, NOAA 1967 was the source of 34 C- and 20 M-class flares, including an M3-spike lasting only 4 minutes (28 January, maximum at 15:26UT). The strongest flare occurred on 30 January (M6.6 peaking at 16:11UT) and was associated with a filament eruption east of NOAA 1967's trailing portion. At that moment, the 1967 was situated near the east limb with the filament not in sight. A full halo CME was related to this event and first seen in LASCO/C2 imagery at 16:12UT.
Three other M-flares were produced, all by NOAA 1968. This group was a lot smaller than NOAA 1967 and located in the northern hemisphere at about the same longitude. It matured more slowly, with the strongest flare peaking on 2 February (M2 at 06:34UT).
| DAY | BEGIN | MAX | END | LOC | XRAY | OP | 10CM | TYPE | Cat | NOAA |
| 27 | 0105 | 0122 | 0139 | M1.0 | III/2 | 1967 | ||||
| 27 | 0202 | 0211 | 0218 | M1.1 | 1967 | |||||
| 27 | 2205 | 2210 | 2215 | M4.9 | 1967 | |||||
| 28 | 0402 | 0409 | 0413 | M1.5 | 1967 | |||||
| 28 | 0725 | 0731 | 0734 | M3.6 | III/2 | 1967 | ||||
| 28 | 1134 | 1138 | 1141 | M1.4 | III/2 | 1967 | ||||
| 28 | 1238 | 1246 | 1250 | M1.3 | ||||||
| 28 | 1233 | 1246 | 1250 | M1.3 | 1967 | |||||
| 28 | 1900 | 1940 | 1946 | S14E76 | M4.9 | 1F | 1700 | III/1 | 1967 | |
| 28 | 2204 | 2216 | 2220 | S14E75 | M2.6 | 1F | 1967 | |||
| 30 | 0633 | 0639 | 0644 | S15E54 | M2.1 | SF | 28 | 1967 | ||
| 30 | 0754 | 0811 | 0841 | S12E52 | M1.1 | SF | 69 | III/2 | 28 | 1967 |
| 30 | 1548 | 1611 | 1628 | S13E58 | M6.6 | 2N | 220 | VI/1 | 28 | 1967 |
| 31 | 1532 | 1542 | 1553 | M1.1 | 27 | 1968 | ||||
| 01 | 0119 | 0125 | 0138 | S11E26 | M1.0 | 1F | 28 | 1967 | ||
| 01 | 0714 | 0723 | 0736 | S11E23 | M3.0 | 1B | VI/2 | 28 | 1967 | |
| 02 | 0624 | 0634 | 0637 | N12E18 | M2.6 | 1B | III/1 | 27 | 1968 | |
| 02 | 0717 | 0820 | 0829 | S10E14 | M2.2 | 1N | 28 | 1967 | ||
| 02 | 0924 | 0931 | 0936 | S11E13 | M4.4 | 1B | III/2 | 28 | 1967 | |
| 02 | 1401 | 1406 | 1409 | M1.3 | 71 | III/1 | 28 | 1967 | ||
| 02 | 1624 | 1629 | 1636 | M1.0 | 27 | 1968 | ||||
| 02 | 1805 | 1811 | 1818 | M3.1 | 180 | 28 | 1967 | |||
| 02 | 2124 | 2204 | 2214 | M1.3 | III/3 | 28 | 1967 |
| LOC: approximate heliographic location | TYPE: radio burst type |
| XRAY: X-ray flare class | Cat: Catania sunspot group number |
| OP: optical flare class | NOAA: NOAA active region number |
| 10CM: peak 10 cm radio flux |
Solar wind speed varied mostly between 300 and 350 km/s. On 28 January around 20:30UT, solar wind speed changed from about 330km/s to 450-500 km/s. The high temperature, low density stream had a Bz varying between -7 and +7 nT. The source of this high speed stream was most probably a small coronal hole that passed the central meridian on 25 January.
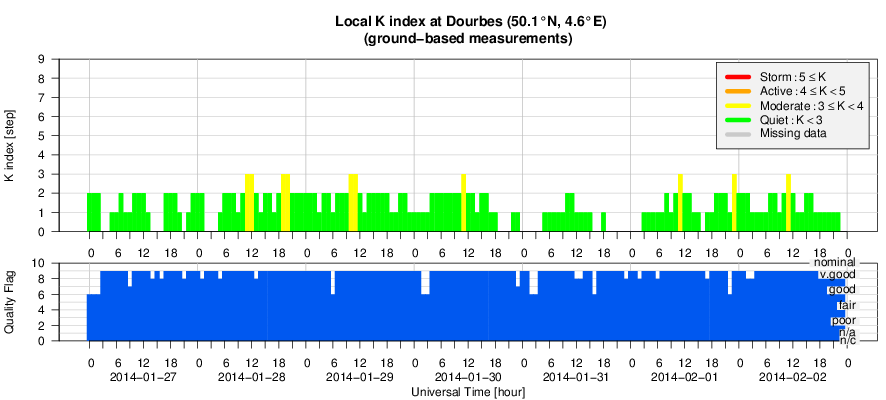
The entire week, geomagnetic conditions remained quiet.
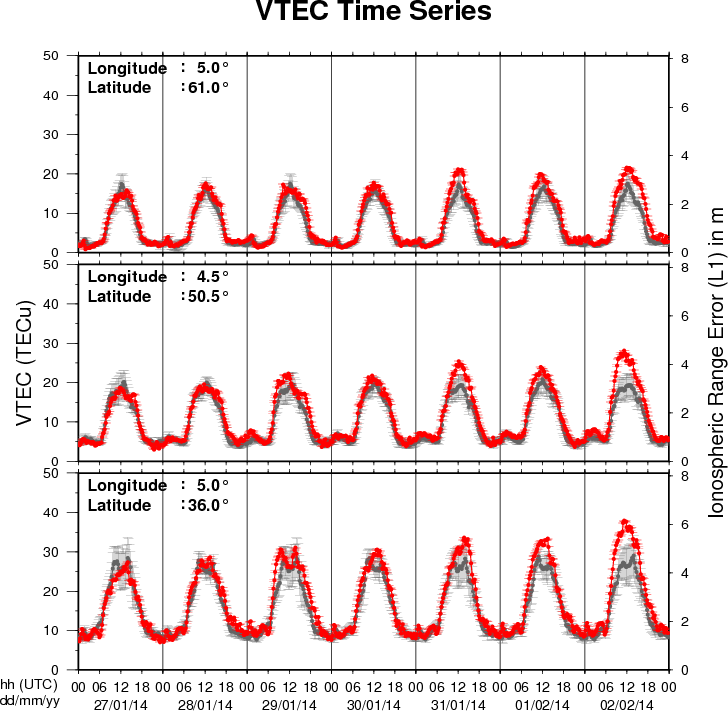
The figure shows the time evolution of the Vertical Total Electron Content (VTEC) (in red) during the last week at three locations:
a) in the northern part of Europe(N61°, 5°E)
b) above Brussels(N50.5°, 4.5°E)
c) in the southern part of Europe(N36°, 5°E)
This figure also shows (in grey) the normal ionospheric behaviour expected based on the median VTEC from the 15 previous days.
The VTEC is expressed in TECu (with TECu=10^16 electrons per square meter) and is directly related to the signal propagation delay due to the ionosphere (in figure: delay on GPS L1 frequency).
The Sun's radiation ionizes the Earth's upper atmosphere, the ionosphere, located from about 60km to 1000km above the Earth's surface.The ionization process in the ionosphere produces ions and free electrons. These electrons perturb the propagation of the GNSS (Global Navigation Satellite System) signals by inducing a so-called ionospheric delay.
See http://stce.be/newsletter/GNSS_final.pdf for some more explanations ; for detailed information, see http://gnss.be/ionosphere_tutorial.php