
The Solar-Terrestrial Centre of Excellence (STCE) is a collaborative network of the Belgian Institute for Space Aeronomy, the Royal Observatory of Belgium and the Royal Meteorological Institute of Belgium.
|
Published by the STCE - this issue : 13 Feb 2014. The Solar-Terrestrial Centre of Excellence (STCE) is a collaborative network of the Belgian Institute for Space Aeronomy, the Royal Observatory of Belgium and the Royal Meteorological Institute of Belgium. |
| Archive of the newsletters | Subscribe to this newsletter by mail |
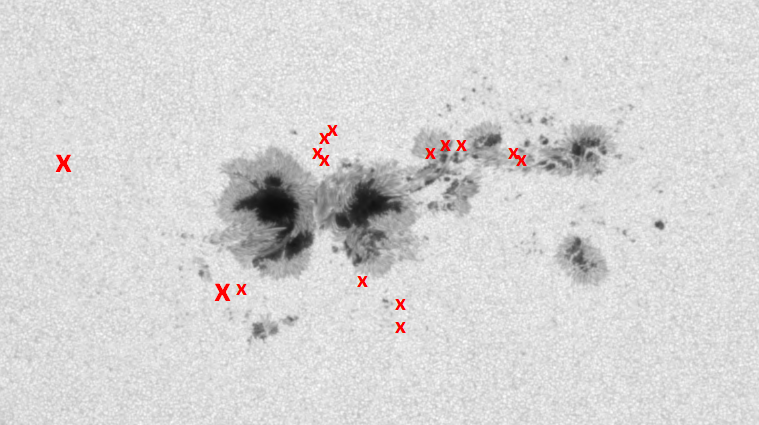
NOAA 1967 has rotated behind the west limb. It was a little bit of a disappointment that the largest sunspot group so far this solar cycle (according to NOAA statistics), only produced numerous M-flares. The approximate positions of 15 of these M-flares, produced between 30 January and 7 February, are indicated on a 2 February SDO-image of NOAA 1967.
So, what does it take to get an "eXtreme" flare? First of all, you need a compact sunspot group with a big, asymmetric main spot. Indeed, flare and sunspot statistics show that about two thirds of all X-class flares are produced by such groups. Also, about half of the X-flares are produced by groups that have several smaller but still mature sunspots between the main spots. So far so good, because NOAA 1967 had both!
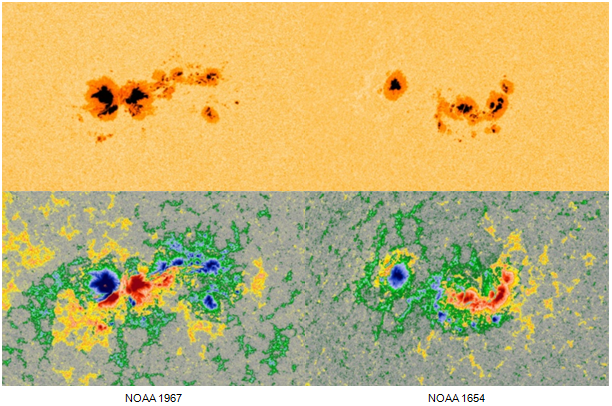
A second ingredient is that the active region should contain sunspots of opposite magnetic polarity close together, usually within the same penumbra. These are the so-called "delta's". Often, the bigger the spots, the stronger the flare (if any is produced...). Again, NOAA 1967 contained delta structures for most of its transit over the solar disk. There were 2 big spots of opposite polarity in the region's trailing section, and both had -within their penumbra- smaller spots of opposite polarity, the whole resembling an "X"-structure. An example of a big sunspot group with no delta's is NOAA 1654 from about a year ago (image above). Indeed, the big asymmetric main spot consisted entirely of spots of the same magnetic polarity: No X-flares, and only two M-flares!
So, which key-element was NOAA 1967 lacking to produce X-class flares à volonté? This question brings us to the frontline of scientific research, and it's already an indication there's currently no final answer to it...
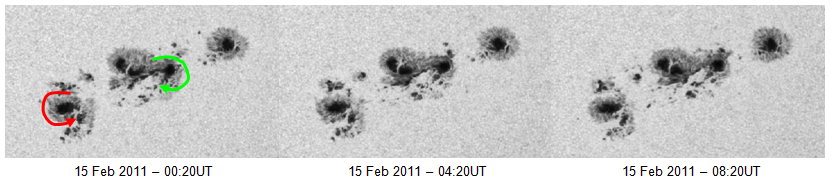
One of the (many) reasons could be that the main spots of NOAA 1967 were rather "rigid", contrary to some other X-class producing groups which showed rotation in their main spots. An example is e.g. NOAA 1158 which produced the first X-class flare of solar cycle 24 on 15 February 2011. The clockwise and counter-clockwise movements are indicated on the image below and can be seen in this movie at http://youtu.be/ocE50W6qerc It is suspected that this helicity transfers additional energy into the system that may just be enough to produce major flares. With NOAA 1967, aside some shape changing, very little rotational movement can be seen in the main spots.
But maybe it was all related to how the sunspots were build up in the solar interior. With techniques that monitor the up-and-down movements of the solar surface, one can probe the structure of sunspots underneath the solar surface ("helioseismology"). As results will become published in the next few months, it may reveal a new clue on the atypical flaring behavior of NOAA 1967.
In the end, NOAA 1967 produced 26 M-class flares, making this region after NOAA 1515 (30) the one with the most medium class flares so far this solar cycle. That tasted really well, but the soup could have used some more spice!...
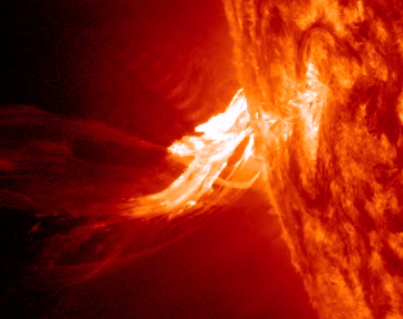
Peaking at 16:17UT on 9 February, an M1-flare took place in a region just behind the southeastern solar limb. It was associated to an impressive prominence eruption and evolved into a non-Earth directed coronal mass ejection (CME) with a plane-of-sky speed of about 750 km/s.
This movie at http://youtu.be/VqtvQ4kGNoI shows the event at low temperatures (AIA304, near 80.000 degrees), at very hot temperatures (AIA131, several million degrees), and a combination of AIA filters (red is cool, blue is hot temperatures). The last clip shows the eruption and the subsequent CME.
Image credits: SDO (http://sdo.gsfc.nasa.gov/), SOHO (http://sohowww.nascom.nasa.gov/), and PROBA2 (http://proba2.oma.be/ssa).
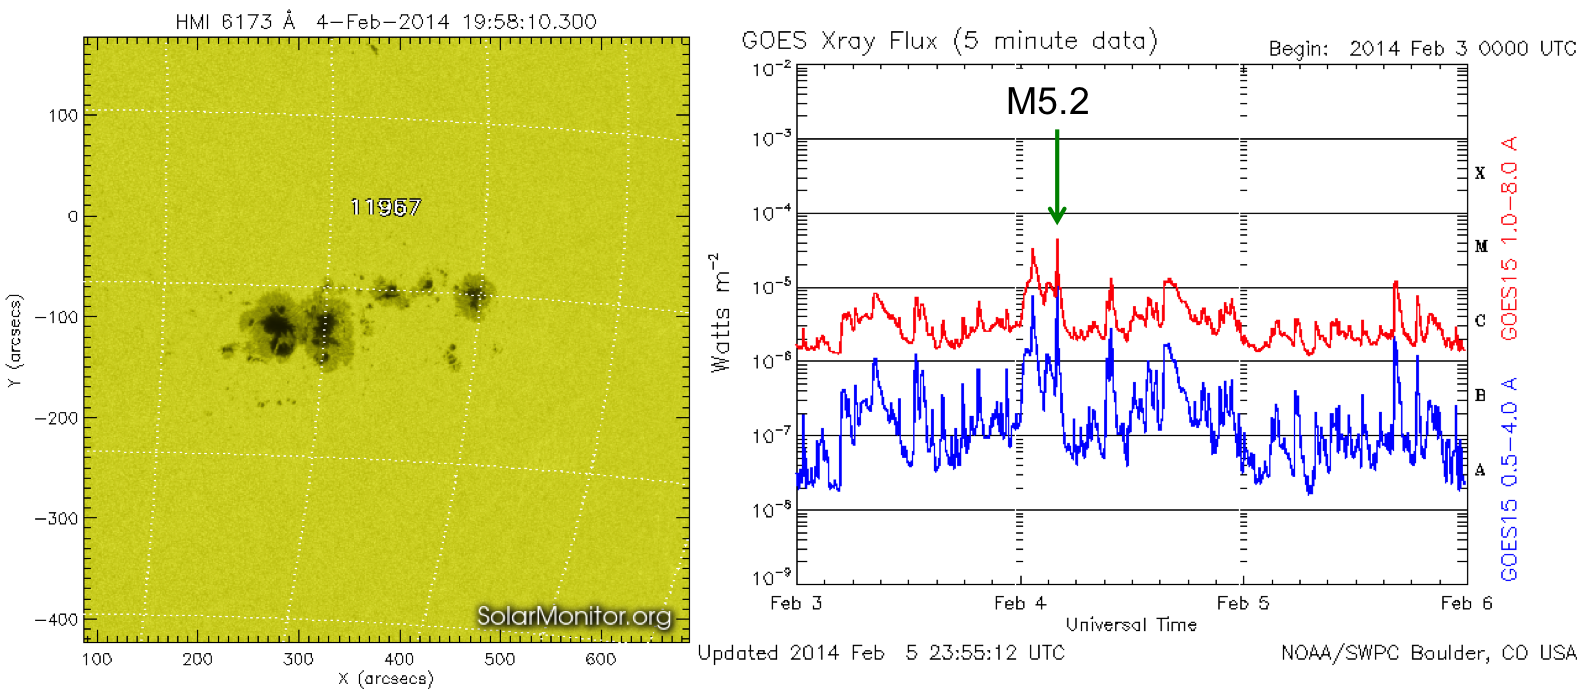
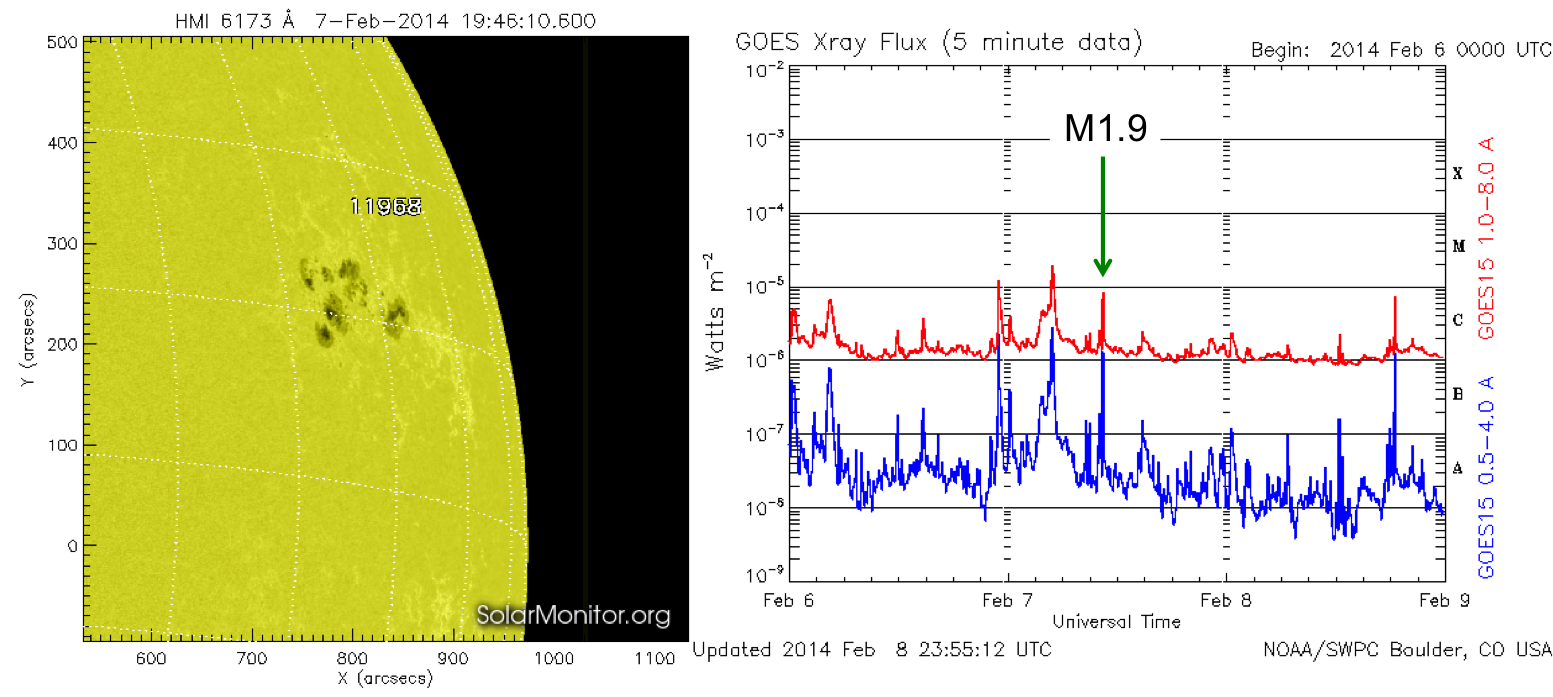
Twelve sunspot groups were reported on the Sun during the week: Catania numbers 27, 28, 29, 31, 33, 34, 35, 36 (respectively NOAA ARs 1968, 1967, 1969, 1970, 1971, 1972, 1973, 1974); Catania sunspot groups 30 and 32 had no NOAA number, and NOAA ARs 1975 and 1976 had no Catania number. Solar flaring activity was dominated by the Catania sunspot groups 27 and 28 (NOAA ARs 1968 and 1967 respectively). The two regions produced numerous C-class and eight M-class flares. The strongest flare of the week was the M5.2 flare peaking at 04:00 UT on February 4 in the Catania sunspot group 28 (NOAA AR 1967). The strongest flare produced by the Catania sunspot
group 27 (NOAA AR 1968) was the M1.9 flare peaking at 10:29 UT on February 7. In the end of the week the flaring activity decreased, and these two regions did not produce an M-class flare since noon of February 7.
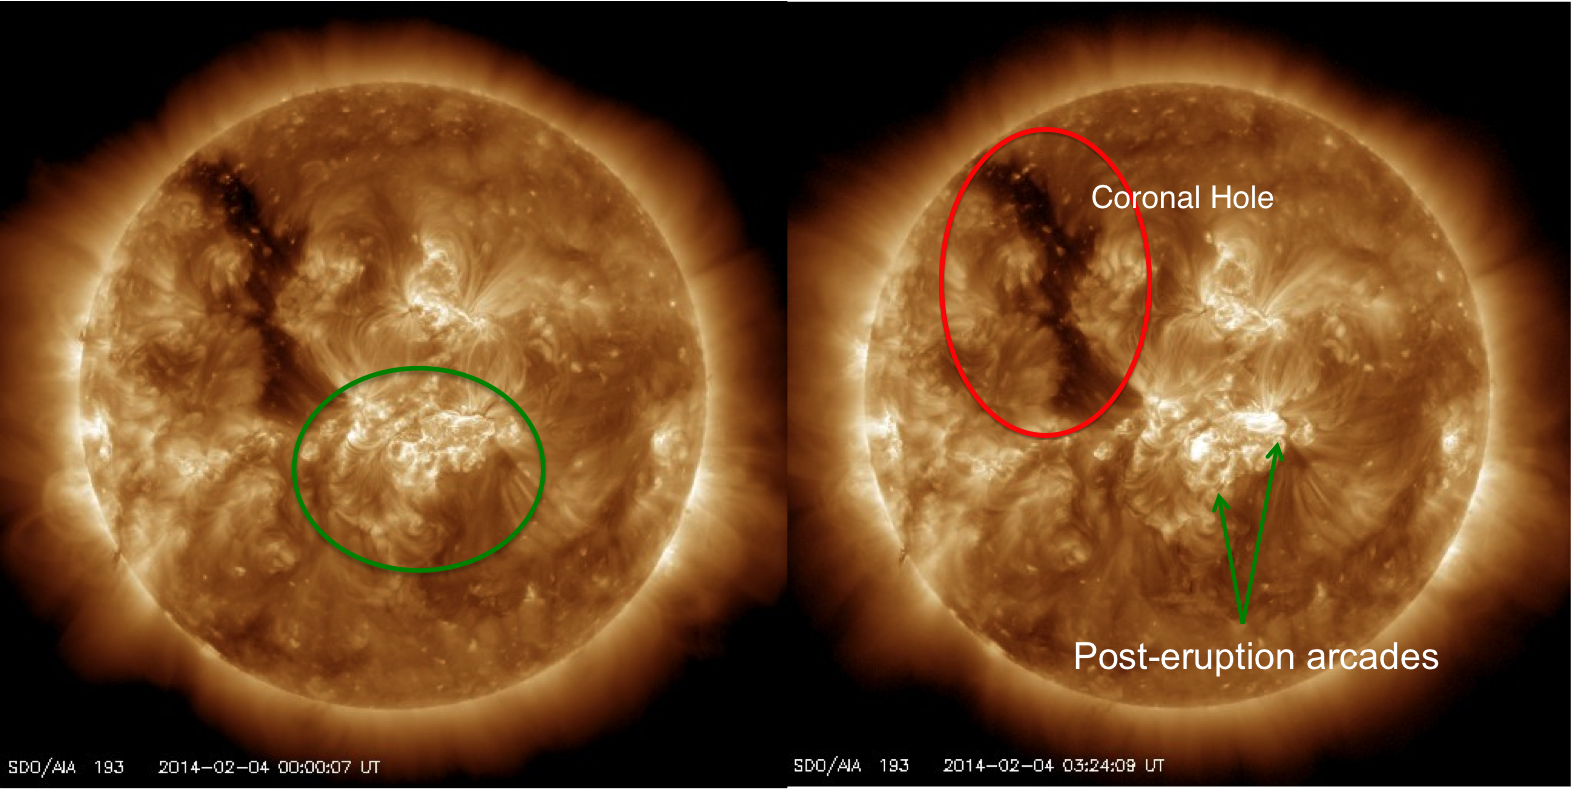
A weak partial halo CME first appeared in the SOHO/LASCO C2 field of view on February 4 at 01:25 UT (after a data gap). It had the angular width of around 170 degrees and the plane-of-the-sky projected speed of around 700 km/s. The CME was associated with an eruption in the western part of the Catania sunspot group 28 (NOAA AR 1967) accompanied with a weak and small coronal dimming, a post-eruption arcade, and the M3.8 flare peaking at 01:23 UT (this flare is erroneously attributed to the NOAA AR 1968 in the NOAA event list). The interplanetary disturbance associated with this CME arrived at the Earth on February 7 (see Review of Geomagnetic Activity).
A weak partial halo CME first appeared in the SOHO/LASCO C2 field of view at 16:36 UT on February 4. It had the angular width of around 240 degrees and the plane-of-the-sky projected speed around 500 km/s. It was associated with the M1.5 flare peaking at 16:02 UT in the Catania sunspot group 28 (NOAA AR 1967), a post-eruption arcade, and weak coronal dimmings. The associated interplanetary disturbance did not arrive at the Earth.
Another partial halo CME (first appearing in the LASCO C2 field of view at 19:48 UT on February 4, angular width around 130 degrees) was a far side event, with the source region situated around S20W170 as seen from the Earth.
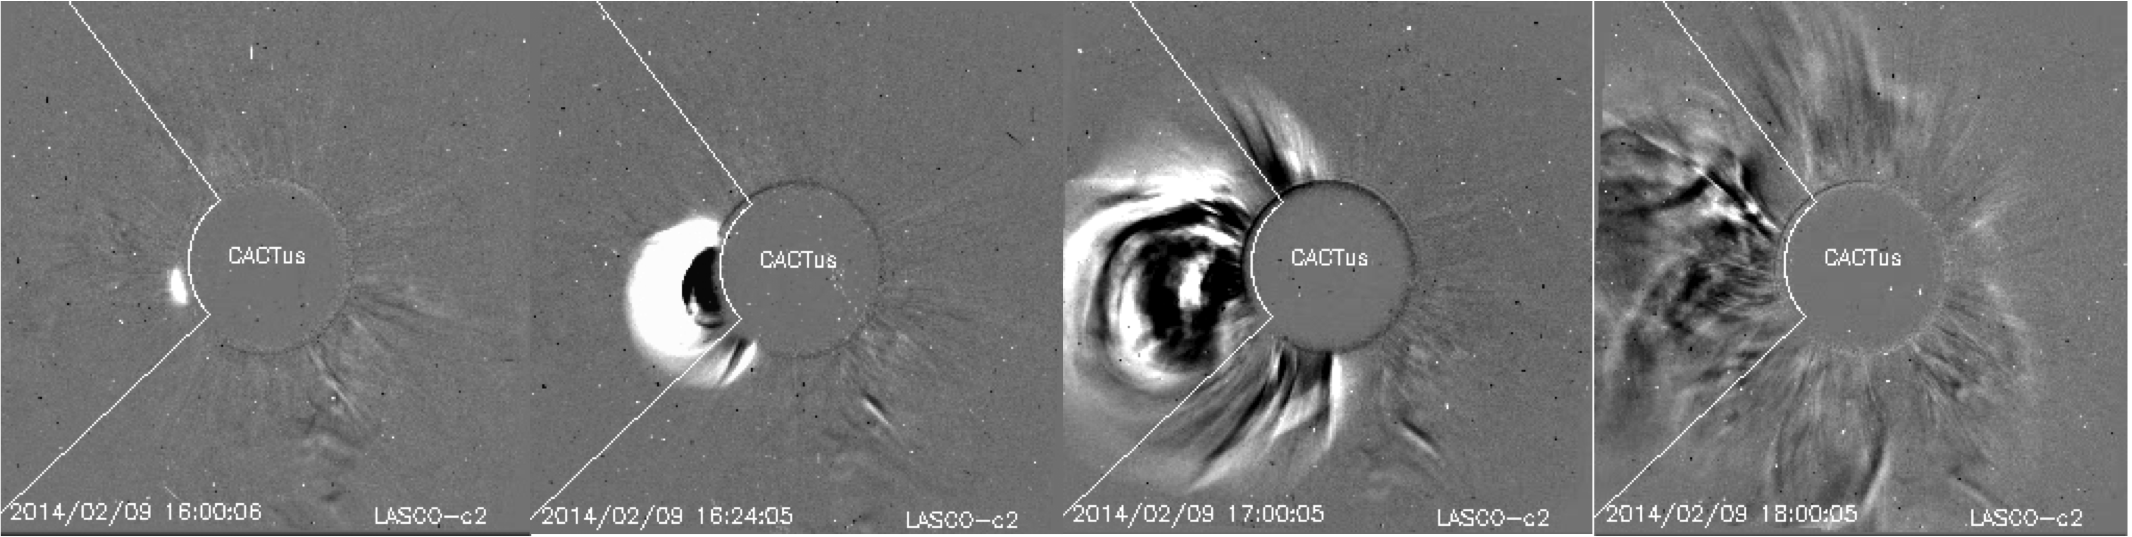
A full halo CME was detected by SOHO/LASCO on February 9, first appearing in the LASCO C2 field of view at 16:00 UT. It was accompanied by the M1.0 flare (the ninth M-class flare of the week) peaking at 16:17 UT in the active region right behind the east-south-east solar limb (currently NOAA AR 1977). SDO/AIA data show coronal dimmings, an EIT wave, an erupting prominence, and a post-eruption arcade in association with this event. Due to the CME source region position on the far side of the Sun, the corresponding ICME did not arrive at the Earth.
A narrow coronal hole extended in latitude from the equator to approximately N60 reached the solar central meridian late on February 4 (indicated by a red circle in 1 of the above pictures). A signature of a corresponding co-rotating interaction region was not observed in ACE data since it was over shaded by to the ICME arrival on February 7 (see Review of Geomagnetic Activity).
| DAY | BEGIN | MAX | END | LOC | XRAY | OP | 10CM | TYPE | Cat | NOAA |
| 04 | 0116 | 0123 | 0131 | N9W13 | M3.8 | SF | 27 | 1968 | ||
| 04 | 0357 | 0400 | 0406 | S14W6 | M5.2 | 1B | 28 | 1967 | ||
| 04 | 0938 | 0949 | 0958 | M1.4 | III/1 | 28 | 1967 | |||
| 04 | 1525 | 1602 | 1649 | S12W12 | M1.5 | 1N | 28 | 1967 | ||
| 05 | 1611 | 1620 | 1642 | M1.3 | 28 | 1967 | ||||
| 06 | 2256 | 2305 | 2310 | M1.5 | 180 | 28 | 1967 | |||
| 07 | 0447 | 0456 | 0504 | S15W50 | M2.0 | 2N | 28 | 1967 | ||
| 07 | 1025 | 1029 | 1031 | N9W53 | M1.9 | 1N | 27 | 1968 | ||
| 09 | 1540 | 1617 | 1652 | M1.0 | CTM/1 |
| LOC: approximate heliographic location | TYPE: radio burst type |
| XRAY: X-ray flare class | Cat: Catania sunspot group number |
| OP: optical flare class | NOAA: NOAA active region number |
| 10CM: peak 10 cm radio flux |
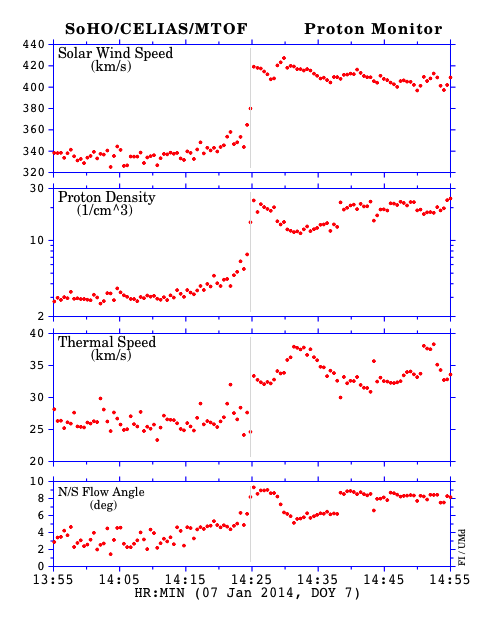
In the beginning of the week the Earth was situated inside a slow solar wind flow, and the geomagnetic conditions were quiet. An interplanetary shock wave was detected on February 7 at 16:18 UT by ACE and at 16:24 UT by SOHO/CELIAS.
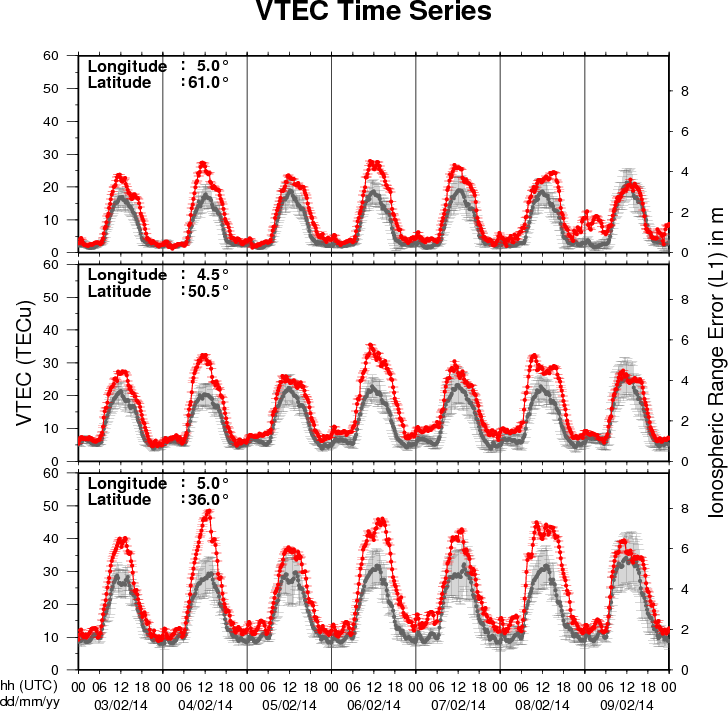
The figure shows the time evolution of the Vertical Total Electron Content (VTEC) (in red) during the last week at three locations:
a) in the northern part of Europe(N61°, 5°E)
b) above Brussels(N50.5°, 4.5°E)
c) in the southern part of Europe(N36°, 5°E)
This figure also shows (in grey) the normal ionospheric behaviour expected based on the median VTEC from the 15 previous days.
The VTEC is expressed in TECu (with TECu=10^16 electrons per square meter) and is directly related to the signal propagation delay due to the ionosphere (in figure: delay on GPS L1 frequency).
The Sun's radiation ionizes the Earth's upper atmosphere, the ionosphere, located from about 60km to 1000km above the Earth's surface.The ionization process in the ionosphere produces ions and free electrons. These electrons perturb the propagation of the GNSS (Global Navigation Satellite System) signals by inducing a so-called ionospheric delay.
See http://stce.be/newsletter/GNSS_final.pdf for some more explanations ; for detailed information, see http://gnss.be/ionosphere_tutorial.php