
The Solar-Terrestrial Centre of Excellence (STCE) is a collaborative network of the Belgian Institute for Space Aeronomy, the Royal Observatory of Belgium and the Royal Meteorological Institute of Belgium.
|
Published by the STCE - this issue : 21 Feb 2014. The Solar-Terrestrial Centre of Excellence (STCE) is a collaborative network of the Belgian Institute for Space Aeronomy, the Royal Observatory of Belgium and the Royal Meteorological Institute of Belgium. |
| Archive of the newsletters | Subscribe to this newsletter by mail |
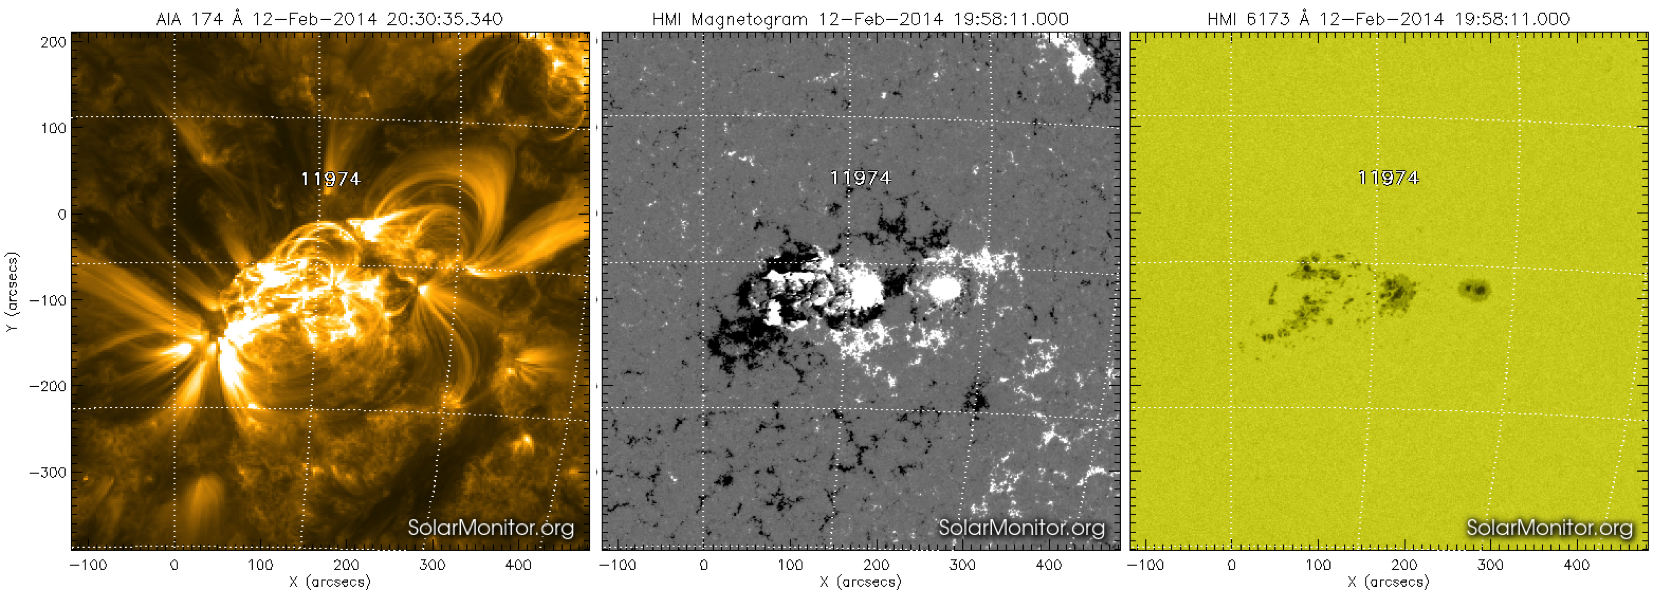
What seemed to be a boring and declining sunspot group suddenly turned out to be the most flare productive group of the week.
On 9 February, NOAA 1974 was a relatively small group with almost no spots in its trailing end. Then, in the course of the day, new magnetic flux emerged in this trailing portion gradually increasing its sunspot area to nearly 6 times the surface area of the Earth by 15 February. In view of the close proximity of the sunspot groups (less than 10 degrees in heliographic longitude), this region was still considered as 1 sunspot group.
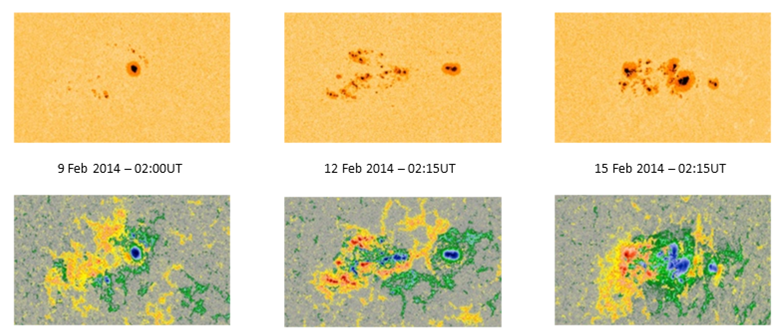
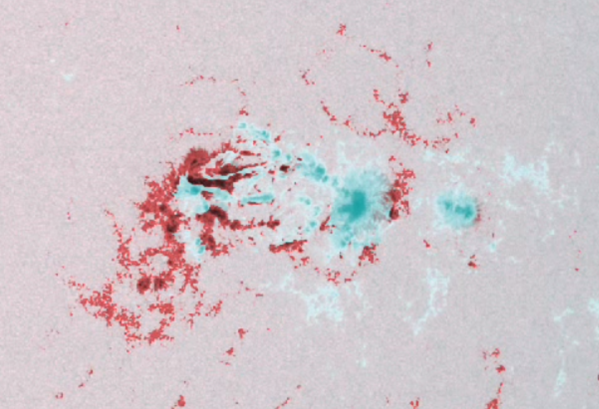
Some of the magnetic strands of the newly emerging flux were of a polarity opposite to that of the trailing section. As this flux migrated to the west (towards the leading portion), it logically resulted in increased flaring activity. However, as the associated, closely-packed sunspots were rather small, only medium flares resulted from their interaction. In only 4 days (11-14 February), this active region barreled 14 M-class flares in quick succession, the strongest being an M3.7 flare on 12 February. Both in the SDO (http://sdo.gsfc.nasa.gov/ ) images above and below, as well as in the movie at http://www.youtube.com/watch?v=3g29IHi6pIE , the red color means negative magnetic fields (returning to the solar surface), whereas blue indicates positive magnetic field (emerging from the solar surface).
After 14 February, the magnetic delta's (see previous newsletter at http://stce.be/news/236/welcome.html) had been neutralized, and newly emerging flux in the northern portion of the region only added to the sunspot area, without the production of new delta's or additional medium class solar flares. As the region is transiting the Sun's backside now, the STEREO spacecraft have the best view on how this group further develops. Within 2 weeks, we'll see if new magnetic flux has emerged and the group is still flare active, or if it has decreased in size or maybe completely vanished from the solar surface.
Solar flare activity fluctuated between low and moderate during the week.
In order to view the activity of this week in more detail, we suggest to go to the following website from which all the daily (normal and difference) movies can be accessed: http://proba2.oma.be/ssa
This page also lists the recorded flaring events.
A weekly overview movie can be found here (SWAP week 203).
Details about some of this week's events, can be found further below.
http://proba2.oma.be/swap/data/mpg/movies/WeeklyReportMovies/WR203_Feb10_Feb16/weekly_movie_2014_02_10.mp4
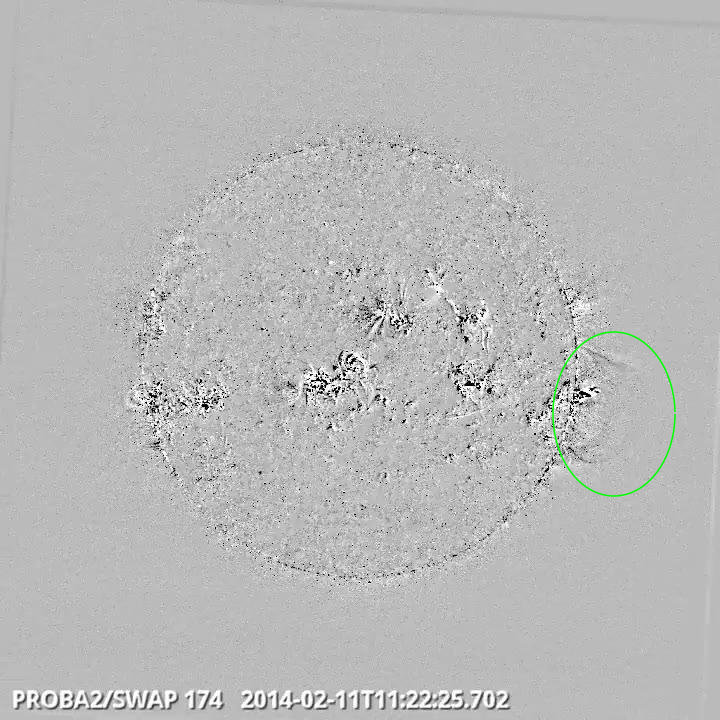
Eruption on the west limb @ 11:22 SWAP difference image
Find a movie of the events here (SWAP difference movie)
http://proba2.oma.be/swap/data/mpg/movies/WeeklyReportMovies/WR203_Feb10_Feb16/Events/20140211_Eruption_WestLimb_1122_swap_diff.mp4
Find a movie of the events here (SWAP movie)
http://proba2.oma.be/swap/data/mpg/movies/WeeklyReportMovies/WR203_Feb10_Feb16/Events/20140211_Eruption_WestLimb_1122_swap_movie.mp4
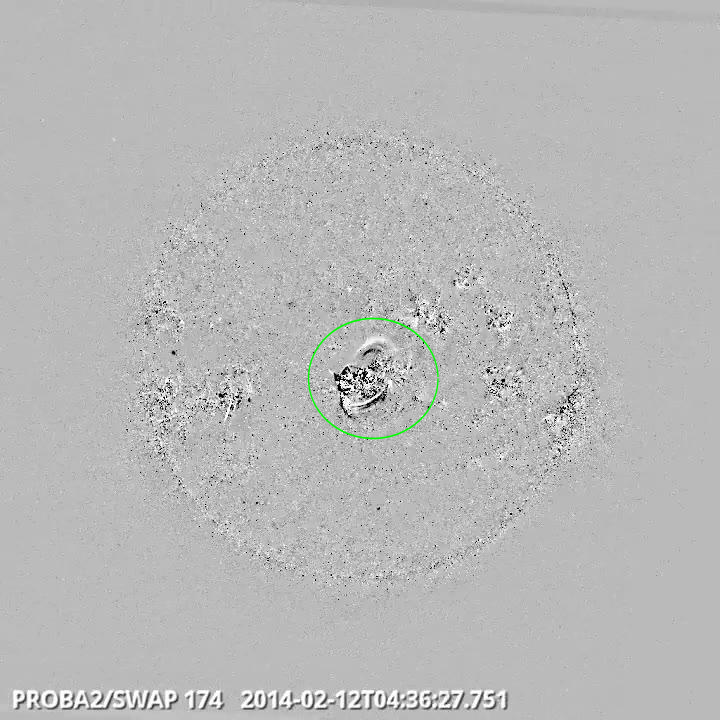
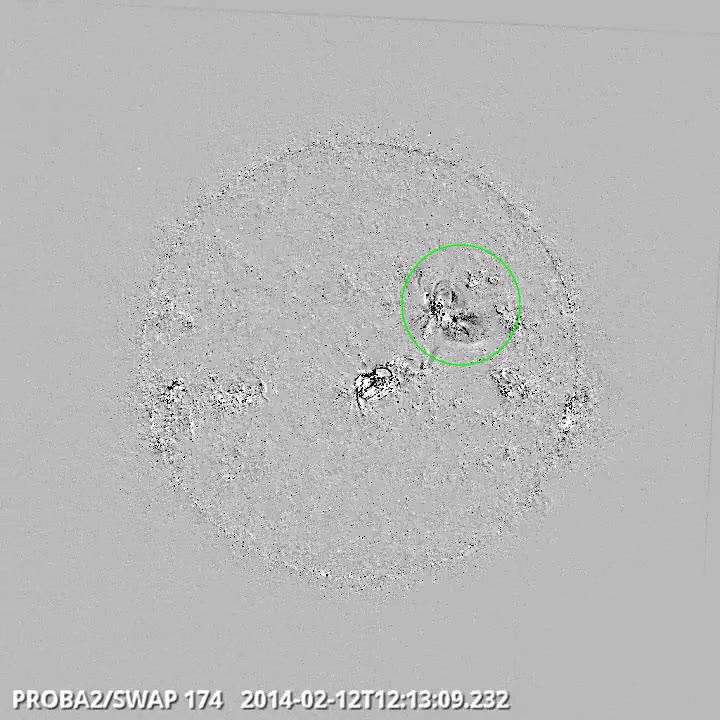
Eruption and dimming in the centre @ 04:36 SWAP difference image
Find a movie of the event here (SWAP difference movie)
http://proba2.oma.be/swap/data/mpg/movies/WeeklyReportMovies/WR203_Feb10_Feb16/Events/20140212_EruptionDimming_NorthWestQuad_1213_swap_diff.mp4
Find a movie of the event here (SWAP movie)
http://proba2.oma.be/swap/data/mpg/movies/WeeklyReportMovies/WR203_Feb10_Feb16/Events/20140212_EruptionDimming_NorthWestQuad_1213_swap_movie.mp4
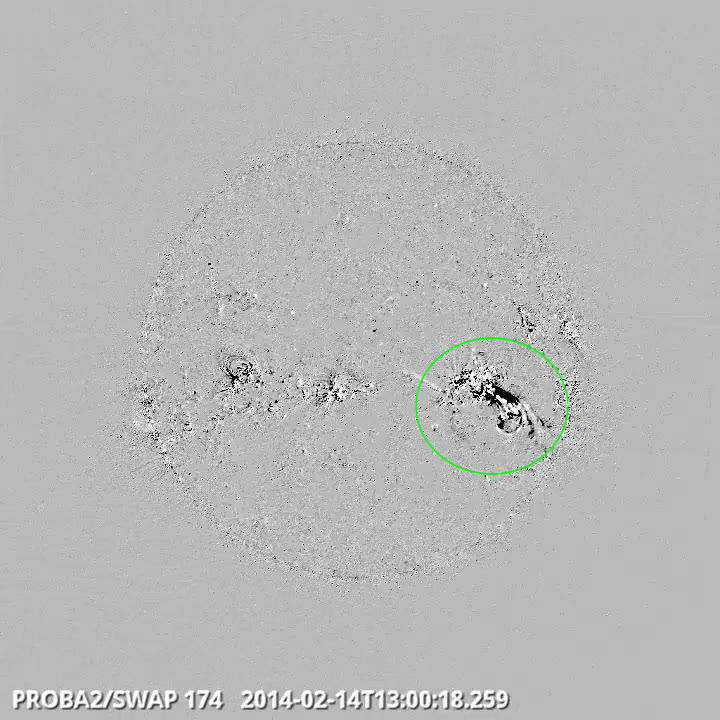
Eruption on the south west quad @ 13:00 SWAP difference image
Find a movie of the event here (SWAP difference movie)
http://proba2.oma.be/swap/data/mpg/movies/WeeklyReportMovies/WR203_Feb10_Feb16/Events/20140214_Eruption_SouthWest_1300_swap_diff.mp4
Loop expansion on the east limb @ 18:02 SWAP difference image
Find a movie of the event here (SWAP difference movie)
http://proba2.oma.be/swap/data/mpg/movies/WeeklyReportMovies/WR203_Feb10_Feb16/Events/20140214_Loopexpanding_EastLimb_1802_swap_diff.mp4
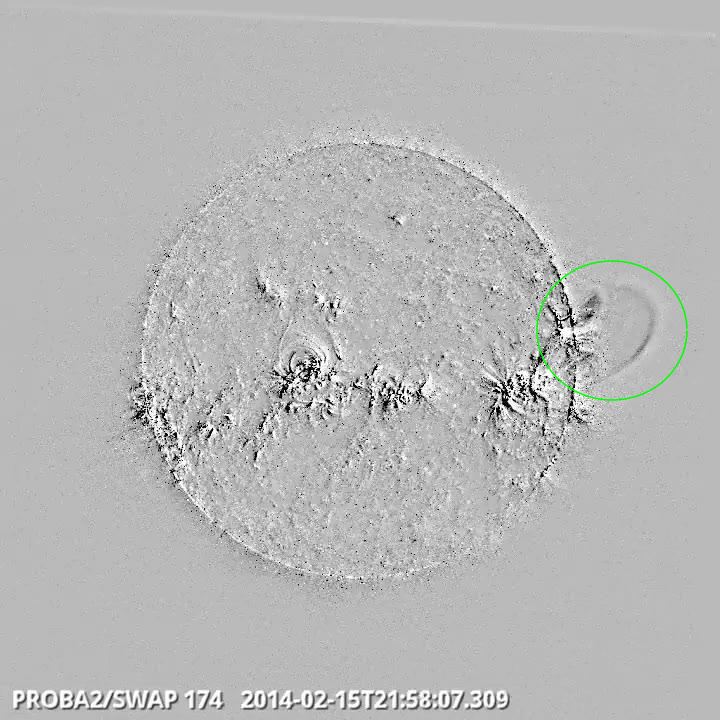
Eruption on the west limb @ 21:58 SWAP difference image
Find a movie of the event here (SWAP difference movie)
http://proba2.oma.be/swap/data/mpg/movies/WeeklyReportMovies/WR203_Feb10_Feb16/Events/20140215_Eruption_WestLimb_2158_swap_diff.mp4
Find a movie of the event here (SWAP movie)
http://proba2.oma.be/swap/data/mpg/movies/WeeklyReportMovies/WR203_Feb10_Feb16/Events/20140215_Eruption_WestLimb_2158_swap_movie.mp4
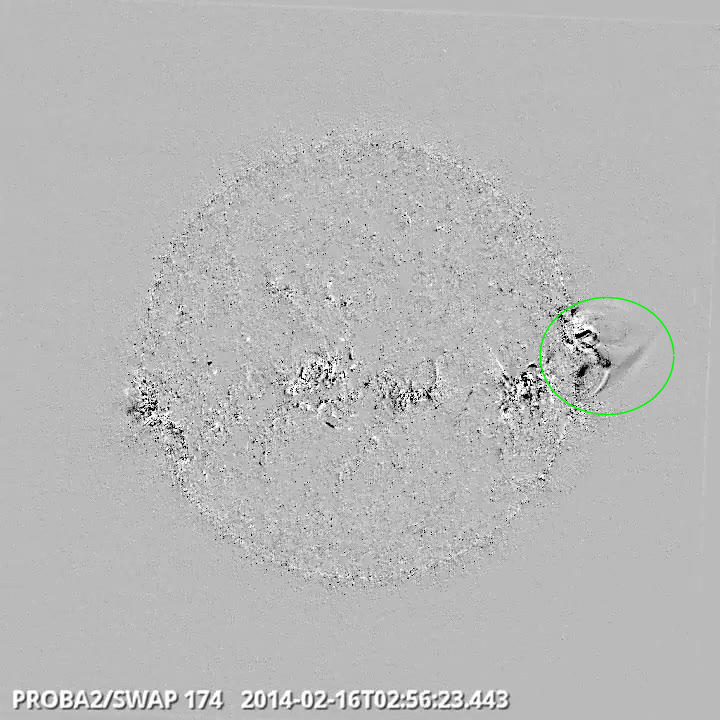
Eruption on the west limb @ 02:56 SWAP difference image
Find a movie of the event here (SWAP difference movie)
http://proba2.oma.be/swap/data/mpg/movies/WeeklyReportMovies/WR203_Feb10_Feb16/Events/20140216_Eruption_WestLmib_0256_swap_diff.mp4
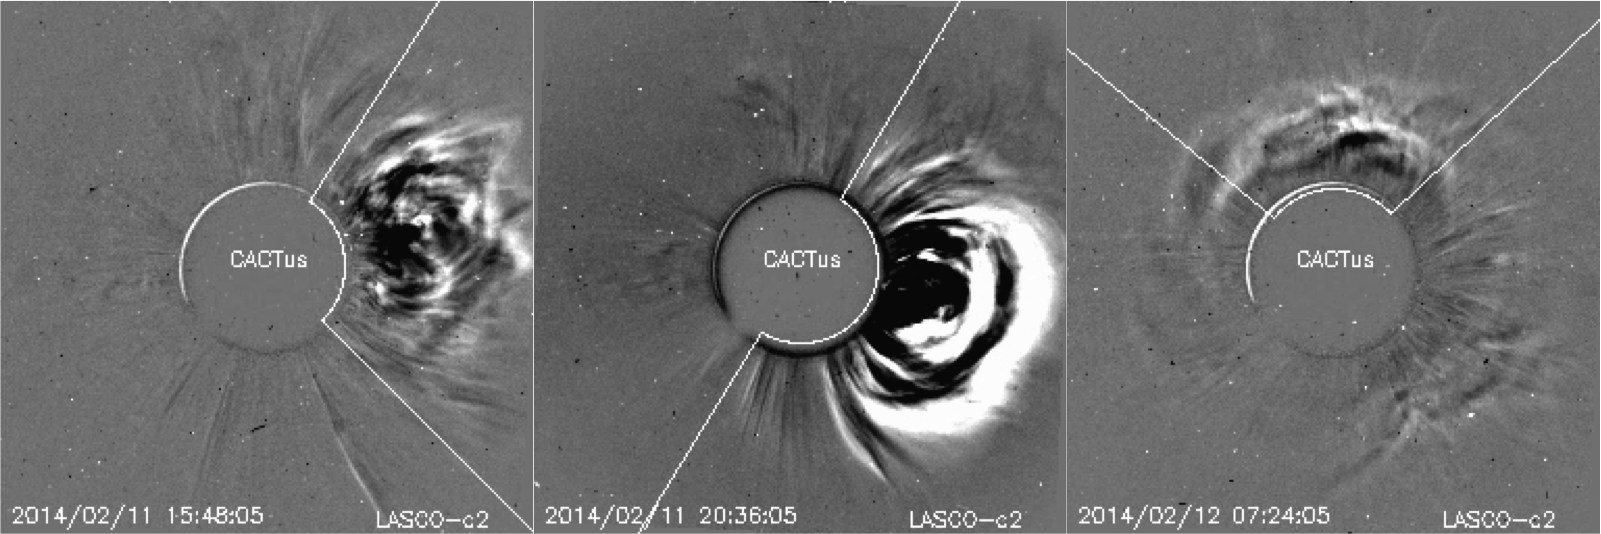
During this week 15 M-class flare and 47 C-class flares were reported by GOES. The solar flaring activity was dominated by the Catania sunspot group 36 (NOAA AR 1974) which had most of the time beta-gamma-delta configuration of its photospheric magnetic field. The strongest flare of the week, also originated from this active region, was the M3.7 flare on February 12 peaked at 04:25 UT. The flare was associated with an EIT wave, coronal dimming and Earth directed full halo CME (having speed of about 600 km/s) first seen in the SOHO LASCO C2 field of view at 05:48 UT.
Near the end of the week the flaring activity strongly decreased, and only one M-class flare was reported since afternoon of February 14.
The Earth directed full halo CME first seen in the SOHO LASCO C2 field of view at 04:12 UT on February 11, had a projected plane of the sky speed of about 300 km/s and it was accompanied by an EIT wave, and coronal dimmings. The associated M1.7 flare (peak at 03:31 UT) originated from the Catania sunspot group 36 (NOAA AR 1974) situated at that moment at the center of the solar disc.
A partial halo CME detected in the SOHO/LASCO C2 field of view at 09:24 UT on February 11 had a projected plane of the sky speed of about 320 km/s, and was associated with an eruption of a filament in the west of the Catania sunspot group 35 (NOAA AR 1973). The eruption was accompanied by coronal dimmings and a post-eruption arcade observed by SDO/AIA. The bulk of the CME mass was directed northward of the Sun-Earth line.
Another full halo CME was seen in SOHO LASCO C2 images. It came into the field of view at 05:48 UT on February 12. The CME was associated with the M3.7 flare (peak at 04:25 UT) and had a projected plane of the sky speed of about 600 km/s. This third, significantly faster CME catched up with the two slower CMEs and arrived on February 15 (see . The arrival of the corresponding multiple ICME at the Earth was February 15 (see review of geomagnetic activity).
The partial halo CME which came into the SOHO LASCO C2 field of view at 13:25UT on February 12, was associated with the C7.9 flare (peak at 12:34 UT) originating from the Catania sunspot group 35 (NOAA AR 1973). The CME had an angular width of about 200 degrees and propagated with the projected plane of the sky speed of about 530 km/s. The bulk of the CME mass was directed northward of the Sun-Earth line.
The M2.1 flare, peak at 15:51 UT of February 12 was associated with a faint partial halo CME first seen in the SOHO LASCO C2 field of view at 16:24 UT. The CME had a projected plane of the sky speed of about 500 km/s. The associated interplanetary disturbance did not arrive at the Earth.
The M1.4 flare, peak at 15:57 UT on February 13 was associated with a coronal dimming, EIT wave and a faint partial halo CME. The CME was first seen in the SOHO LASCO C2 field of view at 16:36 UT, had an angular width of about 250 degrees and a projected plane of the sky speed of about 550 km/s. The CME did not arrive at the Earth.
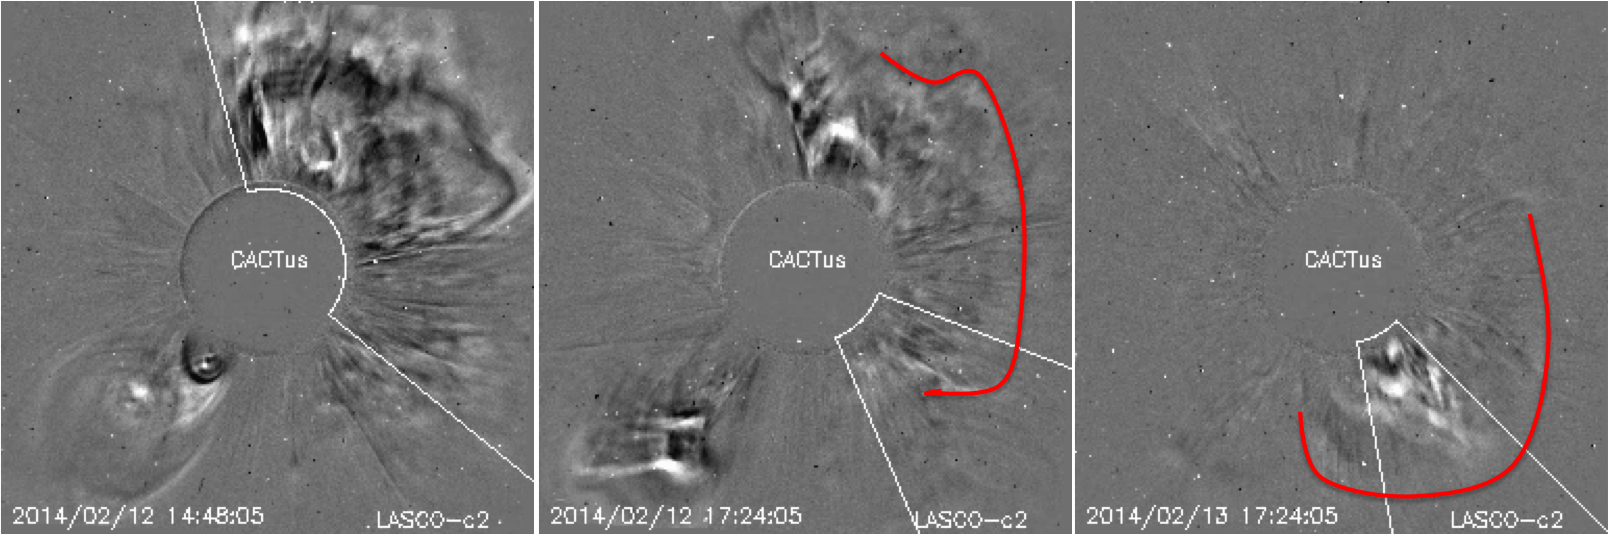
The M2.3 flare, peak at 02:57 UT on February 14 was associated with a large coronal dimming and very faint partial halo CME. The source region was located on a geoeffective position. The CME did arrive (more next week).
Besides the Earth directed CMEs, several back-sided CMEs were detected this week. This is promising for next week!
| DAY | BEGIN | MAX | END | LOC | XRAY | OP | 10CM | TYPE | Cat | NOAA |
| 11 | 0322 | 0331 | 0339 | S12E17 | M1.7 | 1N | 140 | VI/1III/3II/2IV/1 | 36 | 1974 |
| 11 | 1634 | 1651 | 1710 | M1.8 | 36 | 1974 | ||||
| 12 | 0352 | 0425 | 0438 | S12W2 | M3.7 | 2N | 36 | 1974 | ||
| 12 | 0654 | 0658 | 0704 | M2.3 | 36 | 1974 | ||||
| 12 | 1541 | 1551 | 1615 | M2.1 | 40 | III/2 | 36 | 1974 | ||
| 13 | 0132 | 0140 | 0150 | S12W9 | M1.8 | 2F | III/1 | 36 | 1974 | |
| 13 | 0241 | 0251 | 0304 | M1.0 | 36 | 1974 | ||||
| 13 | 0549 | 0607 | 0613 | M1.7 | 36 | 1974 | ||||
| 13 | 0805 | 0812 | 0819 | S12W13 | M1.0 | 1N | VI/1 | 36 | 1974 | |
| 13 | 1545 | 1557 | 1606 | S13W24 | M1.4 | SF | III/1 | 36 | 1974 | |
| 14 | 0240 | 0257 | 0310 | S12W25 | M2.3 | 2F | VI/1III/2 | 36 | 1974 | |
| 14 | 1229 | 1240 | 1245 | S15W36 | M1.6 | 1N | 59 | 36 | 1974 | |
| 14 | 1321 | 1328 | 1339 | M1.1 | 36 | 1974 | ||||
| 14 | 1633 | 1639 | 1642 | S13W32 | M1.0 | SB | 200 | III/2 | 36 | 1974 |
| 16 | 0920 | 0926 | 0929 | S11E1 | M1.1 | SN | 92 | III/3IV/1 | 44 | 1977 |
| LOC: approximate heliographic location | TYPE: radio burst type |
| XRAY: X-ray flare class | Cat: Catania sunspot group number |
| OP: optical flare class | NOAA: NOAA active region number |
| 10CM: peak 10 cm radio flux |
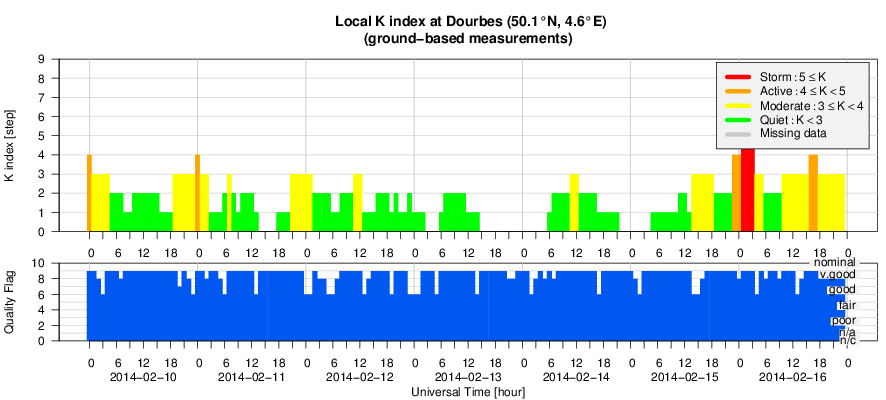
During most of the time this week the solar wind speed stayed within in the range of 350 – 450 km/s, the interplanetary magnetic field magnitude was about 5 - 6 nT. Consequently, the geomagnetic conditions were quiet.
The ACE data indicated however an arrival of a shock wave at 12:35 UT on February 15. The magnetic field magnitude showed a simultaneous jump in the solar wind speed, density and temperature. The shock is indicated by the pink dotted line in the ACE graph below. The graph gives already a preview of next week!
The shock wave was probably driven by the multiple ICME originating from CMEs observed on February 11 and February 12. The shock wave was followed by the driving ICME. The Bz component of the interplanetary magnetic field was most of the time positive. Bz was negative for several time intervals, for example around midnight, Februari 15 - 16 which resulted in a geomagnetic disturbance (Kp=5, as reported by NOAA and K=5 as recorded by Izmiran).
A fast flow, associated with the low-latitude coronal hole located in the northern hemisphere (between N20 and N40) which reached the central meridian on February 13 was probably deflected and did not arrive at the Earth.
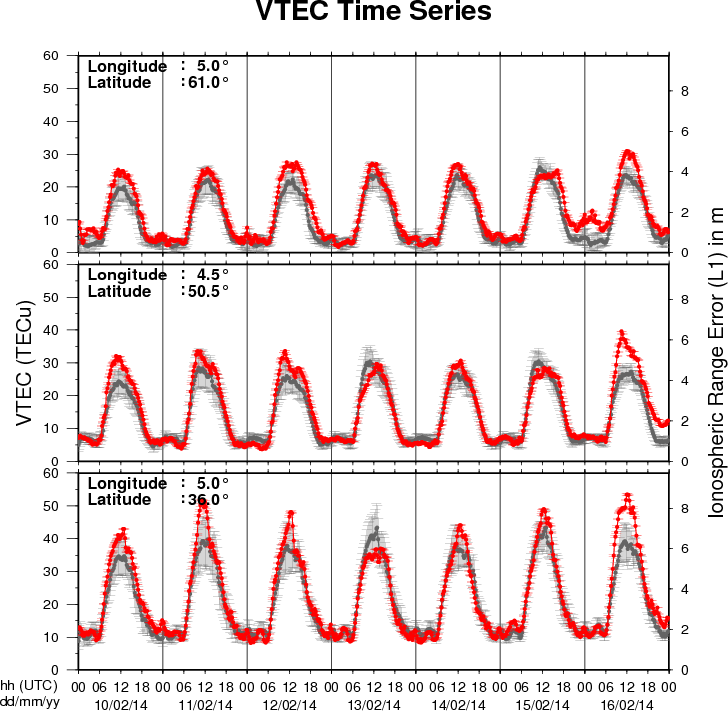
The figure shows the time evolution of the Vertical Total Electron Content (VTEC) (in red) during the last week at three locations:
a) in the northern part of Europe(N61°, 5°E)
b) above Brussels(N50.5°, 4.5°E)
c) in the southern part of Europe(N36°, 5°E)
This figure also shows (in grey) the normal ionospheric behaviour expected based on the median VTEC from the 15 previous days.
The VTEC is expressed in TECu (with TECu=10^16 electrons per square meter) and is directly related to the signal propagation delay due to the ionosphere (in figure: delay on GPS L1 frequency).
The Sun's radiation ionizes the Earth's upper atmosphere, the ionosphere, located from about 60km to 1000km above the Earth's surface.The ionization process in the ionosphere produces ions and free electrons. These electrons perturb the propagation of the GNSS (Global Navigation Satellite System) signals by inducing a so-called ionospheric delay.
See http://stce.be/newsletter/GNSS_final.pdf for some more explanations ; for detailed information, see http://gnss.be/ionosphere_tutorial.php