
The Solar-Terrestrial Centre of Excellence (STCE) is a collaborative network of the Belgian Institute for Space Aeronomy, the Royal Observatory of Belgium and the Royal Meteorological Institute of Belgium.
|
Published by the STCE - this issue : 27 Feb 2014. The Solar-Terrestrial Centre of Excellence (STCE) is a collaborative network of the Belgian Institute for Space Aeronomy, the Royal Observatory of Belgium and the Royal Meteorological Institute of Belgium. |
| Archive of the newsletters | Subscribe to this newsletter by mail |
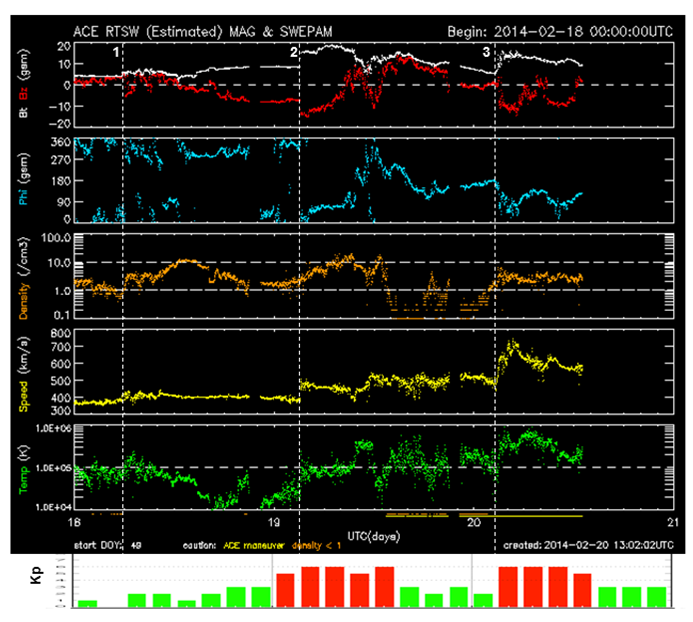
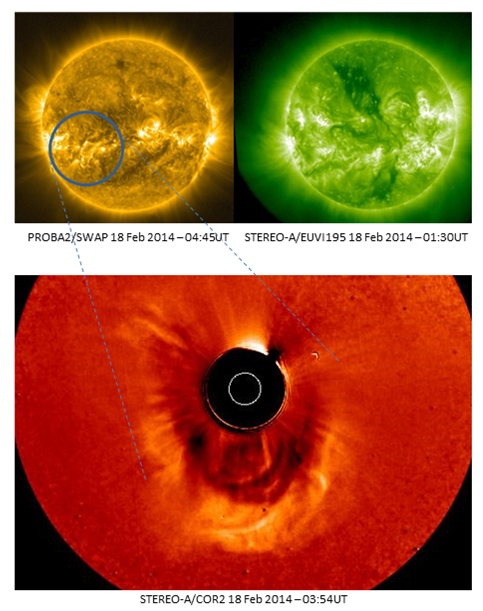
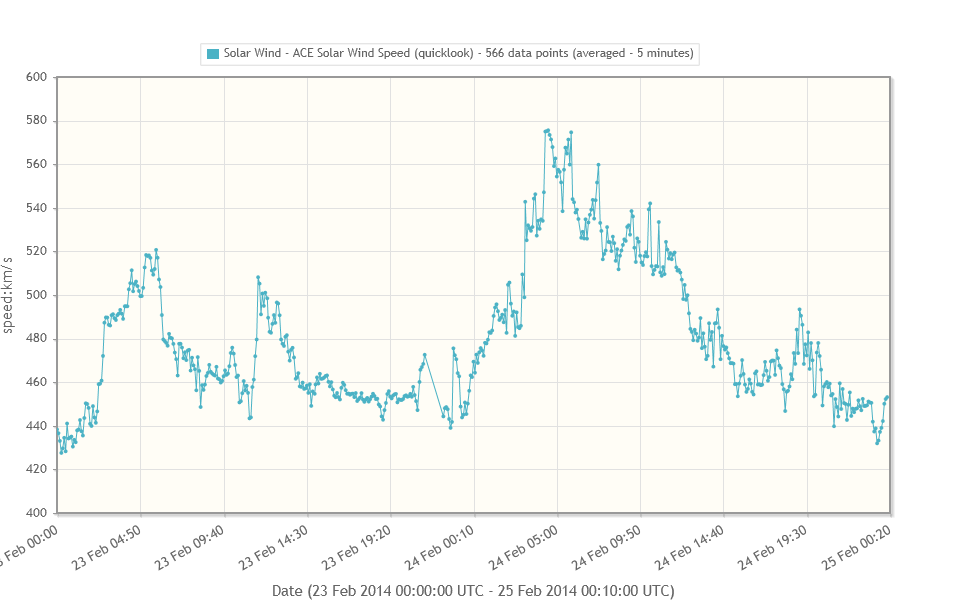
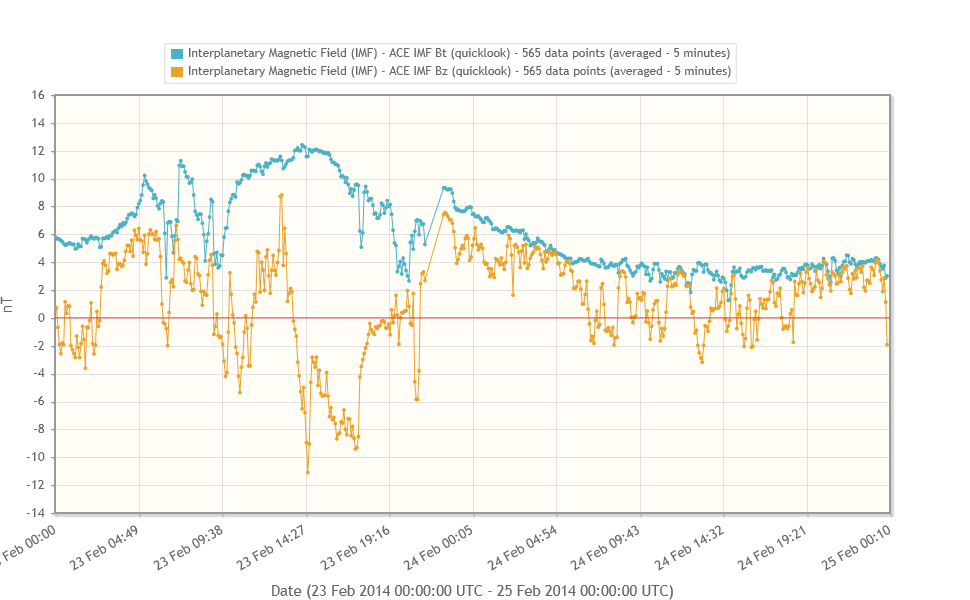
It all happened last week when disturbances in the solar wind caused minor to major geomagnetic storming on 19 and 20 February, as can be seen in this movie at http://www.youtube.com/watch?v=9-l2i3LjcGA The last storming period (see ACE and NOAA data above; event 3) could easily be identified in the solar wind parameters (shock early on 20 February), and its source region traced back to a filament eruption early on 18 February. Images underneath show a PROBA2/SWAP image of the post-eruption coronal loops (top left), and a STEREO-A/EUVI image at about the same time showing no flaring activity on the Sun's backside (top right). The big image at the bottom is an image from the STEREO-A/COR2 coronagraph showing that this event was a halo coronal mass ejection (CME) as seen from STEREO-A. For STEREO-A it's a backside event, as the location of the eruption was almost diametrically opposite compared to STEREO-A's location.
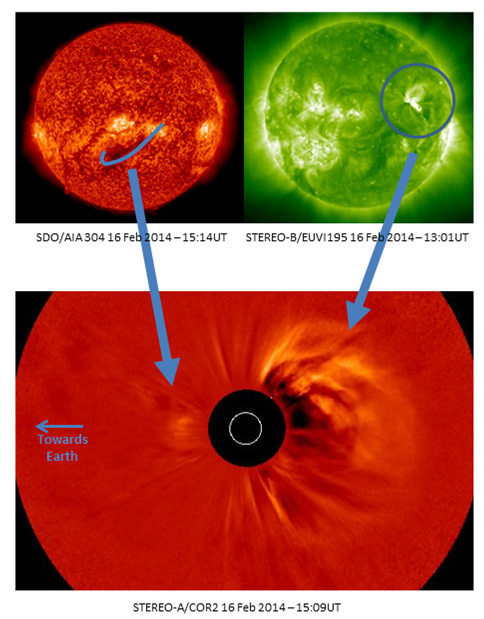
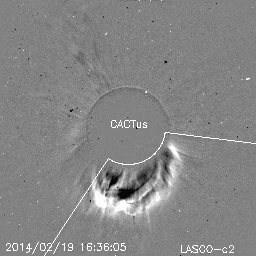
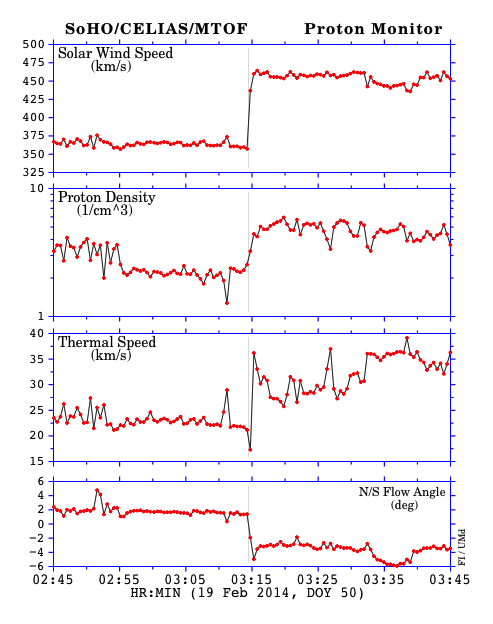
Things get a little fuzzier when it comes to the first storming period. A shock can clearly be observed in the morning hours of 19 February. It was probably related to material ejection from an event in the afternoon of 16 February, which can be seen in AIA 304 images as a dark cloud having a boomerang shape. Note that another candidate may be an eruptive event a few hours earlier. In SOHO/LASCO images, no CME can be seen, in part because around the same time, there was an eruption with CME on the backside of the Sun near old region NOAA 1968. This camouflages any signs of a weak earth-directed CME. Luckily, STEREO-A provides a side view and does show a weak CME in the ecliptic plane.
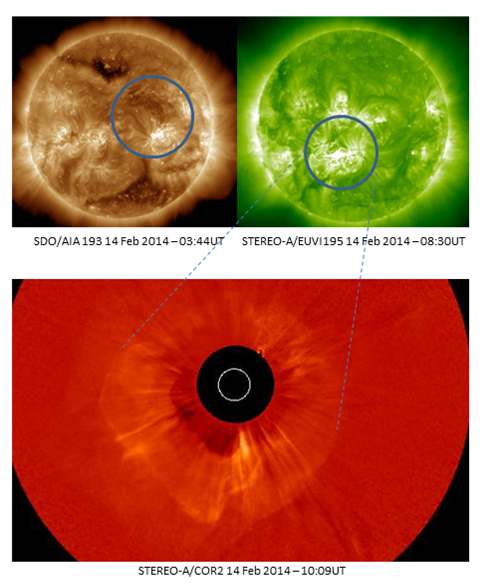
Interestingly, the CME from event 2 arrived when the geomagnetic storm was already in progress. Here, it is really problematic to trace the source of the responsible CME (event 1). The best guess is that the CME is related to a M2 flare in NOAA 1974 early on 14 February. Again, no CME can be seen, but the AIA 193 images clearly show a temporary coronal hole to the north of NOAA 1974. This means that something escaped from the Sun puncturing a temporary hole in the corona. Unfortunately, any CME signature is again camouflaged by an event with CME just a few hours later on the backside of the Sun, where good old NOAA 1967 produced a very strong flare with associated halo event as seen from STEREO-A. As (the flank of) the CME arrived at Earth on 18 February without much of an increase in solar wind speed, its sustained southwardly oriented magnetic field eventually resulted in a geomagnetic storm starting early on 19 February, just prior to the arrival of the CME from event 2.
The life of a space weather forecaster is not getting easier with all those malicious tricks that CMEs apply to get undetected to Earth. Do they have yet another trick up their sleeve? As the maximum of the ongoing solar cycle unfolds, we'll soon have our answer.
Credits - Imagery and data were taken from SDO (http://sdo.gsfc.nasa.gov/data/aiahmi/), STEREO (http://stereo.gsfc.nasa.gov/cgi-bin/images), SOHO (http://sohodata.nascom.nasa.gov/cgi-bin/data_query), PROBA2 (http://proba2.oma.be/ssa ), ACE (http://www.swpc.noaa.gov/ace/ace_rtsw_data.html), and Helioviewer (http://helioviewer.org/).
In order to view the activity of this week in more detail, we suggest going to the following website from which all the daily (normal and difference) movies can be accessed: http://proba2.oma.be/ssa.
This page also lists the recorded flaring events.
A weekly overview movie can be found here: http://proba2.oma.be/swap/data/mpg/movies/WeeklyReportMovies/WR204_Feb17_Feb23/weekly_movie_2014_02_17.mp4 (SWAP, week 204).
Details about some of this week's events can be found further below.
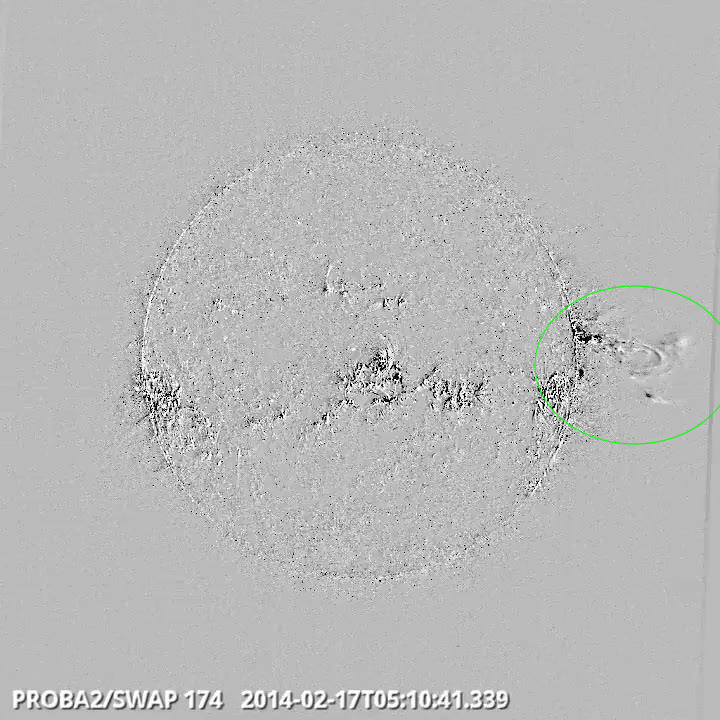
Eruption on West Limb at 05:10, SWAP difference image
Find a movie of the event here: http://proba2.oma.be/swap/data/mpg/movies/WeeklyReportMovies/WR204_Feb17_Feb23/Events/20140217_EruptionWestLimb_0510_SWAPdiff.mp4 (SWAP difference movie)
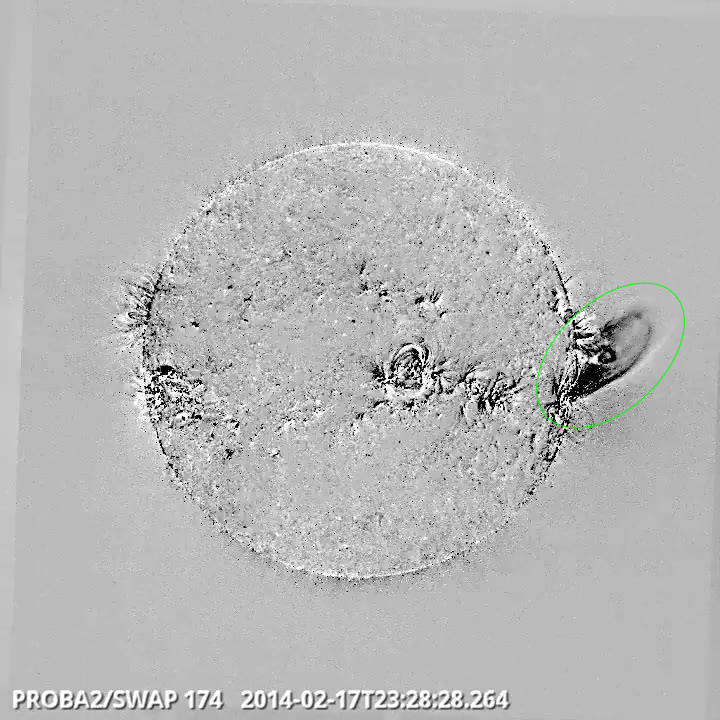
Eruption on West Limb at 23:28 - SWAP difference image
(this eruption can be seen in the movie below, preceding a large prominence eruption)
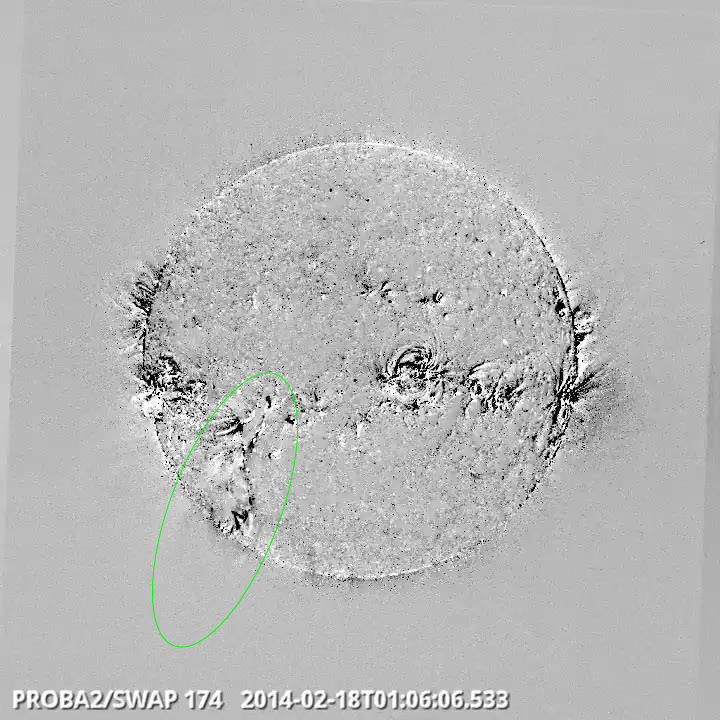
Prominence Eruption in Southeast Quadrant at 01:06, SWAP difference image
Find a movie of the event here: http://proba2.oma.be/swap/data/mpg/movies/WeeklyReportMovies/WR204_Feb17_Feb23/Events/20140217_EruptionWestLimb_2328_Plus_PromErupt20140218_SWAPdiff.mp4 (SWAP difference movie) (SWAP difference movie)
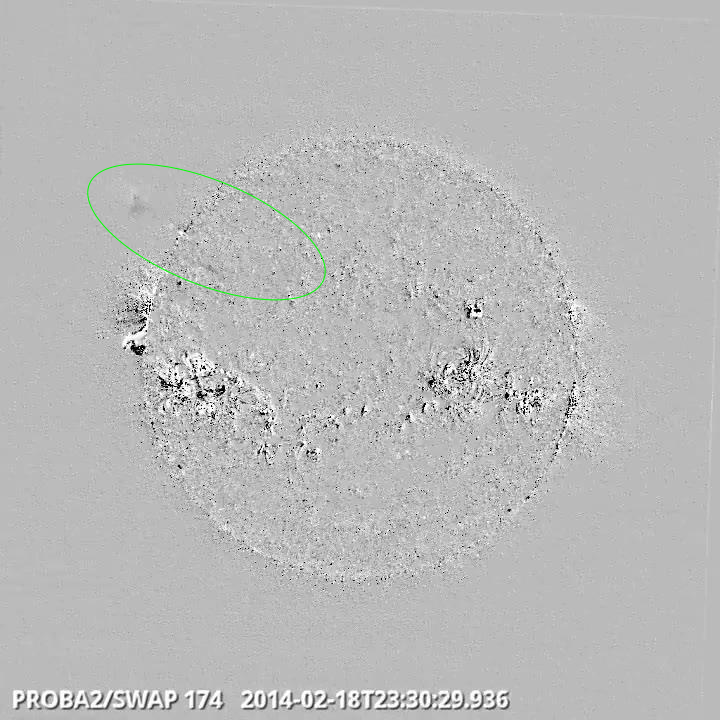
Prominence Eruption in Northeast Quadrant at 23:30, SWAP difference image
Find a movie of the event here: http://proba2.oma.be/swap/data/mpg/movies/WeeklyReportMovies/WR204_Feb17_Feb23/Events/20140218_PromEruption_NEQuad_2330_SWAPdiff.mp4 (SWAP difference movie)
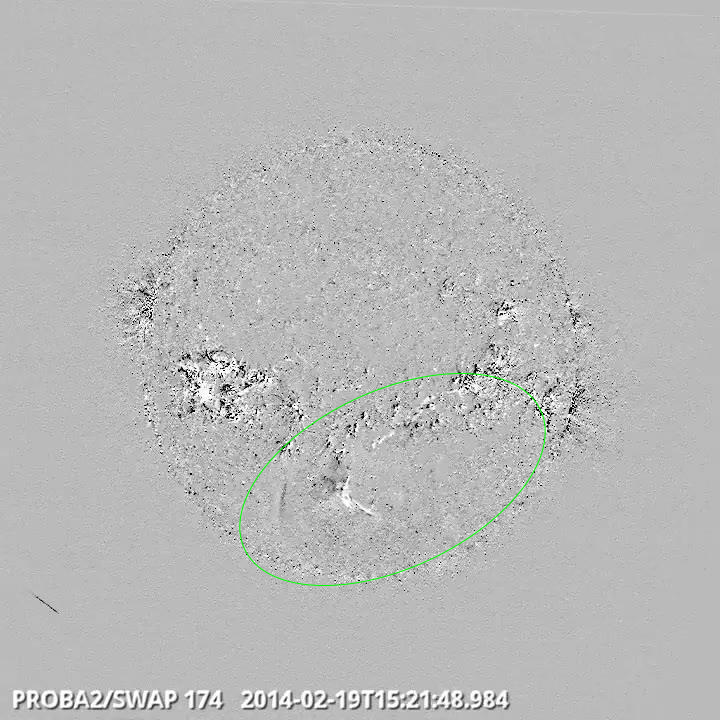
Prominence Eruption in the Southwest Quadrant at 15:21 - SWAP difference image
Find a movie of the event here: http://proba2.oma.be/swap/data/mpg/movies/WeeklyReportMovies/WR204_Feb17_Feb23/Events/20140219_PromEruption_SoutHemi_1521_SWAPdiff.mp4 (SWAP difference movie)
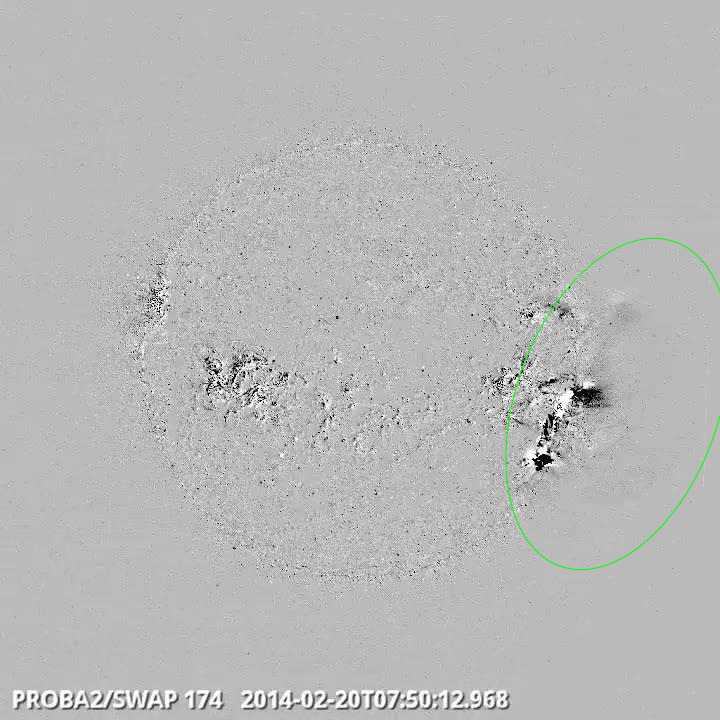
Flare Eruption on the West limb at 07:50 - SWAP difference image
Find a movie of the event here: http://proba2.oma.be/swap/data/mpg/movies/WeeklyReportMovies/WR204_Feb17_Feb23/Events/20140220_FlareEruption_M30_0750_SWAPdiff.mp4 (SWAP difference movie)
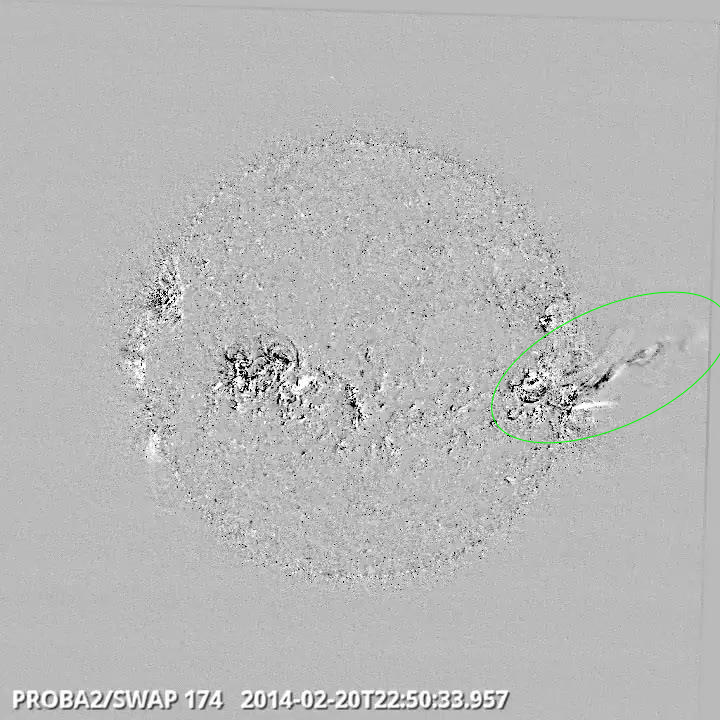
Eruption on the West limb at 22:50 - SWAP difference image
Find a movie of the event here: http://proba2.oma.be/swap/data/mpg/movies/WeeklyReportMovies/WR204_Feb17_Feb23/Events/20140220_FlareEruption_C16_2250_SWAPdiff.mp4(SWAP difference movie)
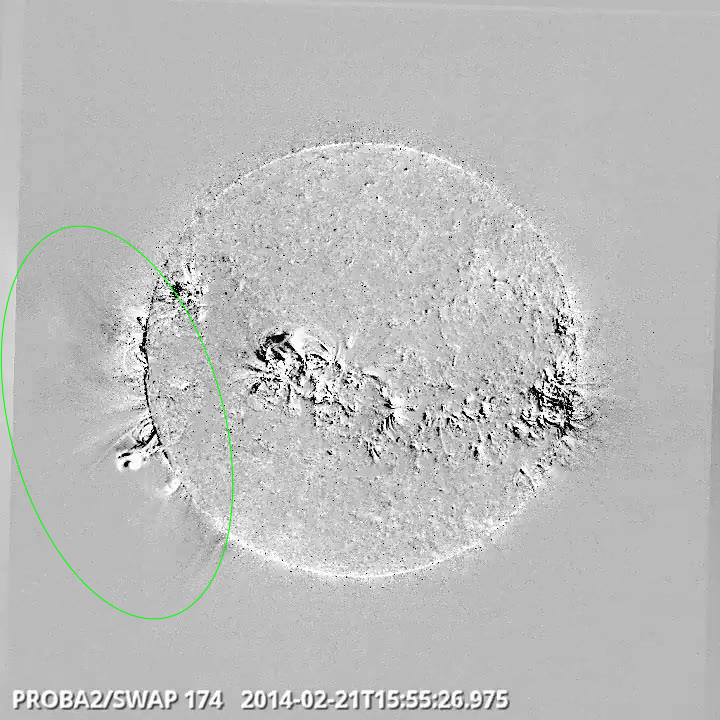
Eruption on the Southeast Limb at 15:55 - SWAP difference image
Find a movie of the event here: http://proba2.oma.be/swap/data/mpg/movies/WeeklyReportMovies/WR204_Feb17_Feb23/Events/20140221_EruptionSouthEastLimb_1555_SWAPdiff.mp4 (SWAP difference movie)
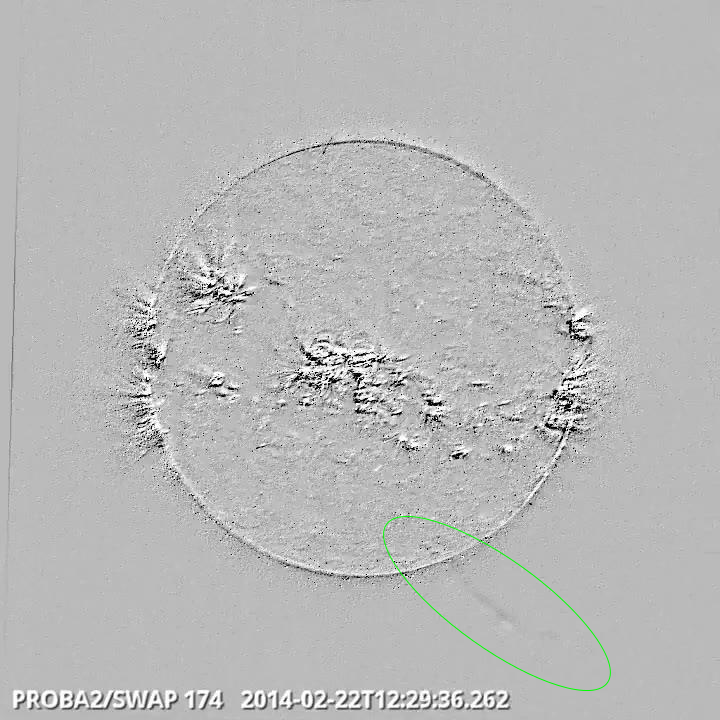
Prominence Eruption on the Southwest limb at 12:29 - SWAP difference image
Find a movie of the event here: http://proba2.oma.be/swap/data/mpg/movies/WeeklyReportMovies/WR204_Feb17_Feb23/Events/20140222_PromEruption_SouthWest_1229_SWAPdiff.mp4 (SWAP difference movie)
Solar activity was characterized by C-class flares from NOAA ARs 1974, 1976, 1977, 1980, 1982 and 1984. NOAA AR 1974 reached a beta-gamma-delta configuration at the beginning of the week and together with NOAA AR 1982 both had potential for M-class flares, but they did produce only C-class
flares.
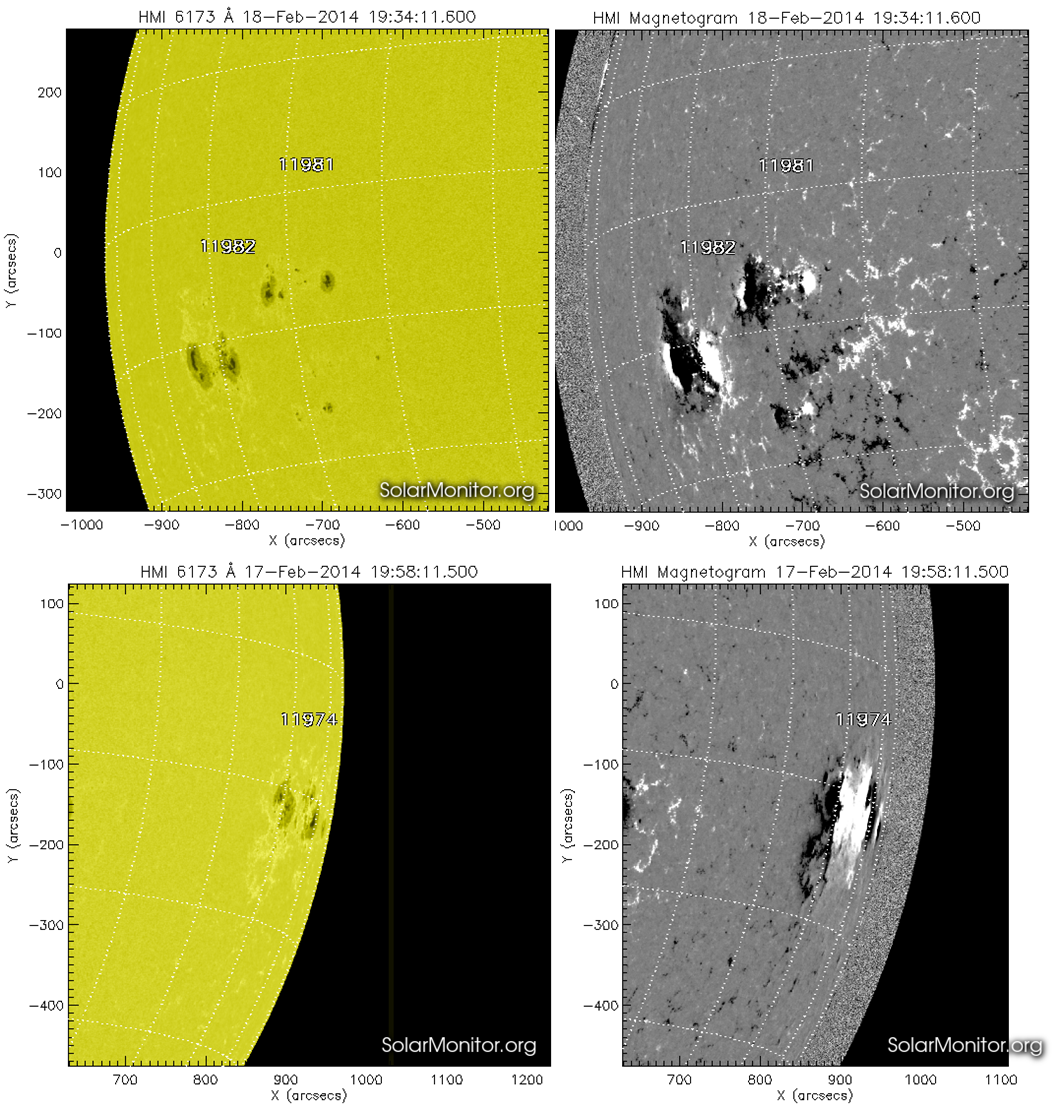
An M3.0 flare occurred at NOAA AR 1976 on February 20, peak at 07:56 UT and an M1.1 from an AR behind the east limb (old NOAA AR 1967) at 06:10 UT on February 23. As a consequence of the M3.0 flare the proton fluxes crossed the threshold of 10 protons/cm2-s-sr at 10 MeV energies and
remained at high levels for several hours.
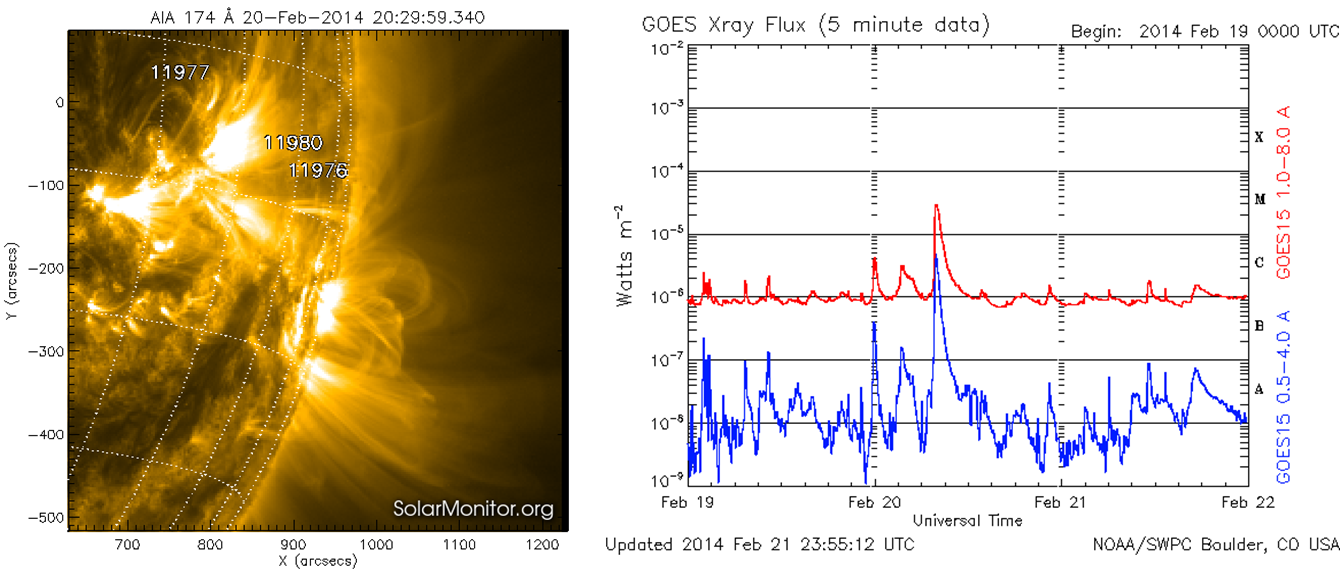
On February 19, a halo CME was seen at 16:00 UT, related to a filament eruption close to the central meridian.
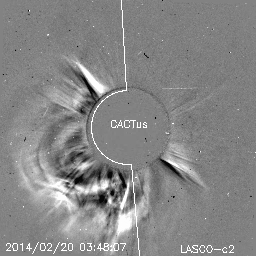
On February 20 there were two of them. The first one, seen at 03:12 UT by LASCO-C2, was related to a C3.3 flare from NOAA AR 1982.
The second one, 09:12 UT, occurred in relation with the M3.0 flare from NOAA AR 1976.
Several backsided halo CMEs occurred during the week, some in association with activity from the old NOAA AR 1967.
| DAY | BEGIN | MAX | END | LOC | XRAY | OP | 10CM | TYPE | Cat | NOAA |
| 20 | 0726 | 0756 | 0825 | S15W73 | M3.0 | SN | 420 | V/1III/2II/2 | 42 | 1976 |
| 23 | 0550 | 0610 | 0636 | M1.1 |
| LOC: approximate heliographic location | TYPE: radio burst type |
| XRAY: X-ray flare class | Cat: Catania sunspot group number |
| OP: optical flare class | NOAA: NOAA active region number |
| 10CM: peak 10 cm radio flux |
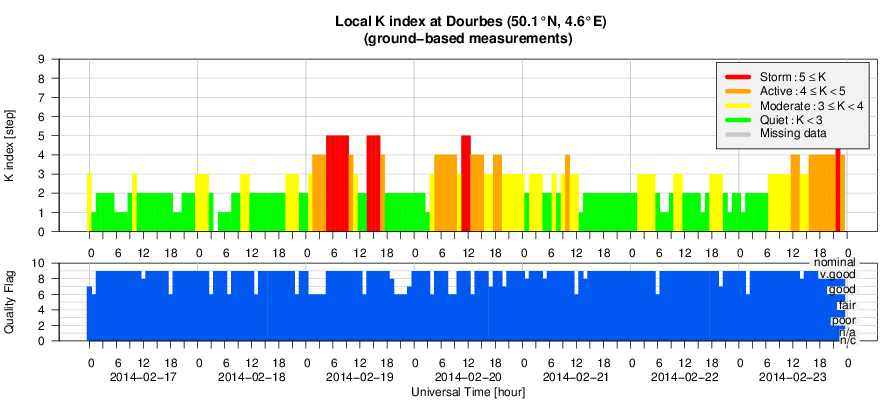
Geomagnetic conditions reached major storm levels (Kp = 6) on February 19 and February 20 with the arrival of three disturbances: see http://stce.be/news/239/welcome.html
The solar origin of these three transients is not completely clear. The first one (arriving around 13:00 UT on February 18 to ACE), could be related to a weak halo CME on February 14 (in association with an M2.3 flare peaking at 02:57 UT). The second one was marked by a shock arrival at 03:10 UT on February 19.
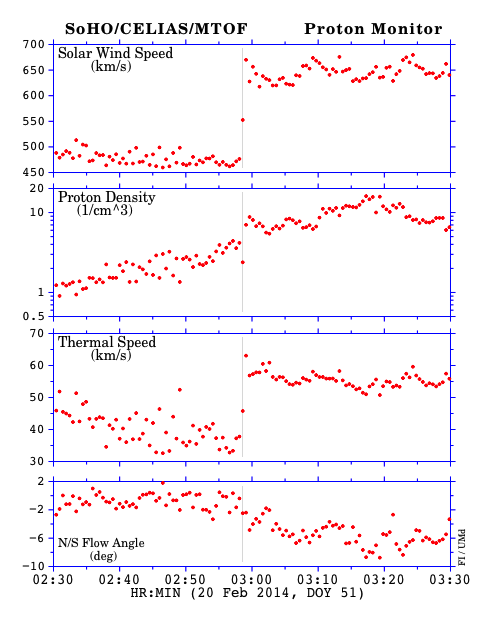
The third disturbed period (shock arrival at 02:58 on February 20) corresponds to a full halo CME that erupted at 01:25 UT (first seen by LASCO-C2) on February 18.
On February 23, a weak transient arrived to ACE around 02:30 UT related to the CMEs of February 20, as a consequence, geomagnetic conditions reached active levels.
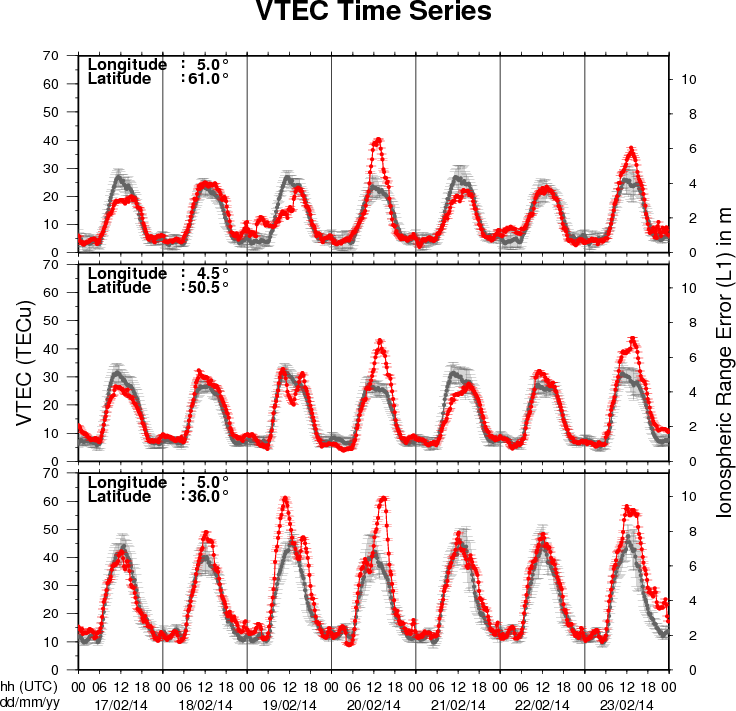
The figure shows the time evolution of the Vertical Total Electron Content (VTEC) (in red) during the last week at three locations:
a) in the northern part of Europe(N61°, 5°E)
b) above Brussels(N50.5°, 4.5°E)
c) in the southern part of Europe(N36°, 5°E)
This figure also shows (in grey) the normal ionospheric behaviour expected based on the median VTEC from the 15 previous days.
The VTEC is expressed in TECu (with TECu=10^16 electrons per square meter) and is directly related to the signal propagation delay due to the ionosphere (in figure: delay on GPS L1 frequency).
The Sun's radiation ionizes the Earth's upper atmosphere, the ionosphere, located from about 60km to 1000km above the Earth's surface.The ionization process in the ionosphere produces ions and free electrons. These electrons perturb the propagation of the GNSS (Global Navigation Satellite System) signals by inducing a so-called ionospheric delay.
See http://stce.be/newsletter/GNSS_final.pdf for some more explanations ; for detailed information, see http://gnss.be/ionosphere_tutorial.php
Start : 2014-04-27 - End : 2014-05-02
The EGU General Assembly 2014 will bring together geoscientists
from all over the world to one meeting covering all disciplines of
the Earth, planetary and space sciences. The EGU aims to provide a
forum where scientists, especially early career researchers, can
present their work and discuss their ideas with experts in all
fields of geosciences.