
The Solar-Terrestrial Centre of Excellence (STCE) is a collaborative network of the Belgian Institute for Space Aeronomy, the Royal Observatory of Belgium and the Royal Meteorological Institute of Belgium.
|
Published by the STCE - this issue : 20 Mar 2014. The Solar-Terrestrial Centre of Excellence (STCE) is a collaborative network of the Belgian Institute for Space Aeronomy, the Royal Observatory of Belgium and the Royal Meteorological Institute of Belgium. |
| Archive of the newsletters | Subscribe to this newsletter by mail |
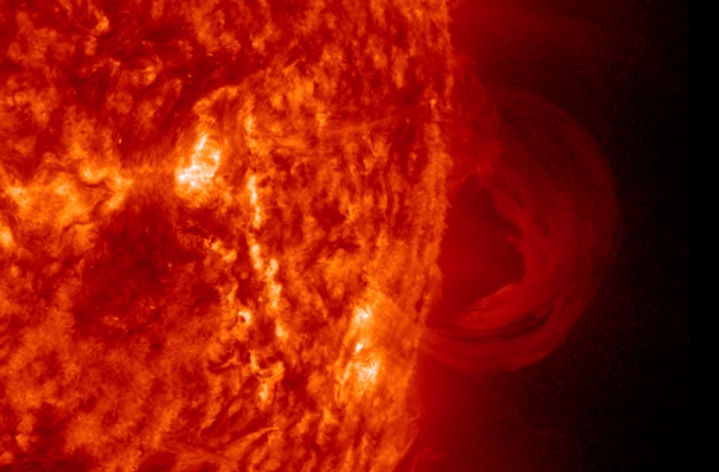
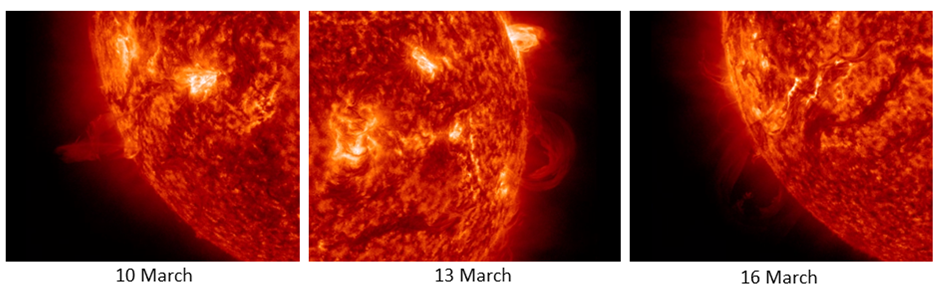
Over the last few weeks, big, complex sunspot groups and associated high flaring activity got everybody's attention. One would almost forget that solar filaments are also part of the solar activity. Time for a change!
Solar filaments are clouds of ionized gas above the solar surface squeezed between magnetic regions of opposite polarity. Being cooler and denser than the plasma underneath and their surroundings, these magnetic borderlines appear as dark lines when seen on the solar disk using special filters. As filaments grow longer, they are more likely to erupt, showing a prominence (near the limb) and often accompanied by a coronal mass ejection (CME).
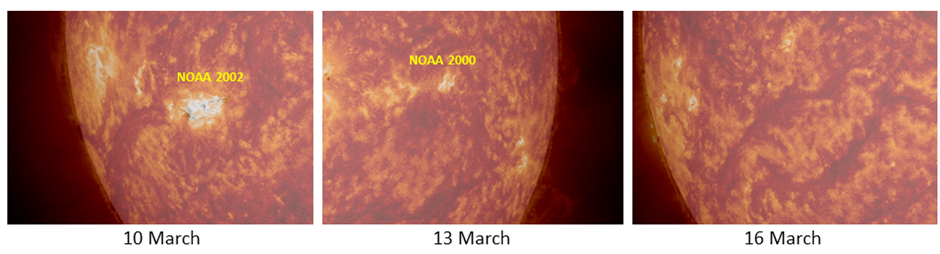
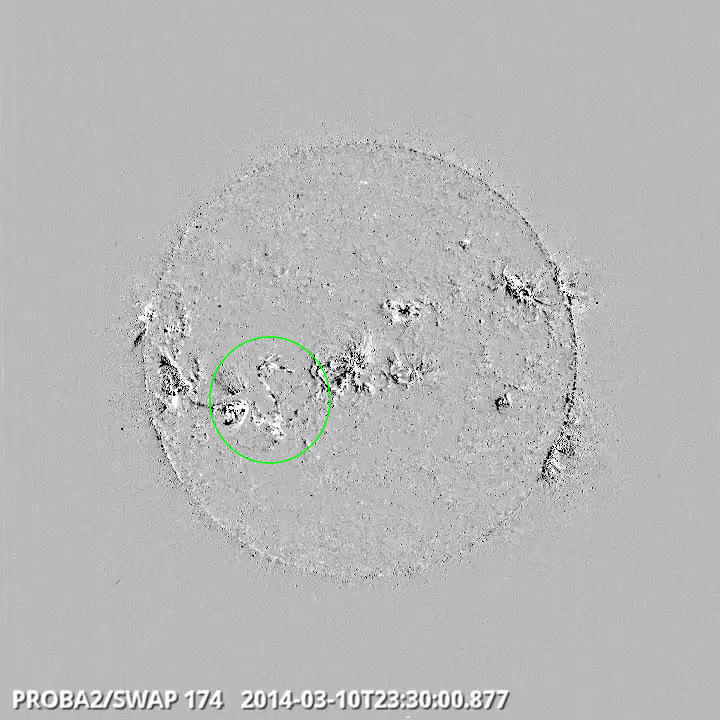
Usually, such long filaments stay away from active regions, but the northern end of the 10 March filament was very close to the trailing section of active region NOAA 2002. The 13 March filament's northern end was close to re-emerging region NOAA 2000, whereas the 16 March filament was buddying with another long and nearby filament to the west, and not near any sunspot region at all.
In all three cases, post eruption coronal loops became visible, but only the 13 March event had loops over pretty much the entire length of the source filament ("arcade"). For the other two events, these loops were confined to small areas resp. in the north and the middle portion.
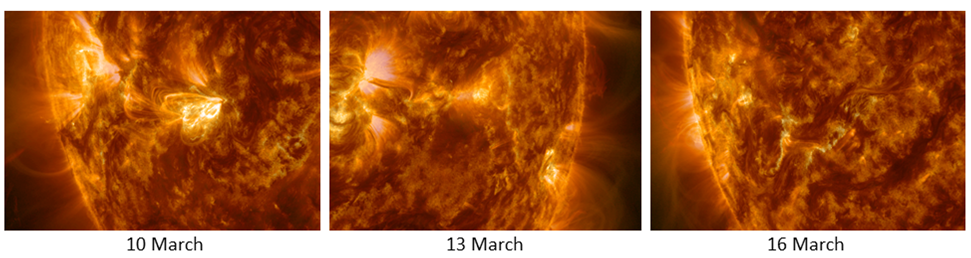
If any coronal mass ejection (CME) was associated to the 10 March filament eruption, it is very likely that it was in the same direction as the CME that was already visible at 17:48UT in LASCO/C2. That one was probably associated to the M1 flare in nearby active region NOAA 2002. It came also into view well before the filament eruption started. The two other CMEs were a lot more obvious, in particular the 16 March CME. None of the CMEs had an Earth directed component, so those filaments need to fine-tune their next rebellion.
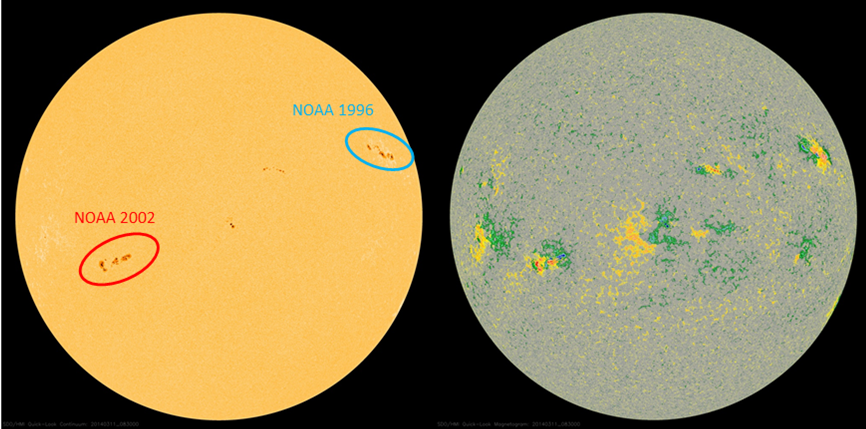
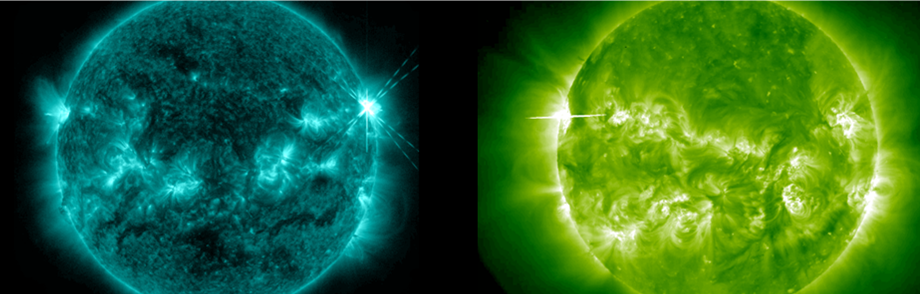
This week, a total of 9 M flares and 35 C flares were observed. In the first half of the week, active regions (AR) NOAA 1996 and 2002 produced nearly all the M-class flares and the majority of the C-class flares.
| DAY | BEGIN | MAX | END | LOC | XRAY | OP | 10CM | TYPE | Cat | NOAA |
| 10 | 0019 | 0026 | 0033 | S19E52 | M1.1 | SF | 73 | 2002 | ||
| 10 | 0402 | 0408 | 0413 | M1.0 | 73 | 2002 | ||||
| 10 | 1521 | 1528 | 1532 | M1.7 | 73 | 2002 | ||||
| 10 | 2245 | 2300 | 2312 | N14W51 | M1.4 | SF | 64 | 1996 | ||
| 11 | 0344 | 0350 | 0356 | N13W55 | M3.5 | 1F | 110 | 64 | 1996 | |
| 11 | 1158 | 1207 | 1214 | M1.7 | 1991 | |||||
| 12 | 1055 | 1105 | 1111 | N13W69 | M2.5 | SN | 64 | 1996 | ||
| 12 | 2228 | 2234 | 2239 | N15W78 | M9.3 | SB | 140 | 64 | 1996 | |
| 13 | 1903 | 1919 | 1930 | M1.2 | 64 | 1996 |
| LOC: approximate heliographic location | TYPE: radio burst type |
| XRAY: X-ray flare class | Cat: Catania sunspot group number |
| OP: optical flare class | NOAA: NOAA active region number |
| 10CM: peak 10 cm radio flux |
Solar flare activity fluctuated between low and moderate during the week.
In order to view the activity of this week in more detail, we suggest to go to the following website from which all the daily (normal and difference) movies can be accessed: http://proba2.oma.be/ssa
This page also lists the recorded flaring events.
A weekly overview movie can be found here (SWAP week 207).
http://proba2.oma.be/swap/data/mpg/movies/WeeklyReportMovies/WR207_Mar10_Mar16/weekly_movie_2014_03_10.mp4
Details about some of this week's events, can be found further below.
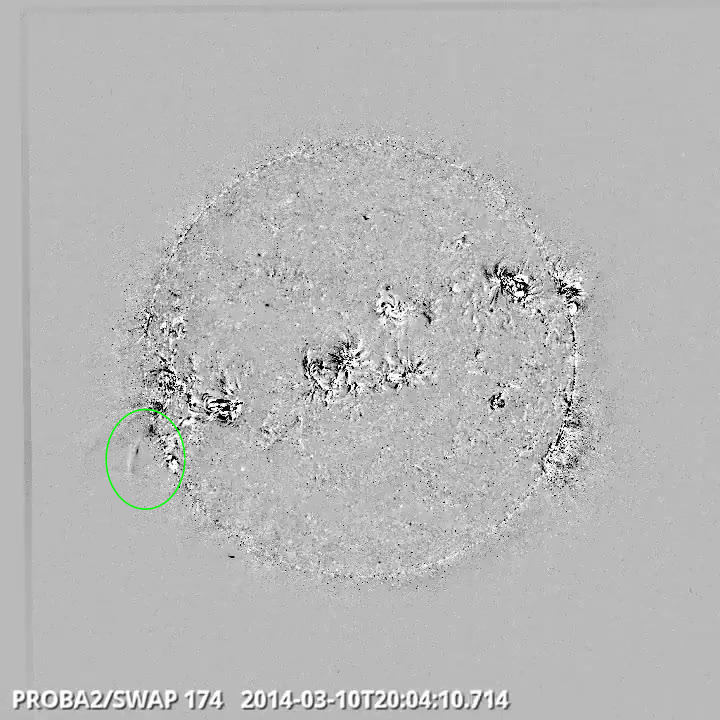
Eruption on the southeast quad @ 20:04 SWAP difference image
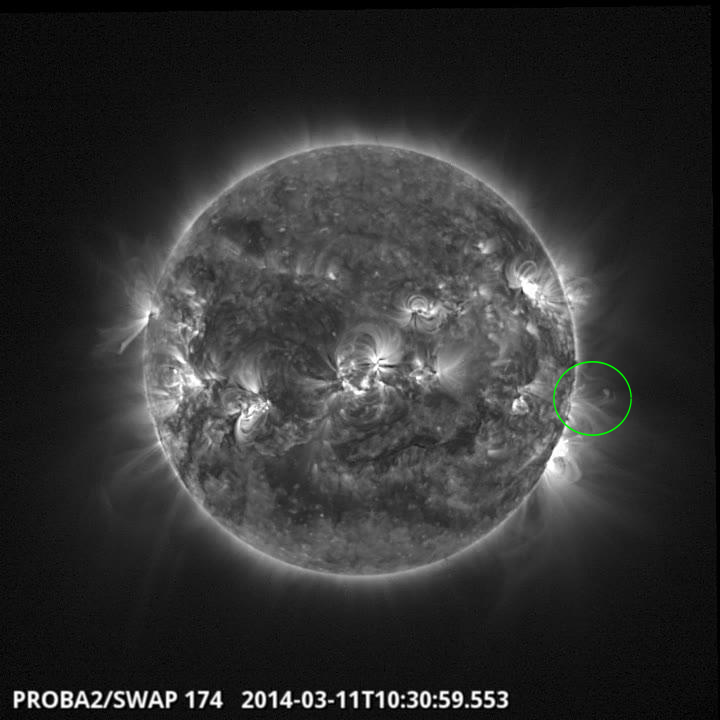
Eruption on the west limb @ 10:30 SWAP difference image
Find a movie of the event here (SWAP daily movie)
http://proba2.oma.be/swap/data/mpg/movies/20140311_swap_movie.mp4
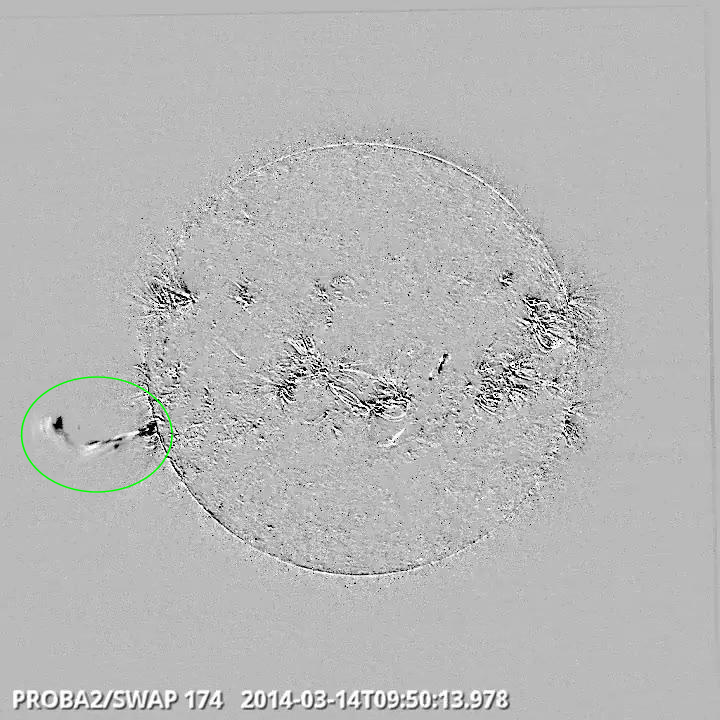
Eruption on the east limb @ 09:50 SWAP difference image
Find a movie of the event here (SWAP daily diff movie)
http://proba2.oma.be/swap/data/mpg/movies/20140314_swap_diff.mp4
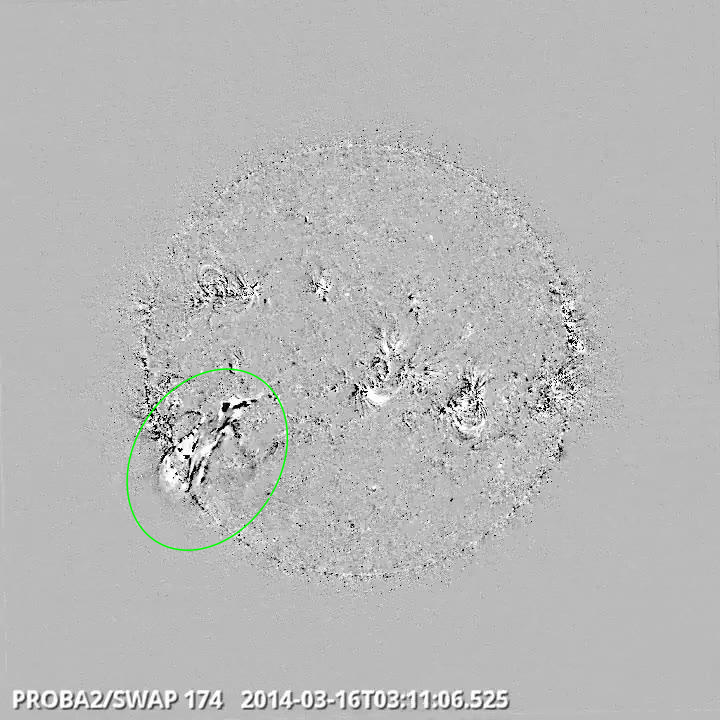
Eruption in the southeast quadrant @ 03:11 SWAP difference image
Find a movie of the event here (SWAP diff movie)
http://proba2.oma.be/swap/data/mpg/movies/WeeklyReportMovies/WR207_Mar10_Mar16/Events/20140316_Eruption_SouthEastQuad_0311_swap_diff.mp4
Find a movie of the event here (SWAP movie)
http://proba2.oma.be/swap/data/mpg/movies/WeeklyReportMovies/WR207_Mar10_Mar16/Events/20140316_Eruption_SouthEastQuad_0311_swap_movie.mp4
Solar wind speed as observed by ACE was low (around 300 km/s) until 12 March when the arrival of a high speed stream from a coronal hole on the southern solar hemisphere gradually increased wind speeds to about 500 km/s on 14 March. The effects of the high speed stream subsided on 15 March. From 12 to 14 March, the magnitude of the Interplanetary Magnetic Field (IMF) varied between 5 and 10 nT. Before and after this period, nominal values of 5 nT or less were registered.
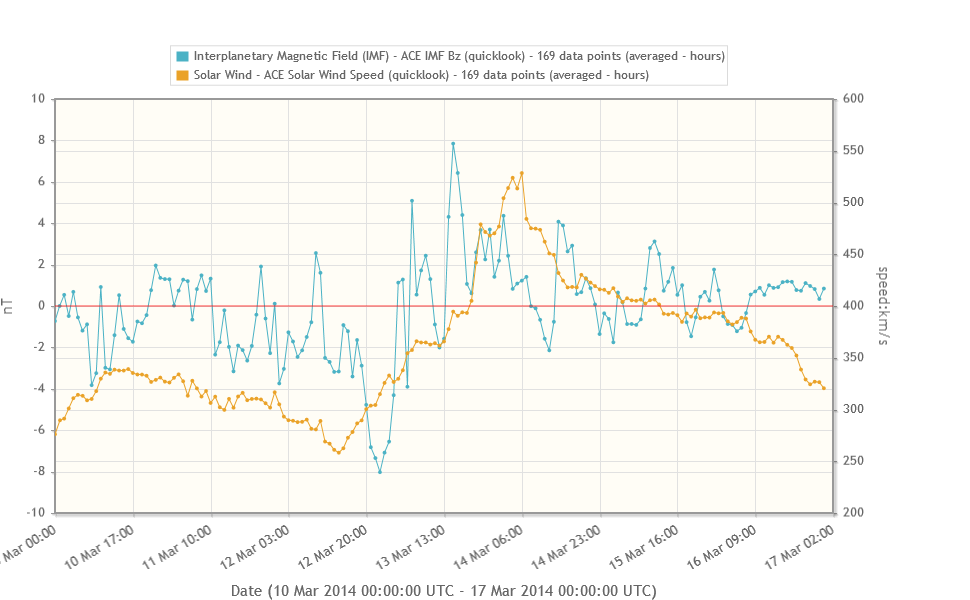
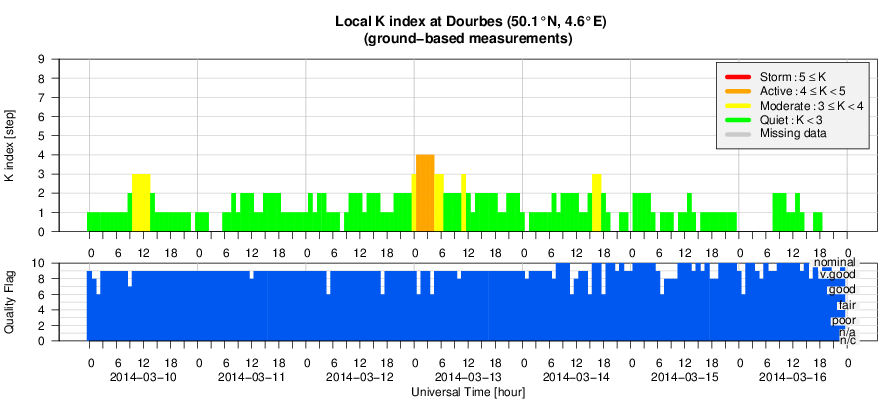
Geomagnetic activity has been quiet (K Dourbes and NOAA Kp smaller than 4) throughout the whole week, except between 0h and 6h UT on 13 March, when K Dourbes reached 4 and Kp reached up to 5, in response to the elevated solar wind speed and IMF magnitude, combined with a negative Bz.

The figure shows the time evolution of the Vertical Total Electron Content (VTEC) (in red) during the last week at three locations:
a) in the northern part of Europe(N61°, 5°E)
b) above Brussels(N50.5°, 4.5°E)
c) in the southern part of Europe(N36°, 5°E)
This figure also shows (in grey) the normal ionospheric behaviour expected based on the median VTEC from the 15 previous days.
The VTEC is expressed in TECu (with TECu=10^16 electrons per square meter) and is directly related to the signal propagation delay due to the ionosphere (in figure: delay on GPS L1 frequency).
The Sun's radiation ionizes the Earth's upper atmosphere, the ionosphere, located from about 60km to 1000km above the Earth's surface.The ionization process in the ionosphere produces ions and free electrons. These electrons perturb the propagation of the GNSS (Global Navigation Satellite System) signals by inducing a so-called ionospheric delay.
See http://stce.be/newsletter/GNSS_final.pdf for some more explanations ; for detailed information, see http://gnss.be/ionosphere_tutorial.php
Presentation supporting the splinter meeting, see http://www.stce.be/esww10/splinters/ssa.php
http://www.spaceweather.eu/en/repository/show?id=490
http://www.spaceweather.eu/en/repository/show?id=491
http://www.spaceweather.eu/en/repository/show?id=492
http://www.spaceweather.eu/en/repository/show?id=493
Start : 2014-03-30 - End : 2014-04-04
Biennial CCMC community workshops are designed as opportunities
for an in-depth exchange of experiences, opinions and needs between
model owners, science and operational users, agency representatives
and the CCMC staff.
Website:
http://ccmc.gsfc.nasa.gov/CCMC_Workshop_2014/index.php
Start : 2014-04-27 - End : 2014-05-02
The EGU General Assembly 2014 will bring together geoscientists
from all over the world to one meeting covering all disciplines of
the Earth, planetary and space sciences. The EGU aims to provide a
forum where scientists, especially early career researchers, can
present their work and discuss their ideas with experts in all
fields of geosciences.