
The Solar-Terrestrial Centre of Excellence (STCE) is a collaborative network of the Belgian Institute for Space Aeronomy, the Royal Observatory of Belgium and the Royal Meteorological Institute of Belgium.
|
Published by the STCE - this issue : 28 Mar 2014. The Solar-Terrestrial Centre of Excellence (STCE) is a collaborative network of the Belgian Institute for Space Aeronomy, the Royal Observatory of Belgium and the Royal Meteorological Institute of Belgium. |
| Archive of the newsletters | Subscribe to this newsletter by mail |
We are now more than 5 years in the current solar cycle (SC), and so far we have not experienced a single extreme geomagnetic storm.
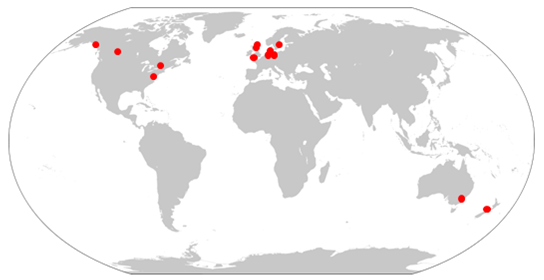
There exist several parameters to gauge the level of disturbance of the Earth's magnetic field. One of the most commonly used is the Kp-index. "Kp" is short for "planetarische Kennziffer" (German for "planetary index"). It was introduced by Julius Bartels in 1949 and extended back to 1932. This 3-hourly index is derived from magnetic recordings done in 13 subauroral observatories (see map underneath). Note that over time, a few of the original stations have dropped out, while a few others have been added.
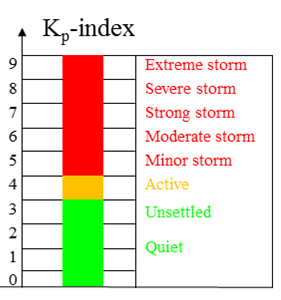
The Kp-index is deduced from the individual K-indices each of which is compensated for diurnal and seasonal differences (Note 1). It is essentially based on the maximum deviation of the local horizontal magnetic field component compared to a quiet day. The final Kp-index is expressed in thirds from 0 to 9 (0, 0.3, 0.7, 1, ... , 8.7, 9), hence varies between very quiet (Kp=0) to extreme storm (Kp=9). Note the scale is open-ended, i.e. no matter how big the geomagnetic deviation is during an extreme geomagnetic storm, Kp will always remain 9.
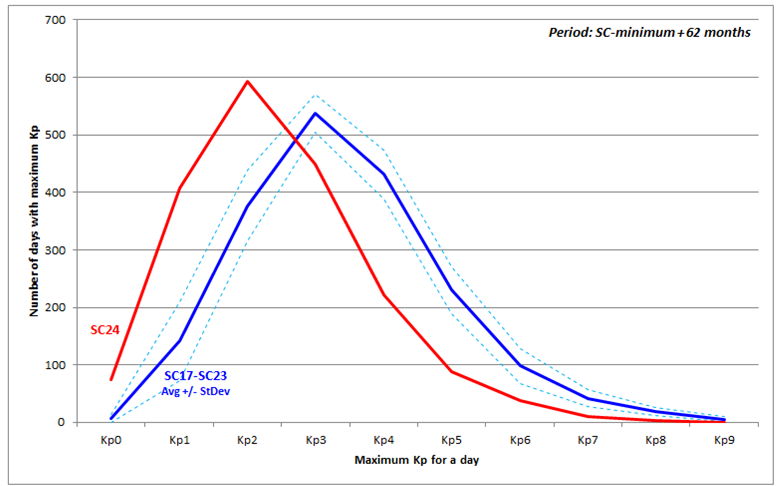
A quick analysis of the final Kp-indices as archived at the Kyoto World Data Centre (WDC) for geomagnetism (http://wdc.kugi.kyoto-u.ac.jp/kp/index.html) reveals that the current solar cycle (SC24) is really underperforming so far. Not only has there not been any day with extreme geomagnetic storming, SC24 also has a lot more "quiet" days compared to the average of the previous 7 solar cycles (SC17-23). Of course, most of those cycles had already passed their maximum for 1-2 years, whereas SC24 is peaking only now and at a much lower solar activity level.
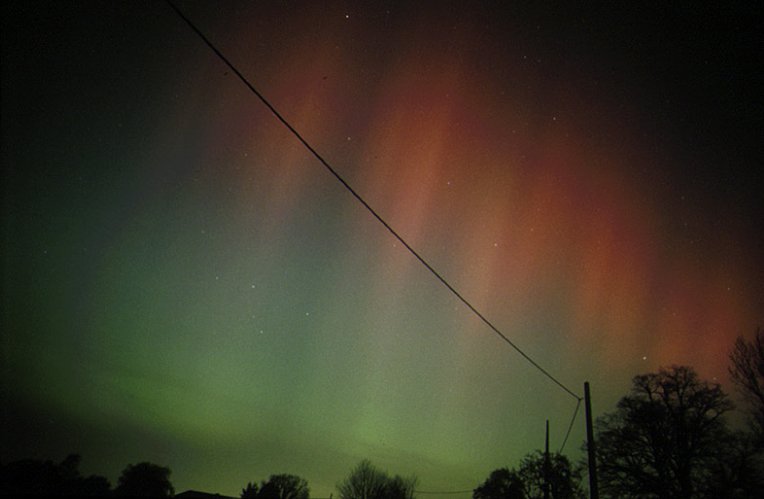
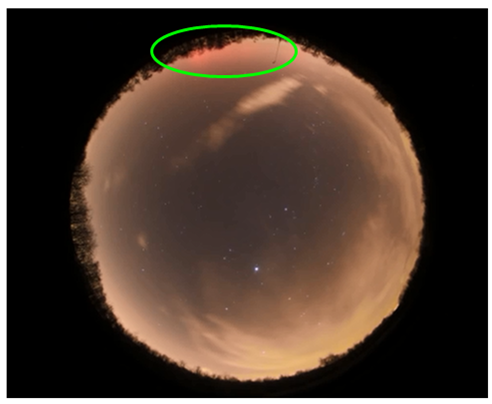
For countries at a moderate or low geomagnetic latitude such as Belgium (46 degrees), one needs a Kp-index equal to or near 9 (extreme storm) to appreciate the polar light in all its glory. Such was on several occasions the case during the last solar cycle. Picture underneath, taken in Belgium by Philippe Mollet (http://www.mollet-cornelis.be/aurora/index.htm), shows the polar light during the morning hours of 7 April 2000 when Kp values were near 9. Note the red color of the aurora which, if present, usually defines the top of the polar light phenomenon (highest in the sky), hence it is often the first sign of aurora visibility from southern locations.
Of course, polar light can also be seen at these locations with a slightly lower Kp-value, but the visibility quickly degrades as the aurora hardly rises above the horizon. An observing site far away from city lights and under a moonless, clear sky, might still provide a glimpse. Photography boosts chances as the longer exposure times may allow to catch the faint glow low above the horizon. Such was recently the case during the evening of 27 February, when an all-sky camera near the Belgian coast (Franky Dubois - https://www.youtube.com/watch?v=_cw-tys0Ax8) recorded the diffuse red aurora for just a few minutes at a Kp of hardly 6. The visual display at that location was a non-event, but observers just a few 100 kilometers to the North (middle part of The Netherlands, England, Ireland,...) reported a nice display. With SC24 hardly half way, it is very likely we'll still have some more opportunities on a great and colorful show.
Note 1: More on the Kp-index at GFZ Potzdam: (GFZ Potsdam - http://www.gfz-potsdam.de/en/research/organizational-units/departments/department-2/earths-magnetic-field/services/kp-index/ ).
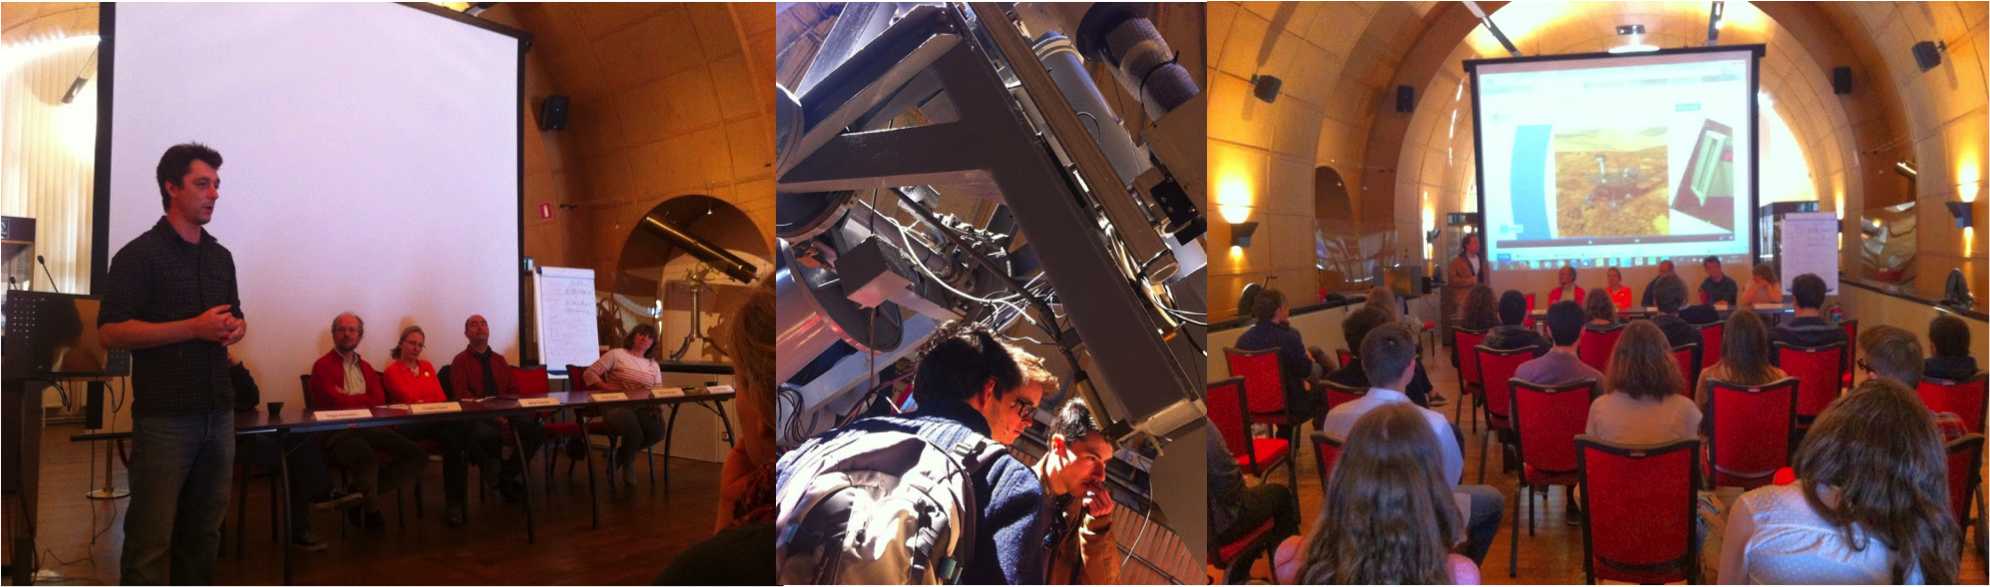
Thursday, March 20th, students from 5th secondary participated in the Dream Day at the STCE. This event, organized by ICHEC, Brussels Management School, allows students ending secondary school, to meet professionals to get acquainted with jobs to which they are attracted.
During the morning, 5 people working at the observatory and one from the BIRA came to talk about their choice at school, university, studies and about their career to give a clearer idea on their job and how they came to work in that particular field at that particular institute. Ideas were exchanged and students were given answers to their questions and possible future career moves.
Schools from Laeken and Genval attended this event. By late morning, everyone was delighted about the fact that they got so much input about work at the space pole. The morning ended with a tour of the solar telescope in bright sunshine.
Merci à vous et votre équipe d'avoir pris du temps pour nous faire découvrir vos métiers et répondre à nos questions. La visite du téléscope était aussi très intéressante.Encore merci. Alizée
Je vous remercie chaleureusement pour cette fantastique rencontre que j'aie eu avec vous et vos collègues. Cette journée fut très enrichissante pour moi car je me suis longtemps demandé en quoi consistait la recherche fondamentale ainsi que la vie d'un chercheur. En outre, ce fut très instructif de recevoir le témoignage de six scientifiques différents, ce qui m'as permis de voir un même métier sous plusieurs angles. D'ailleurs, ces témoignages m'on permis de trouver une réponse à la plupart des questions que je me posais.Je vous en suis très reconnaissant.
Adrien
Ma visite dans l'Observatoire, dans le cadre du Dreamday, m'a semblé intéressante.”En effet, découvrir le travail et le parcours de quelques membres de son personnel m'a permis de comprendre que le domaine scientifique n'est pas un cercle fermé qui n'est accessible qu'à certains initiés. Pour cela et pour l'accueil que vous nous avez accordé, je tiens juste à vous exprimer ma gratitude.En un mot: merci !
Yves
Solar activity alternated between low and moderate, two M1-level flares being recorded, one on Thursday and one on Saturday.
In order to view the activity of this week in more detail, we suggest going to the following website from which all the (normal and difference) daily movies can be accessed: http://proba2.oma.be/ssa.
This page also lists the recorded flaring events.
A weekly overview movie can be found here: http://proba2.oma.be/swap/data/mpg/movies/WeeklyReportMovies/WR208_Mar17_Mar24/weekly_movie_2014_03_17.mp4
or use the tiny URL
http://tinyurl.com/ndmmyvc
(SWAP week 208).
Details about some of this week’s events can be found further below.
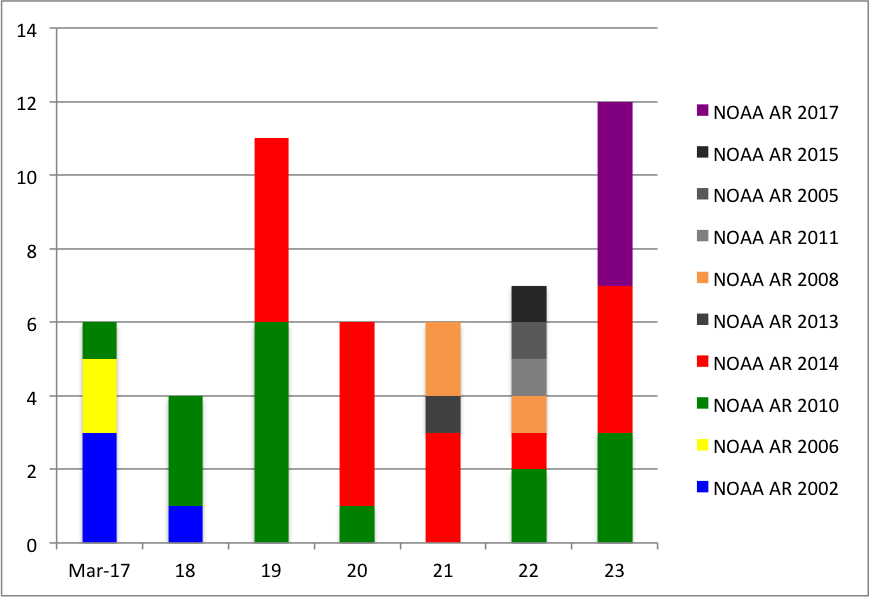
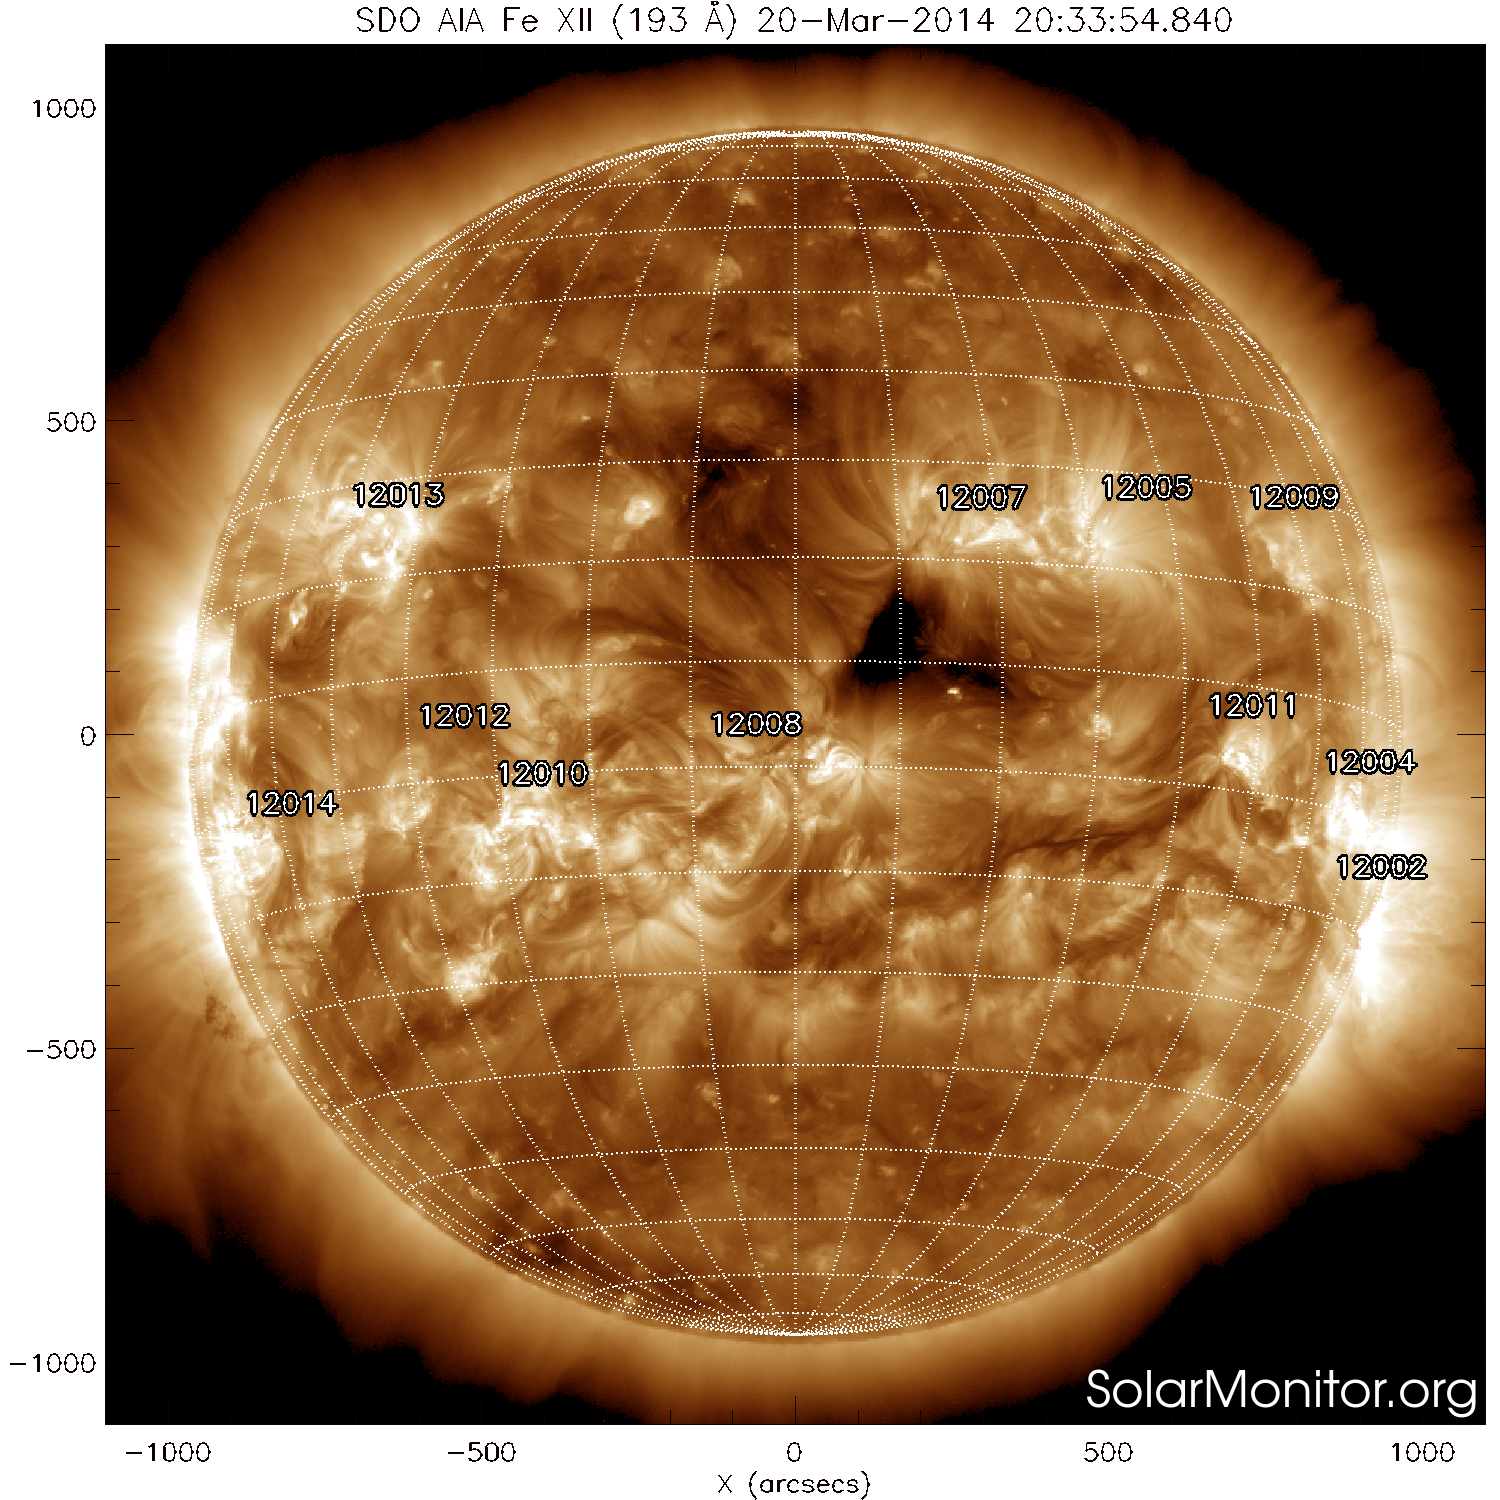
We count a total of 52 C and M flares assigned to a NOAA active region. The flaring activity was mainly linked to NOAA AR 2010 and 2014 with March 23 the top flare day with 12 flares and March 19 the second top flare day with 11 flares. Flare intensity record holder was NOAA AR 2010 with an M1.7 flare on March 20. The record for the number of flares is assigned to NOAA AR 2014 with 18 flares. For completeness: NOAA AR 2011 produced a second M-flare (M1.1) on March 22, the region's main feat.
The chart below gives an overview of the number of flares produced by an active region per day.
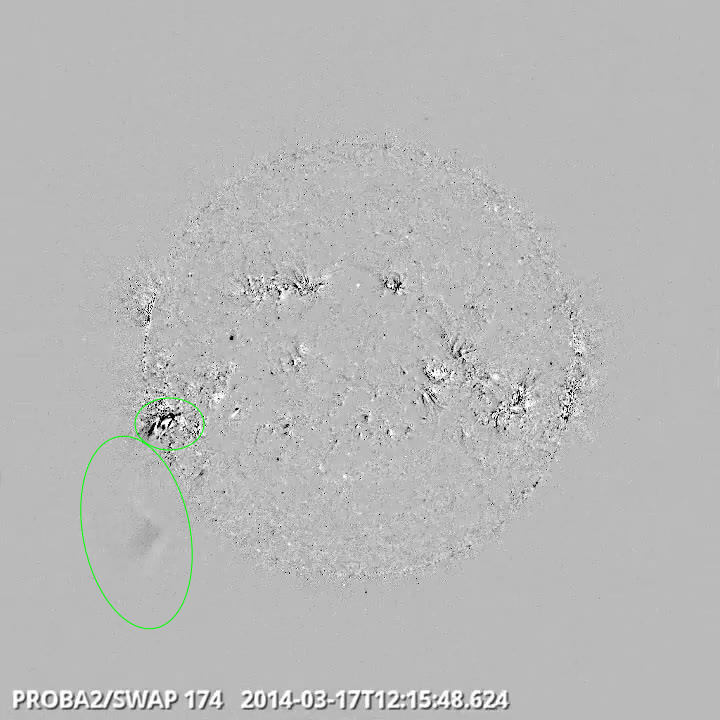
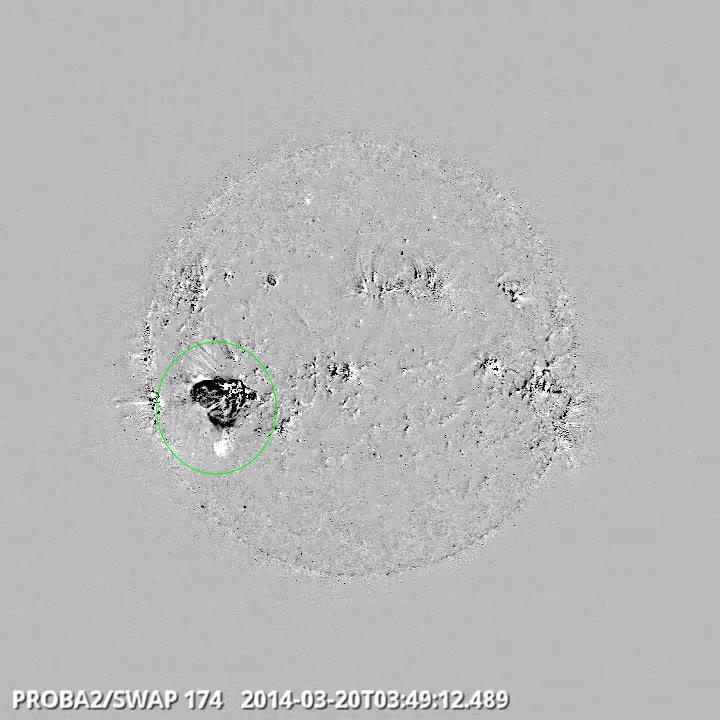
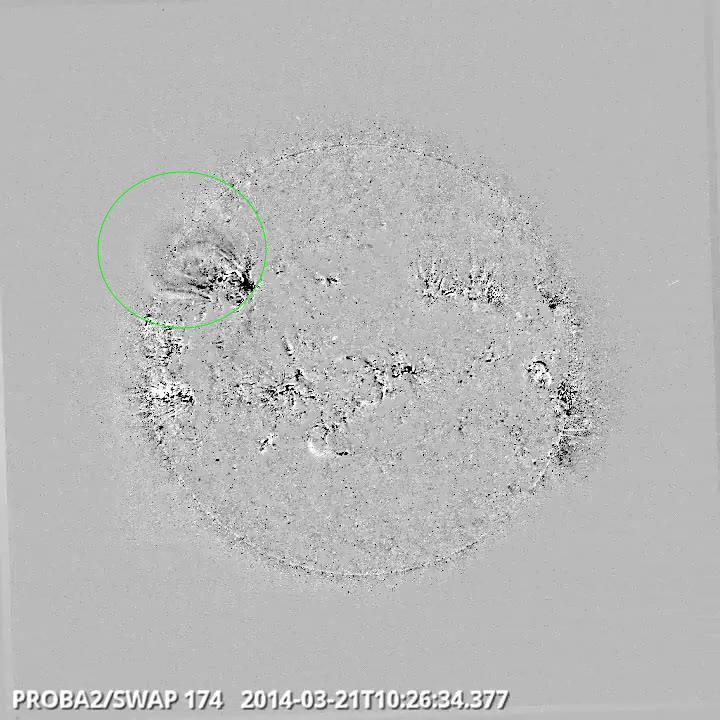
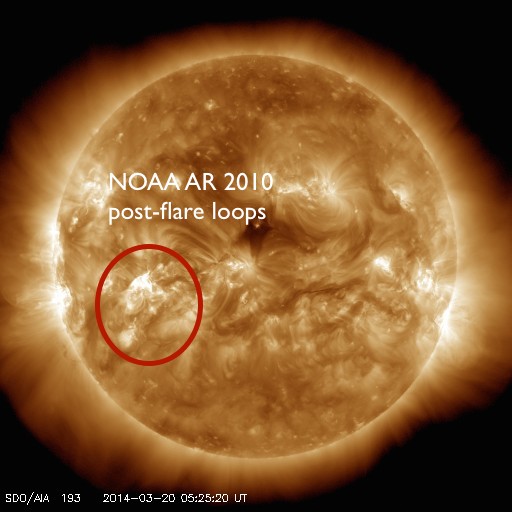
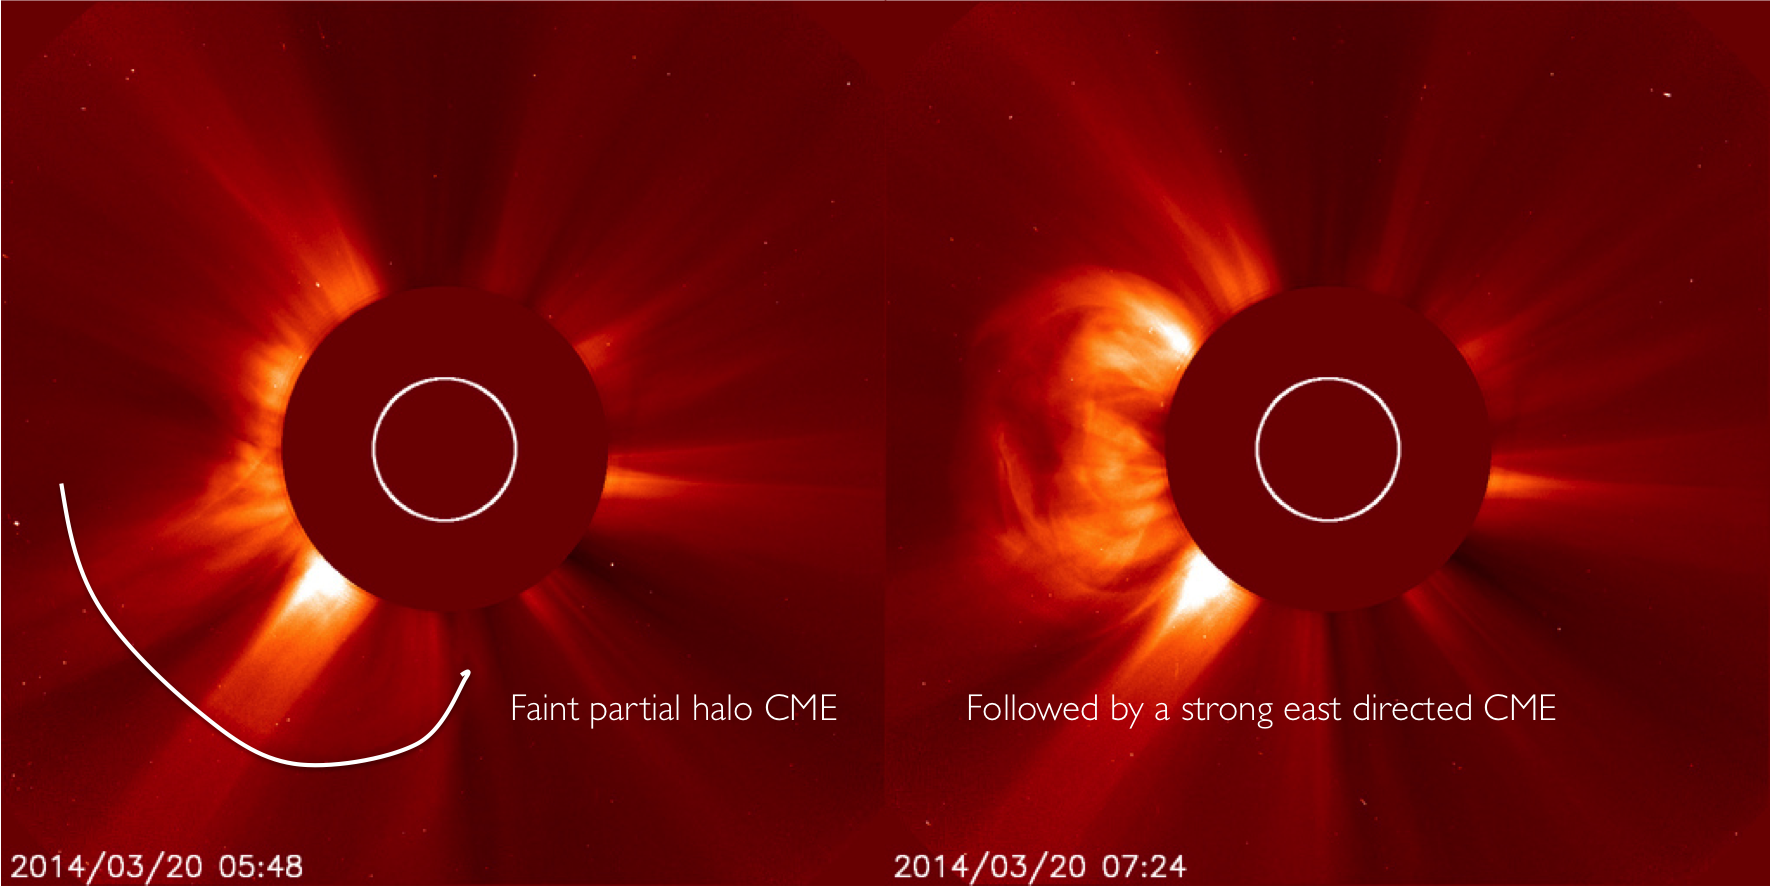
An EUV wave and dimming was seen on March 20 in SDO/AIA 194 evolving around NOAA AR 2010 while it released the M1.7 flare with peak at 03:56UT. This indicates that plasma is ejected. A CME came indeed into the LASCO/C2 FOV at 04:48UT. It was a partial halo CME but faint and slow and therefore categorised as an event with no earth impact. That day, NOAA AR 2014 kept on acting rather nervous and produced several C-flares and a strong CME rapidly after the faint CME, directed to the east.
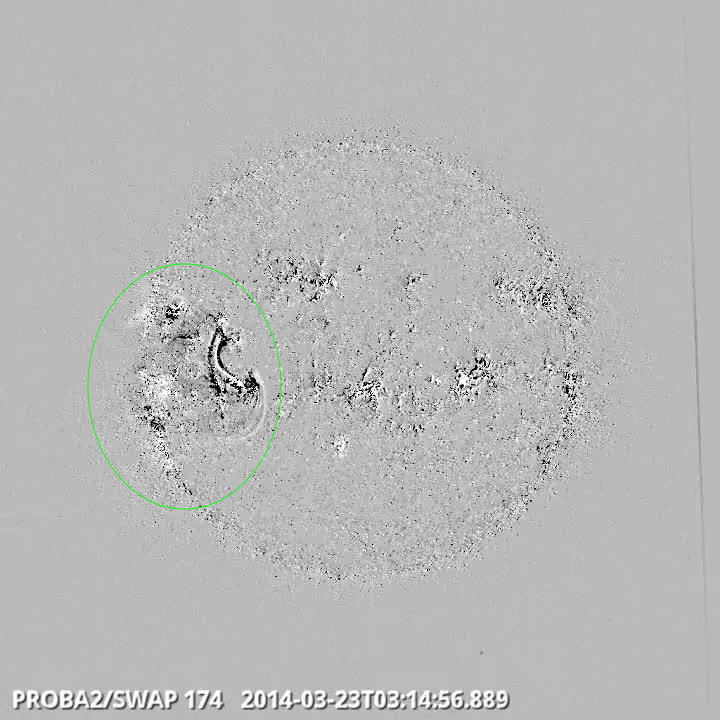
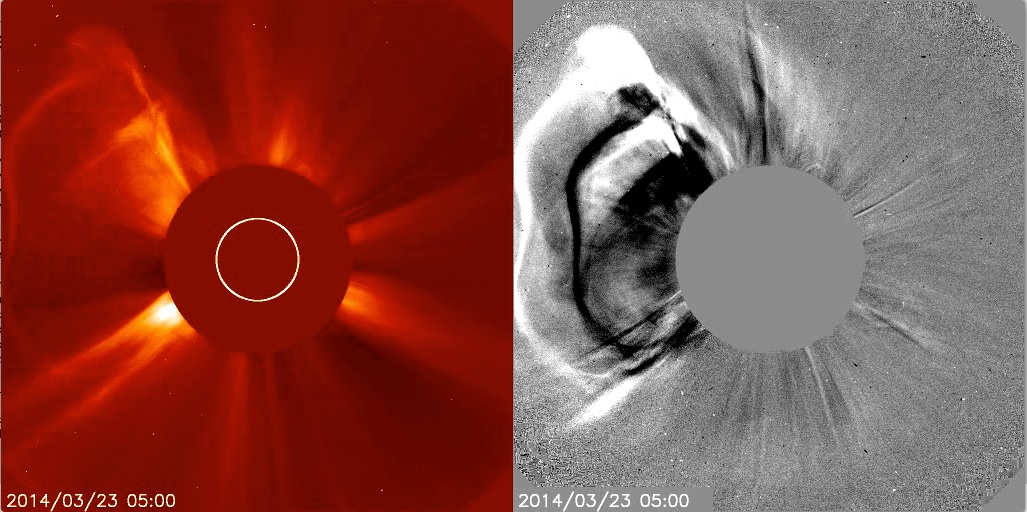
March 23, another EUV wave was detected in a series of SDO/AIA 194 images. A CME came into the FOV of LASCO/C2 at 03:36UT and had an estimated speed of around 750 km/s based on STEREO B/COR2 images. A shock did arrive at 19:25UT, March 25, the time of writing. The 10MeV proton flux was slightly increased on March 25, the particles were probably accelerated by the shock preceding the CME. More about this next week.
An equatorial coronal hole was seen at the central meridian on March 20.
Credits - Images and movies were taken from SDO (http://sdo.gsfc.nasa.gov/), SOHO/LASCO (http://sohowww.nascom.nasa.gov/) and SolarMonitor.org (http://www.solarmonitor.org)
| DAY | BEGIN | MAX | END | LOC | XRAY | OP | 10CM | TYPE | Cat | NOAA |
| 20 | 0342 | 0356 | 0408 | S14E35 | M1.7 | 1F | II/1IV/1III/1 | 86 | 2010 | |
| 22 | 0658 | 0702 | 0705 | S10W71 | M1.1 | 1F | 87 | 2011 |
| LOC: approximate heliographic location | TYPE: radio burst type |
| XRAY: X-ray flare class | Cat: Catania sunspot group number |
| OP: optical flare class | NOAA: NOAA active region number |
| 10CM: peak 10 cm radio flux |
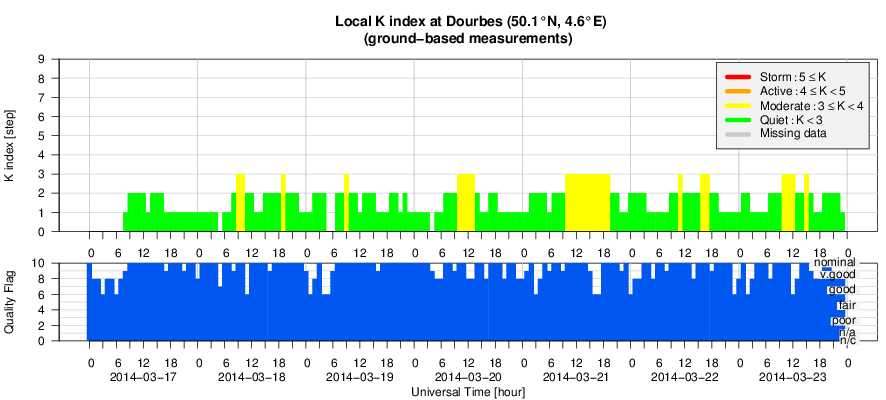
The first part of the week, ACE measured slow solar wind speeds, below 400 km/s. On March 21, the magnetic field grew gradually in strength followed by a gradual decrease from late March 22. The solar wind speed picked up gradually from March 22 up to around 500 km/s. Accordingly, the solar wind became less dense. Check the ACE graph below. This behaviour of the solar wind parameters is typically associated with the interaction of a slow and fast solar wind. The fast solar wind is possibly linked with the equatorial coronal hole that was at the central meridian on March 20. The geomagnetic impact was negligible. The highest value for Kp this week was 3 on March 21.
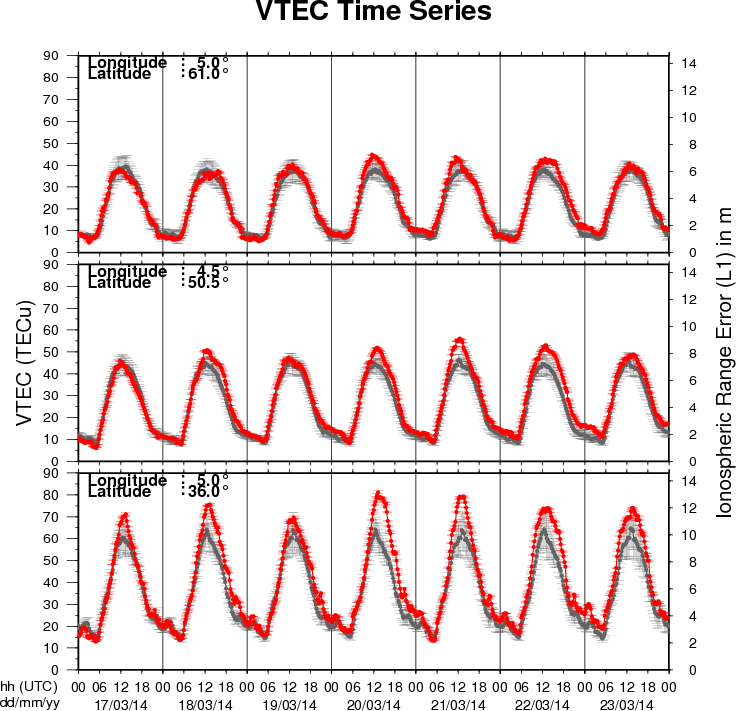
The figure shows the time evolution of the Vertical Total Electron Content (VTEC) (in red) during the last week at three locations:
a) in the northern part of Europe(N61°, 5°E)
b) above Brussels(N50.5°, 4.5°E)
c) in the southern part of Europe(N36°, 5°E)
This figure also shows (in grey) the normal ionospheric behaviour expected based on the median VTEC from the 15 previous days.
The VTEC is expressed in TECu (with TECu=10^16 electrons per square meter) and is directly related to the signal propagation delay due to the ionosphere (in figure: delay on GPS L1 frequency).
The Sun's radiation ionizes the Earth's upper atmosphere, the ionosphere, located from about 60km to 1000km above the Earth's surface.The ionization process in the ionosphere produces ions and free electrons. These electrons perturb the propagation of the GNSS (Global Navigation Satellite System) signals by inducing a so-called ionospheric delay.
See http://stce.be/newsletter/GNSS_final.pdf for some more explanations ; for detailed information, see http://gnss.be/ionosphere_tutorial.php
Start : 2014-03-30 - End : 2014-04-04
Biennial CCMC community workshops are designed as opportunities
for an in-depth exchange of experiences, opinions and needs between
model owners, science and operational users, agency representatives
and the CCMC staff.
Website:
http://ccmc.gsfc.nasa.gov/CCMC_Workshop_2014/index.php
Start : 2014-04-27 - End : 2014-05-02
The EGU General Assembly 2014 will bring together geoscientists
from all over the world to one meeting covering all disciplines of
the Earth, planetary and space sciences. The EGU aims to provide a
forum where scientists, especially early career researchers, can
present their work and discuss their ideas with experts in all
fields of geosciences.
http://www.spaceweather.eu/en/repository/show?id=491
http://www.spaceweather.eu/en/repository/show?id=492
http://www.spaceweather.eu/en/repository/show?id=493