
The Solar-Terrestrial Centre of Excellence (STCE) is a collaborative network of the Belgian Institute for Space Aeronomy, the Royal Observatory of Belgium and the Royal Meteorological Institute of Belgium.
|
Published by the STCE - this issue : 10 Apr 2014. The Solar-Terrestrial Centre of Excellence (STCE) is a collaborative network of the Belgian Institute for Space Aeronomy, the Royal Observatory of Belgium and the Royal Meteorological Institute of Belgium. |
| Archive of the newsletters | Subscribe to this newsletter by mail |
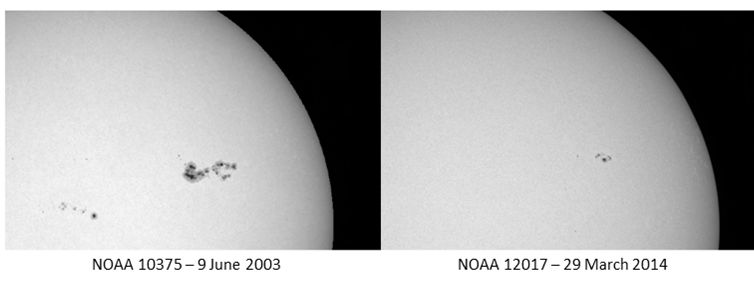
Usually, strong solar flares (X-class) are associated to big and complex sunspot groups, reaching maximum areas equivalent to 15 times the surface area of the Earth. That's why it was interesting to see that two recent X-class flares were produced in regions which were much smaller. Indeed, the X-class flares on 25 February and in particular on 29 March this year took place in sunspot regions that hardly reached an area similar to that of the Earth's surface (about 170MH, see Note 1).
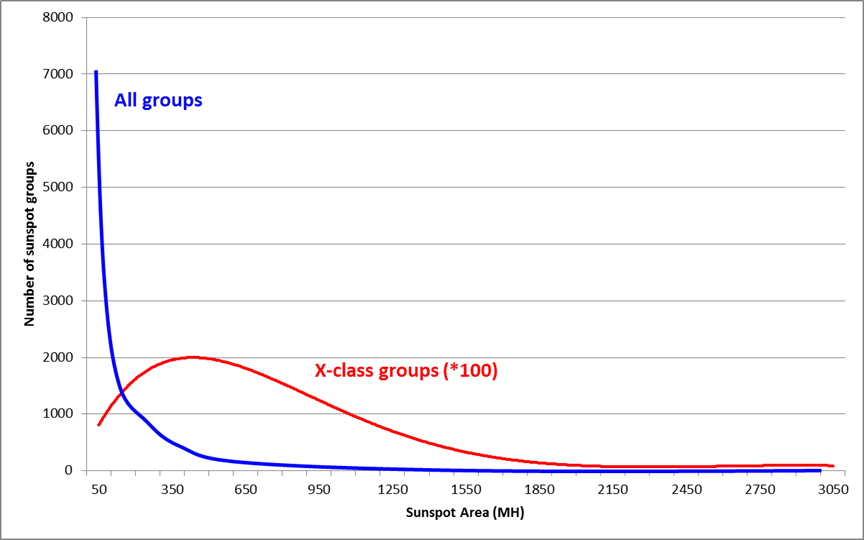
Since systematic GOES x-ray measurements began in 1976, more than 450 X-class flares have been recorded. These were produced by a bit more than 200 individual sunspot groups. According to the NOAA numbering, almost 11.000 sunspot groups were observed over those 38 years, so it is quite impressive that only 2% of the sunspot groups are responsible for all the eXtreme solar flares. Graph underneath shows per area bin (per 100MH) the smoothed number of sunspot groups (blue curve) as well as the smoothed number of groups producing an X-class flare (*100 for display purposes; red curve). Clearly, most of the X-class groups have a sunspot area several times that of the Earth.
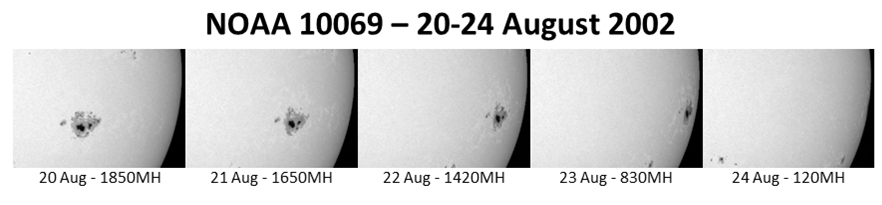
Nonetheless, about 10% of the X-class flares were produced in sunspot groups that had a surface area of 200MH or less. A quick review reveals that half of these are not really small, but have a sunspot area that actually does not reflect the true area. Indeed, when a large sunspot group is near the solar limb, it may take a day or more before it rotates completely in or out of view. If such a group happens to produce an X-class flare at that time, the associated sunspot area may seem very low. An example is big NOAA 10069 (imagery underneath), which produced an X3 flare while having nearly rounded the west limb early on 24 August 2002.
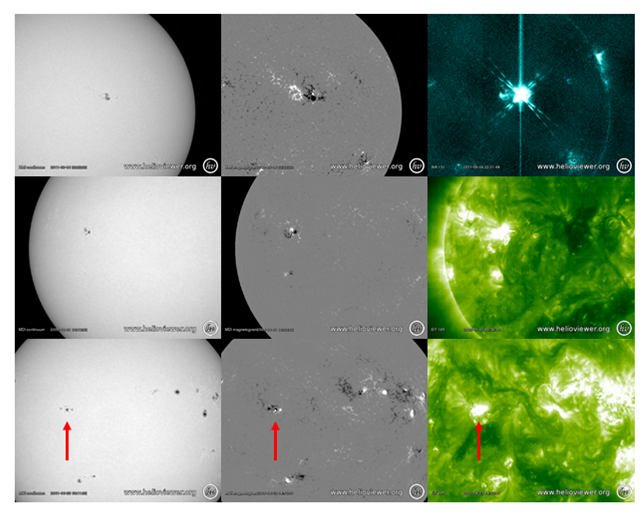
So, what's so special about the remaining two dozen of X-class flare producing groups that have a small size but are located relatively far (more than 10 degrees) from the solar limb? As usual, taking a look at the magnetogram of the sunspot group reveals already a lot. Often, within the small group, spots of opposite magnetic polarity (black and white) can be seen very close to each other, often within the same penumbra. These "delta" spots (see http://stce.be/news/222/welcome.html) are known to be the source of strong flaring activity, so space weather forecasters keep an eye on them. A few examples from this and previous solar cycle can be found underneath: NOAA 11283 (6 September 2011; 200MH; top row), NOAA 10715 (1 January 2005; 180MH; middle) and NOAA 9511 (23 June 2001; 110MH; bottom row).
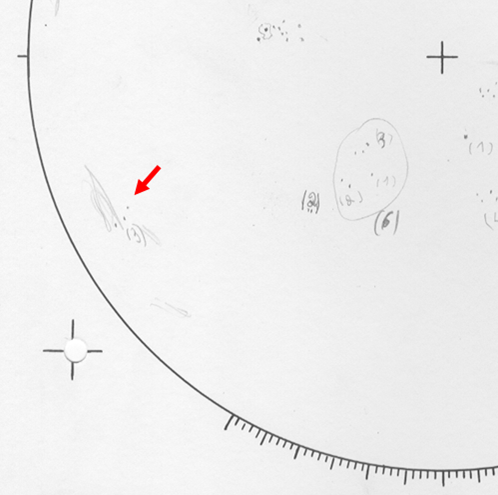
Note that delta spots do not explain all of the aberrant cases. Interaction with nearby sunspot groups, or when a group is in the growing/decaying phase of its life are just a few of the other possible reasons. One of the smallest groups that produced an X-class flare was NOAA 7012 on 26 January 1992. This isolated group measured hardly 10MH (ten!), consisting only of a few small sunspots (see annotated part of USET drawing underneath), and was visible for barely two days. Yet, it produced an X1-flare that was observed by the telescopes onboard the Yohkoh satellite in both x-ray and white light. In such flare events, there may be other physical processes at play.
Note 1 - The area of sunspot groups is expressed in "millionths of a solar hemisphere" (MH), with 1000MH corresponding to 3.043,7 million km2. The total area of the Earth corresponds to almost 170MH.
Credits - Images were taken from SDO (http://sdo.gsfc.nasa.gov/data/aiahmi/), SOHO (http://sohodata.nascom.nasa.gov/cgi-bin/data_query), USET (http://www.sidc.oma.be/uset/index.php), and (J)Helioviewer (http://helioviewer.org/). USAF/NOAA sunspot data are available at NASA/MSFC (http://solarscience.msfc.nasa.gov/greenwch.shtml), and x-ray flare data at NOAA/NGDC (http://www.ngdc.noaa.gov/stp/space-weather/solar-data/solar-features/solar-flares/x-rays/goes/).
Solar activity has been moderate in the past week. The highlights were two M-class flares, a filament eruption and a strong C-class flare.
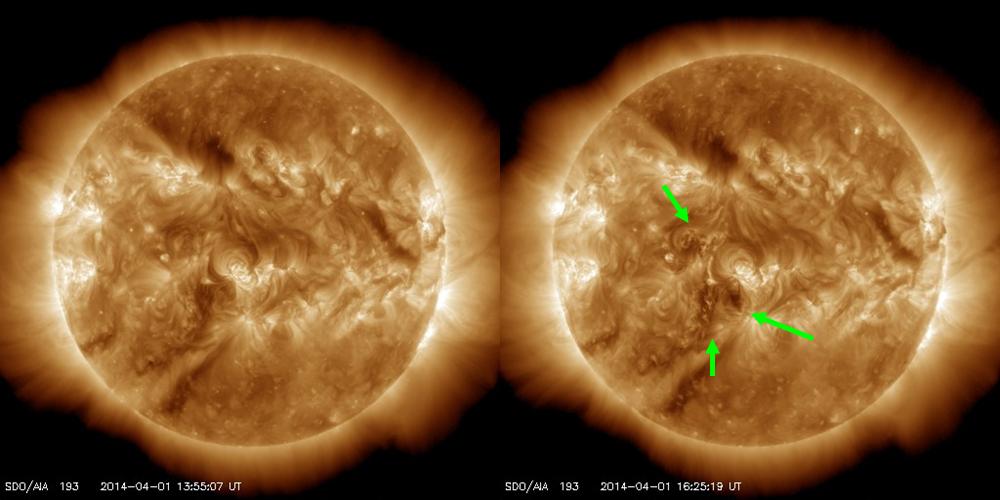
The first M-class event had its source in active region (AR) NOAA 2014 close to the west limb (M1.4 on 31 March, peaking at 08:07UT). It was associated to a relatively slow coronal mass ejection (CME). On 1 April, a small filament erupted to the East/South-East of AR NOAA 2021 which was close to the central meridian. SDO/AIA 193 images underneath show the area before (13:55UT) and after (16:25UT) the event, with a few subtle changes highlighted. The filament eruption was accompanied by a slow moving CME with an Earth-directed component.
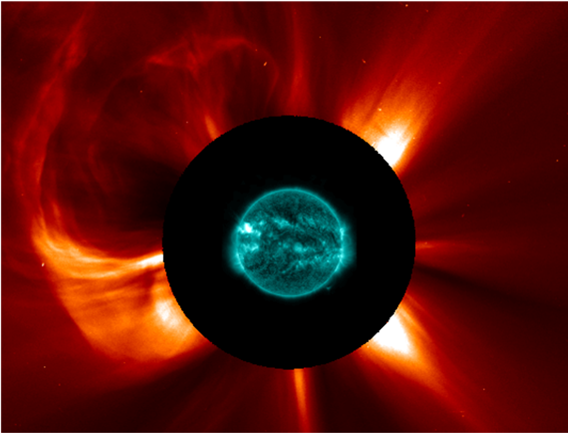
The second M-class event took place in active region NOAA 2027. The M6.5 flare peaked at 14:05UT on 2 April. It was accompanied by an EUV coronal wave, a strong radio burst (observed with the Humain solar radio telescope), and a fast halo CME (about 1500km/s). The image underneath combines the CME (SOHO/LASCO C2) with the flare site (SDO/AIA 131) as seen around 14:38UT. The very same region produced a C8.3 flare peaking at 13:48UT on 4 April. It was also accompanied by an EUV coronal wave and a partial halo CME.
| DAY | BEGIN | MAX | END | LOC | XRAY | OP | 10CM | TYPE | Cat | NOAA |
| 31 | 0720 | 0807 | 0818 | S15W77 | M1.4 | SF | IV/1 | 92 | 2014 | |
| 02 | 1318 | 1405 | 1428 | N14E53 | M6.5 | 2B | 3700 | II/1IV/2 | 9 | 2027 |
| LOC: approximate heliographic location | TYPE: radio burst type |
| XRAY: X-ray flare class | Cat: Catania sunspot group number |
| OP: optical flare class | NOAA: NOAA active region number |
| 10CM: peak 10 cm radio flux |
The level of solar activity was low to moderate this week. Two M-flares were recorded, one on Monday from AR12014 (M1.4), and one on Wednesday from AR 12027 (M6.5).
In order to view the activity of this week in more detail, we suggest to go to the following website from which all the daily (normal and difference) movies can be accessed: http://proba2.oma.be/ssa.
This page also lists the recorded flaring events.
A weekly overview movie can be found here: http://proba2.oma.be/swap/data/mpg/movies/WeeklyReportMovies/WR210_Mar31_Apr06/weekly_movie_2014_03_31.mp4 (SWAP week 210). Occasionally in this movie, the Sun is not centered due to off-point campaigns (twice).
Details about some of this week’s events can be found further below.

M1.4 flare Eruption, West limb @ 08:27 - SWAP difference image
Find a movie of the event here: http://proba2.oma.be/swap/data/mpg/movies/WeeklyReportMovies/WR210_Mar31_Apr06/20140331_EruptionWestLimb_0827_SWAPdiff.mp4 (SWAP difference movie)
The expelled material could be followed up to the edge of the SWAP field of view.
A cavity/cusp-like feature can be seen at relatively high altitude above the North Western Limb. The feature is hard to see, but definitely present.
We suggest having a look at the SWAP daily movie here: http://proba2.oma.be/swap/data/mpg/movies/WeeklyReportMovies/WR210_Mar31_Apr06/20140401_swap_movie_offpoint.mp4.
Note that the Sun is not centered in this movie, because of an off-pointing campaign, lasting the whole day.
Such features can be seen sporadically, but *not* at such a high altitude.
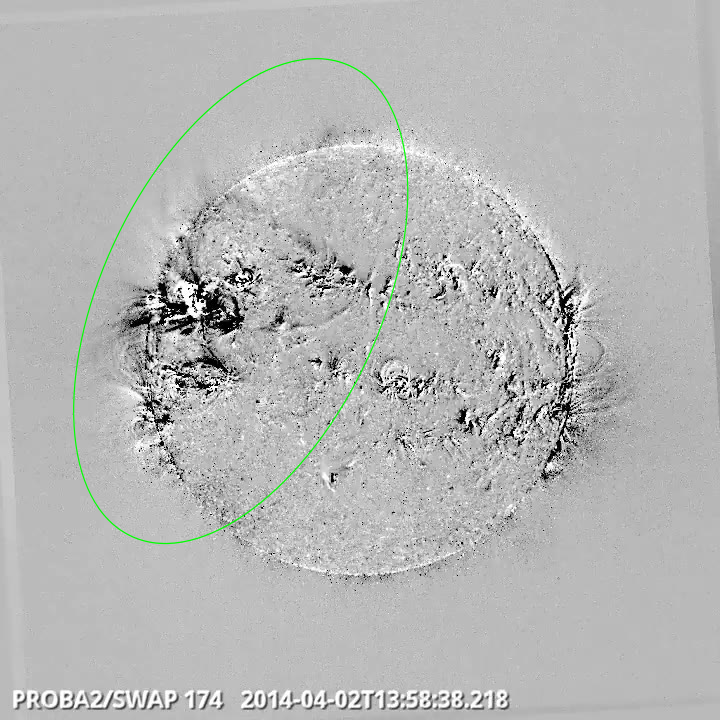
M6.5 flare Eruption, North East Quadrant - AR12027 @ 13:58 - SWAP difference image
Find a movie of the event here: http://proba2.oma.be/swap/data/mpg/movies/WeeklyReportMovies/WR210_Mar31_Apr06/20140402_M65EruptionNElimb_1358_SWAPdiff_annotated.mp4 (SWAP difference movie)
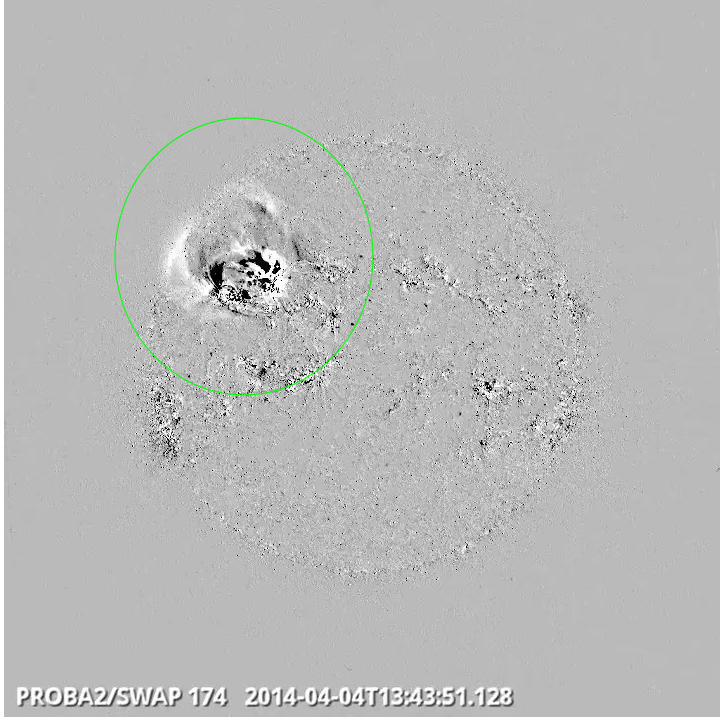
C8.3 flare Eruption, North East Quadrant - AR12027 @ 13:43 - SWAP difference image
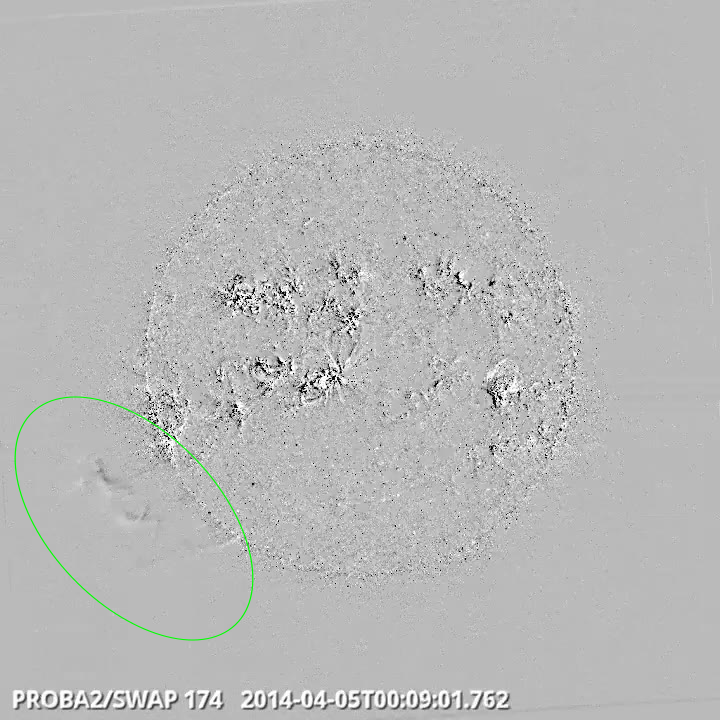
Prominence Eruption, South East Limb @ 00:09 - SWAP difference image
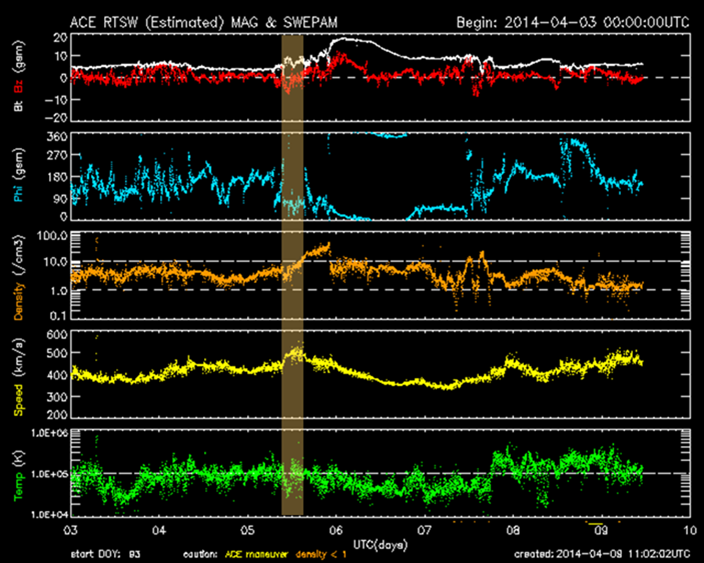
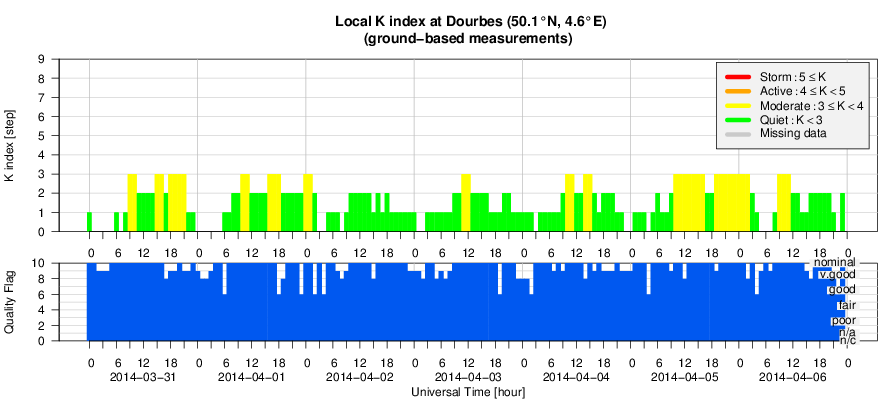
Geomagnetic activity was mostly quiet during the week. Active conditions (K=4) were observed at planetary levels on 5 April from 9 to 15 UT in response to the arrival around 09:30UT that day of a moderate shock associated to the CMEs of 1-2 April. An ICME signature was observed subsequently on 5 and 6 April. In image underneath, the period with active geomagnetic conditions (light orange bar) has been overlaid on the solar wind parameters as measured by the ACE spacecraft.
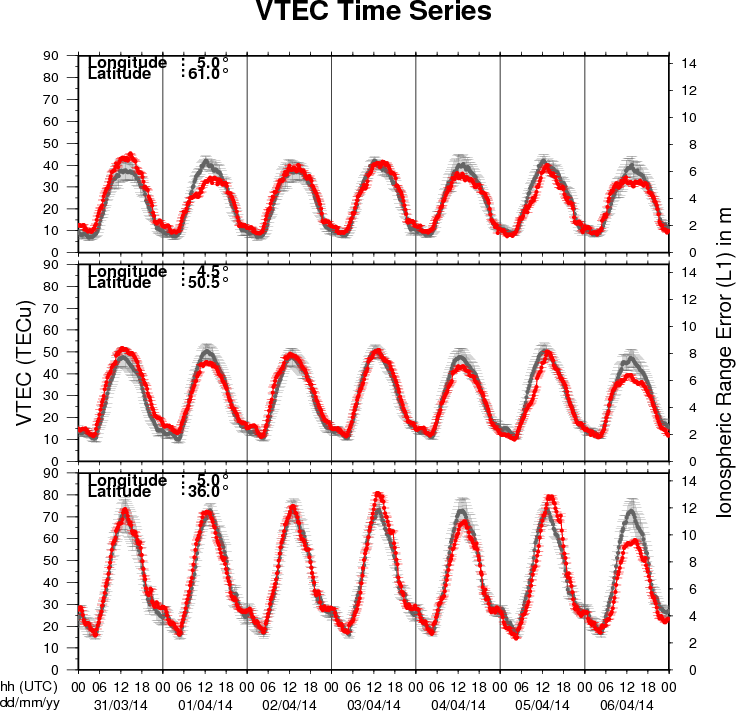
The figure shows the time evolution of the Vertical Total Electron Content (VTEC) (in red) during the last week at three locations:
a) in the northern part of Europe(N61°, 5°E)
b) above Brussels(N50.5°, 4.5°E)
c) in the southern part of Europe(N36°, 5°E)
This figure also shows (in grey) the normal ionospheric behaviour expected based on the median VTEC from the 15 previous days.
The VTEC is expressed in TECu (with TECu=10^16 electrons per square meter) and is directly related to the signal propagation delay due to the ionosphere (in figure: delay on GPS L1 frequency).
The Sun's radiation ionizes the Earth's upper atmosphere, the ionosphere, located from about 60km to 1000km above the Earth's surface.The ionization process in the ionosphere produces ions and free electrons. These electrons perturb the propagation of the GNSS (Global Navigation Satellite System) signals by inducing a so-called ionospheric delay.
See http://stce.be/newsletter/GNSS_final.pdf for some more explanations ; for detailed information, see http://gnss.be/ionosphere_tutorial.php
Start : 2014-04-27 - End : 2014-05-02
The EGU General Assembly 2014 will bring together geoscientists
from all over the world to one meeting covering all disciplines of
the Earth, planetary and space sciences. The EGU aims to provide a
forum where scientists, especially early career researchers, can
present their work and discuss their ideas with experts in all
fields of geosciences.
Start : 2014-06-10 - End : 2014-06-11
The STCE workshop 'Inter-Calibration and Degradation of EUV
Instruments' aims at understanding the differences observed between
the various instruments observing in the SXR-EUV range and at
analyzing the ageing effects that affect their results. It targets
imagers as well as spectrometers and photometers.
The workshop will be followed by two days of working sessions
(June 12-13) organized by the Solar EUV Irradiance Working Group
(also supported by the STCE). These working sessions are in the
continuity of similar events organized in 2011, 2012 and 2013, but
they are open to new participants and you are welcome to join if
you are interested.
Website:
http://www.stce.be/euvworkshop2014/
Start : 2014-06-19 - End : 2014-06-20
During the summer of 2014 DTU Space will host the 3rd Swarm
Science Meeting, sponsored by the European Space Agency, ESA
. This meeting will take place at
the IDA Conference Centre in Copenhagen on June 19th to 20th 2014
and is open to the science community at large.
Website:
http://congrexprojects.com/2014-events/Swarm/home
http://www.spaceweather.eu/en/repository/show?id=491
http://www.spaceweather.eu/en/repository/show?id=493
The STCE Annual Report 2012 is a compilation of the activities done in 2012 within the frame of the Solar-Terrestrial Centre of Excellence (STCE). This report continues the style from the previous edition. Hence, as it is targeting a more general public, it presents only a selection of the 2012-activities in easy-to-digest summaries. These summaries emphasize the intense collaboration between the institutes at the Space Pole, as well as with our external partners. We hope you enjoy this report, which features articles on the evolution of the solar activity, the 9th European Space Weather Week, PROBA2, Integrated Water Vapor observations, SIMBA the nanosatellite, user applications such as STAFF, LIDAR, and ionospheric models, and much more... Happy reading!
http://www.spaceweather.eu/en/repository/show?id=494
http://www.spaceweather.eu/en/repository/show?id=492
http://www.spaceweather.eu/en/repository/show?id=497
http://www.spaceweather.eu/en/repository/show?id=498