
The Solar-Terrestrial Centre of Excellence (STCE) is a collaborative network of the Belgian Institute for Space Aeronomy, the Royal Observatory of Belgium and the Royal Meteorological Institute of Belgium.
|
Published by the STCE - this issue : 19 Jun 2014. The Solar-Terrestrial Centre of Excellence (STCE) is a collaborative network of the Belgian Institute for Space Aeronomy, the Royal Observatory of Belgium and the Royal Meteorological Institute of Belgium. |
| Archive of the newsletters | Subscribe to this newsletter by mail |
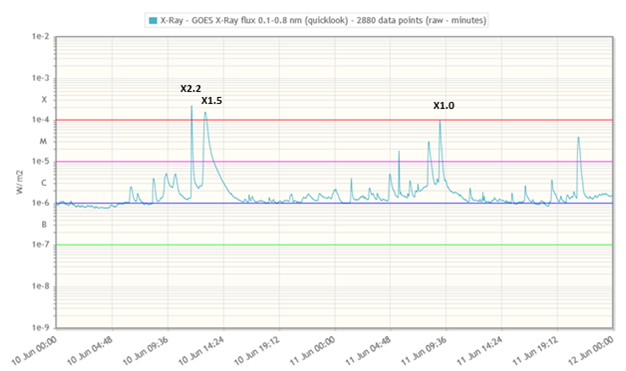
On 10 and 11 June, the not so big but complex sunspot group NOAA 2087 produced three X-class flares in less than 24 hours. On 10 June, there was an X2.2 peaking at 11:42UT, followed by an X1.5 at 11:52UT. On 11 June, an X1.0 peaked at 09:06UT. This brings the X-class flare counter for the current solar cycle to 34. The associated coronal mass ejections (CME) were not directed to Earth, though from the second CME a glancing blow was expected. In the end, no obvious CME-signature was observed in the solar wind data.
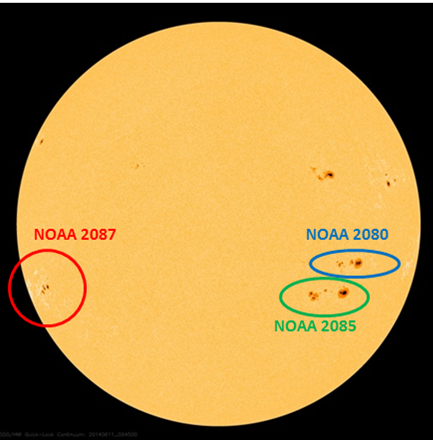
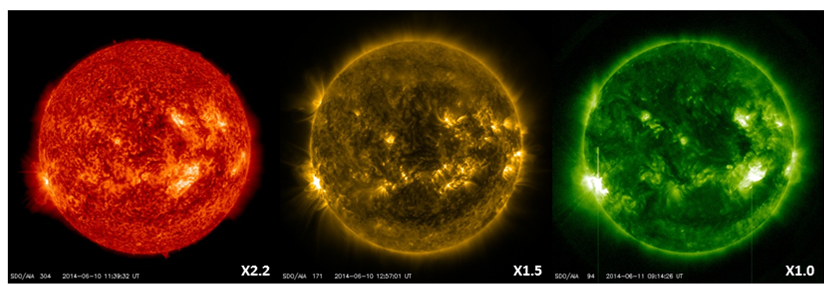
The first movie at http://youtu.be/ZL1kfmcYk3s shows last week's active regions NOAA 2080, 2085 and 2087 and their flaring activity in successively higher temperatures: white light (photosphere), transition region (SDO/AIA 304; +/- 80.000 degrees), lower corona (AIA 171; +/- 650.000 degrees), and hot corona (AIA 094; multi-million degrees). It spans a five day period starting 9 June. NOAA 2087 is appearing from behind the southeast limb (lower left), while NOAA 2080 and 2085 are heading for the southwest limb (lower right). All three regions were the source of M-class ("medium") flares over this period.
The second movie at http://youtu.be/SlTz4oNaP6M focuses on the first two X-class flares from NOAA 2087 starting with a combination movie of the aforementioned SDO/AIA filters. The respective peaks were separated by only 70 minutes. A quick survey of the GOES database reveals this is not so unusual, with every solar cycle having a handful of this kind of flare pairs. The smallest time delay seems to have occurred on 18 August 1979, when only 26 minutes separated the peaks of an X1 and an X6 flare. NOAA 2087's X2 flare was also an impulsive event, barely lasting 8 minutes. Since the GOES-measurements started in 1976, only 21 X-class events did not last 10 minutes (not including the X2 flare).
Scientists from the PROBA2 Science Centre (http://proba2.oma.be/ssa) were able to observe these two X-class flares with imagery (SWAP) and data (LYRA). LYRA observes solar flares just as GOES, but in extreme ultraviolet (EUV) and thus in slightly different wavelengths (LYRA "blue" and "grey" channels). These channels can be calibrated such that they can be compared to the GOES data. Sometimes, LYRA slightly underestimates the solar flares as was the case with the first flare (X2.2). This is related to the formula with which the proxies are calculated, and not to the temporal solution. Both the LYRA and GOES curves peak about 4 minutes after the onset of the first flare (X2.2).

Interestingly, LYRA does *not* underestimate the second flare (X1.5). This is because there is obviously much "cooler" (EUV) plasma involved than in the first flare. The first flare appears to consist mainly of "hot" (soft x-ray) plasma, which is observed by GOES as well as by LYRA. It appears to be impulsive, rises quickly and drops almost as quickly. The second flare keeps on rising in LYRA, after GOES has already peaked, about 3 minutes longer. This is expected, because LYRA also observes in spectral regions in which GOES does not observe (somewhat longer wavelengths).
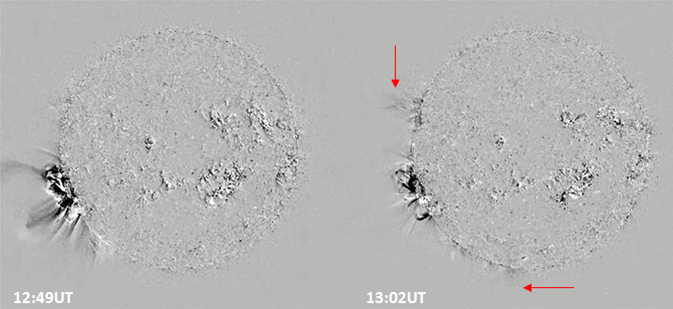
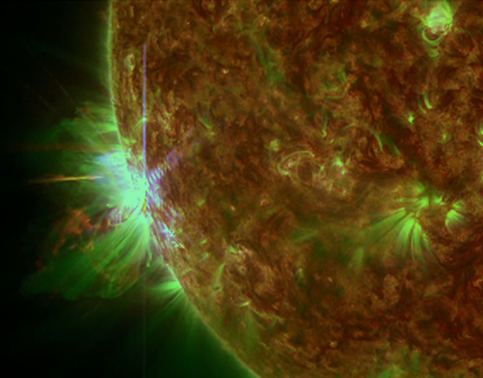
The SWAP instrument, an EUV telescope, onboard PROBA2 recorded an off-limb EIT wave (image above; see the news item at http://stce.be/news/241/welcome.html for more details on these features). In the difference movie (one image subtracted from the previous one), the disturbance seems to propagate through the corona at an average speed of about 400-500 km/s.
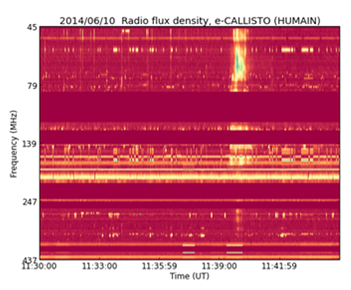
The flaring activity was also recorded in the radio-frequencies. The radioastronomy observatory at Humain recorded a strong radio burst for the first X-class flare, but nothing obvious for the second one, consistent with reports from other observatories (NOAA,…).
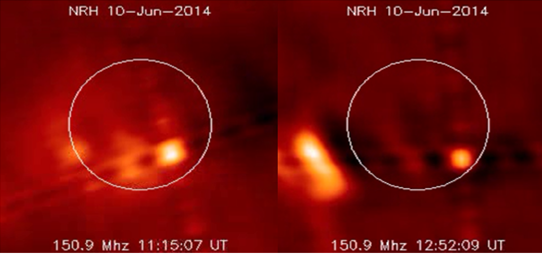
The Nancay RadioHeliograph (http://www.obs-nancay.fr/?lang=en) showed the radio-emission from both flares at 150.9 MHz. The imagery indicates that the radio-emission associated to the first flare had a relatively stationary source, whereas for the second flare this radio-emission seems to be moving away from the Sun.
Credits – Imagery and data were taken from the Humain Radioastronomy Station (http://www.sidc.be/humain/index.php), PROBA2/SWAP and LYRA (http://proba2.oma.be/ssa), the Nancay RadioHeliograph (http://bass2000.obspm.fr/home.php?lang=en), GOES (http://www.swpc.noaa.gov/ftpmenu/lists/xray.html), SDO (http://sdo.gsfc.nasa.gov/data/aiahmi/), and (J)Helioviewer (http://helioviewer.org/).
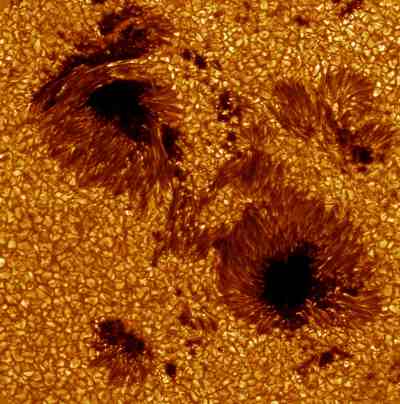
After a trial period, the zooniverse online project Sunspotter was launched. Essentially a game of hot-or-not for sunspot data; you are shown two images of sunspot groups and asked which is more complex. That might sound odd at first, but it's really quite easy when you try it - and extremely useful in helping astronomers understand the physics of our star, the Sun.
Dan Ryan, a scientist at the moment working at the STCE worked on the project along with the team at Trinity College Dublin. He is very enthusiastic about it:
"During the trial, the results have been validated and the science works! A new batch of more than 200,000 images has been added to the site and everyone can help rank sunspots in order of complexity. It will help scientists better understand the pre-conditions of solar flares, a thus far very tricky problem."
Happy classifying at Sunspotter!
Solar flare activity fluctuated between low and moderate during the week.
In order to view the activity of this week in more detail, we suggest to go to the following website from which all the daily (normal and difference) movies can be accessed: http://proba2.oma.be/ssa
This page also lists the recorded flaring events.
A weekly overview movie can be found here (SWAP week 220).
http://proba2.oma.be/swap/data/mpg/movies/WeeklyReportMovies/WR220_Jun09_Jun15/weekly_movie_2014_06_09.mp4
Details about some of this week's events, can be found further below.
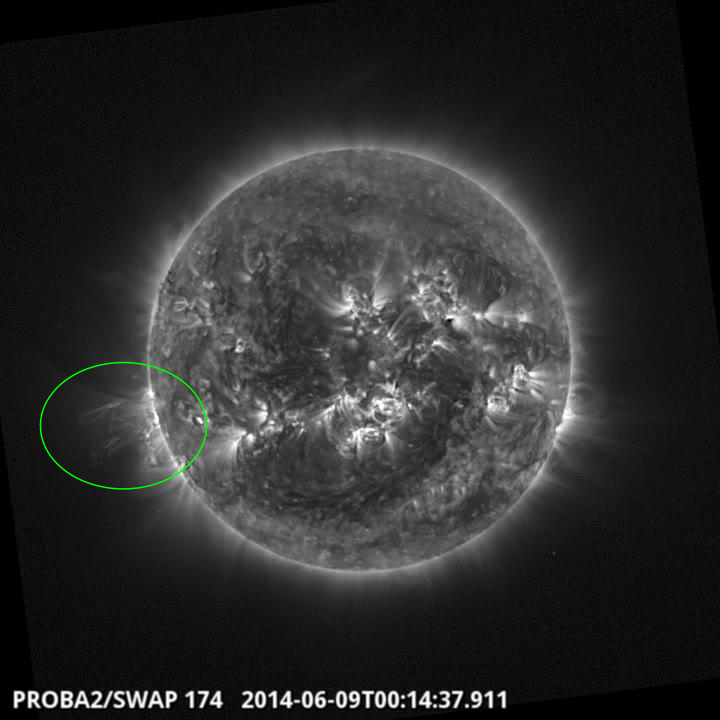
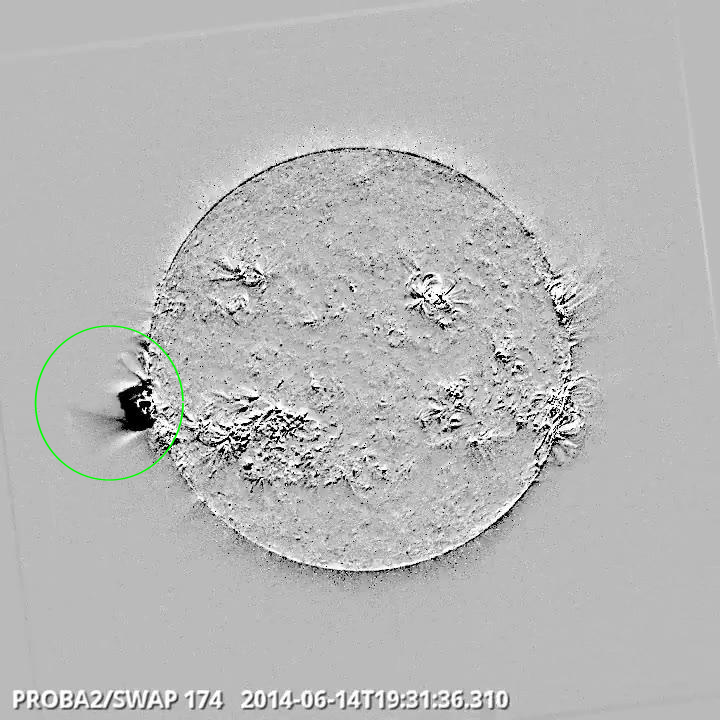
Eruption on the east limb @ 00:14 SWAP image
Find a movie of the events here (SWAP movie)
http://proba2.oma.be/swap/data/mpg/movies/20140609_swap_movie.mp4
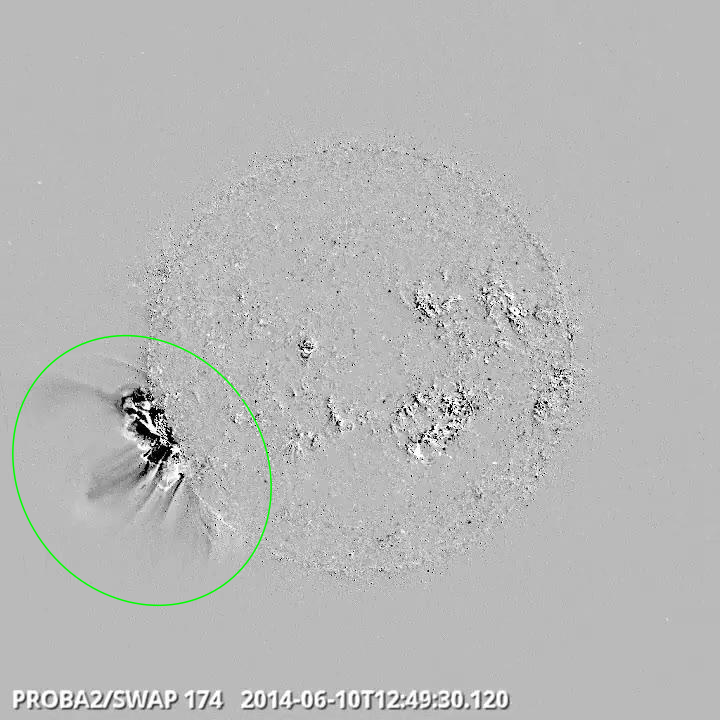
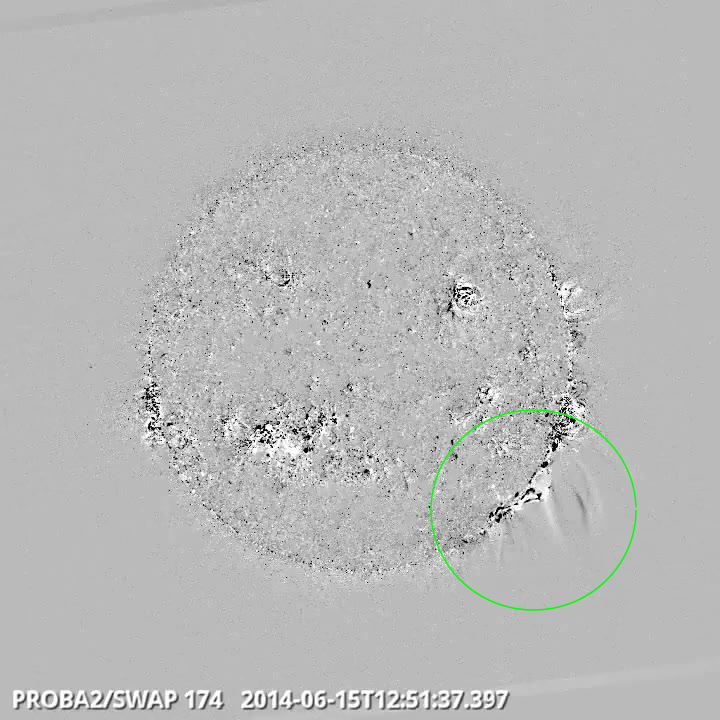
Eruption on the east limb @ 12:49 SWAP difference image
Find a movie of the events here (SWAP difference movie)
http://proba2.oma.be/swap/data/mpg/movies/20140610_swap_diff.mp4
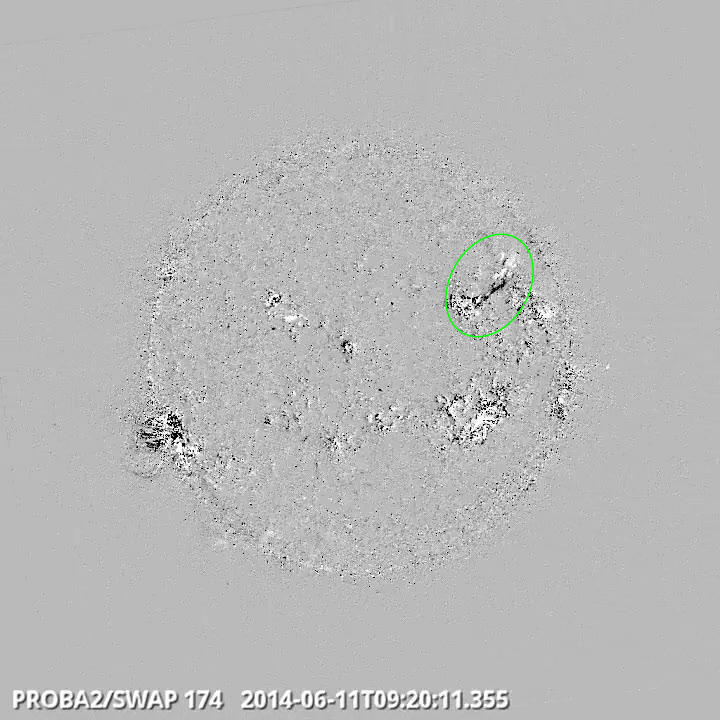
Eruption on the north west quad @ 09:20 SWAP difference image
Find a movie of the event here (SWAP difference movie)
http://proba2.oma.be/swap/data/mpg/movies/20140611_swap_diff.mp4
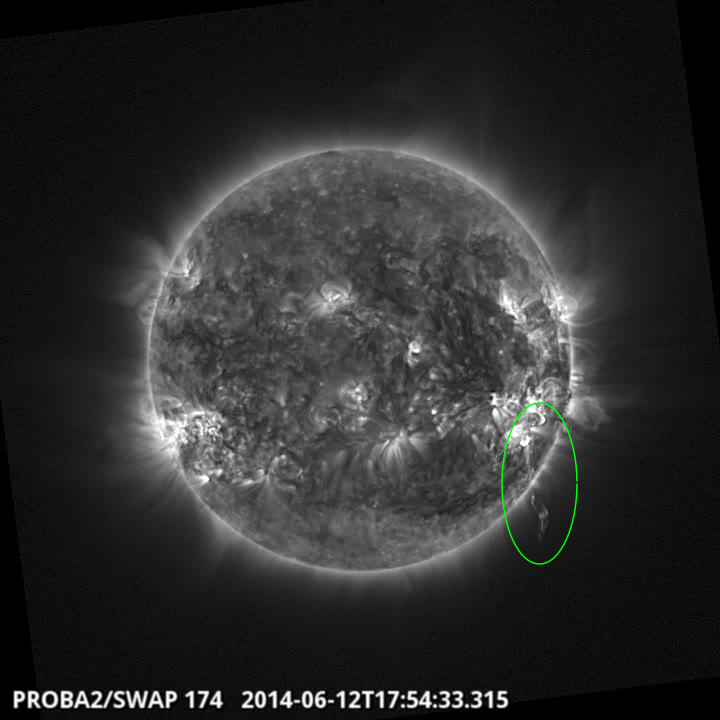
Eruption on the south west quad @ 17:54 SWAP image
Find a movie of the event here (SWAP movie)
http://proba2.oma.be/swap/data/mpg/movies/20140612_swap_movie.mp4
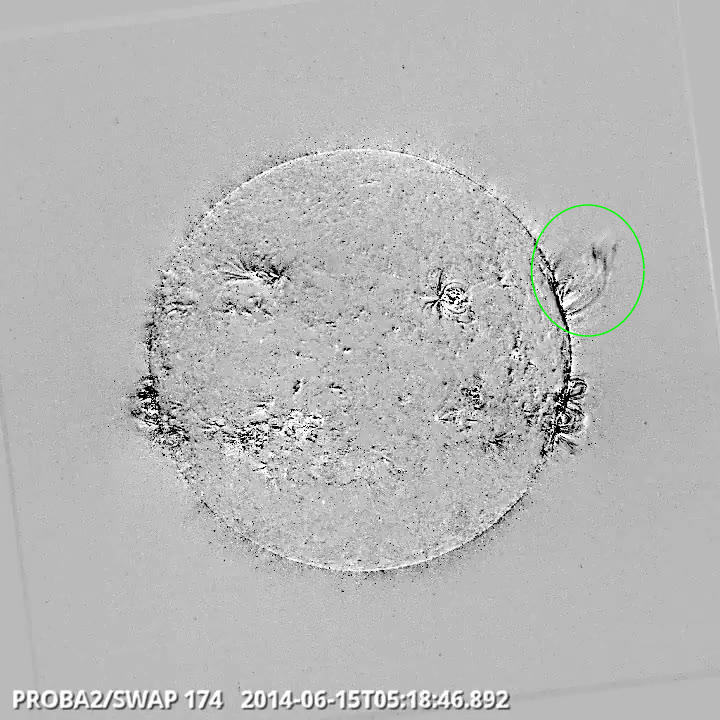
Eruption on the west limb @ 05:18 SWAP difference image
Find a movie of the events here (SWAP difference movie)
http://proba2.oma.be/swap/data/mpg/movies/20140615_swap_diff.mp4
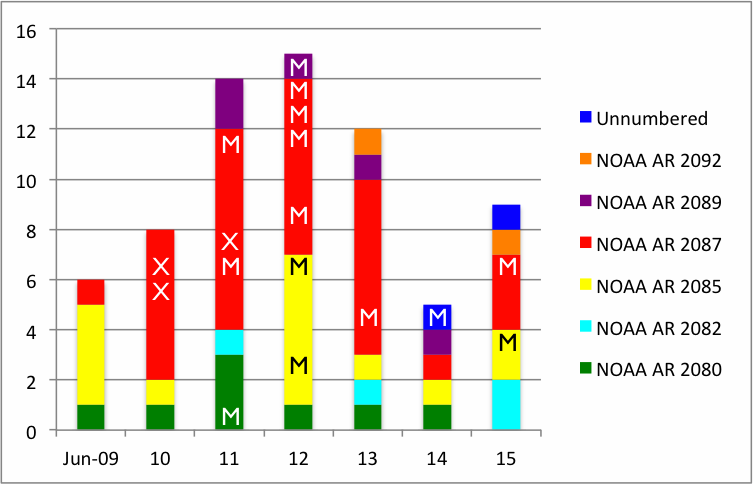
During this week 3 X-class flares, 14 M-class flares and 52 C-class flares were reported by GOES. The solar flaring activity was dominated by the Catania sunspot group 81 (NOAA AR 2087). Its photospheric magnetic field was most of the time labeled as a beta-gamma-delta configuration. Two flares (M1.4 and C3.2) were associated with an active region (blue color in the graph below) at that moment still behind the east limb.
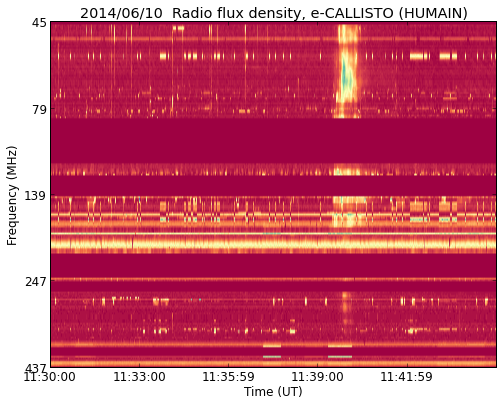
The strongest flare of the week was the impulsive X2.2 flare observed on June 10 (peak at 11:42 UT). The flare originating from the Catania sunspot group 81 (NOAA AR 2087), and was associated with a type II radio burst. Such radio bursts are caused by shocks traveling through the lower solar corona - more on http://sidc.oma.be/humain/science.php
The graph below is a color coded intensity plot: the color indicates how strong the radio flux is at a certain frequency and at a certain time. Below 139 MHz (upper half of the plot), you see a vertical yellow/green cloud. The intensity drift from high to lower frequencies gives information about the speed of the shock which was estimated to be about 890 km/s. This coronal shock wave was associated with a rather narrow (angular width of about 70 degrees), not Earth directed CME.
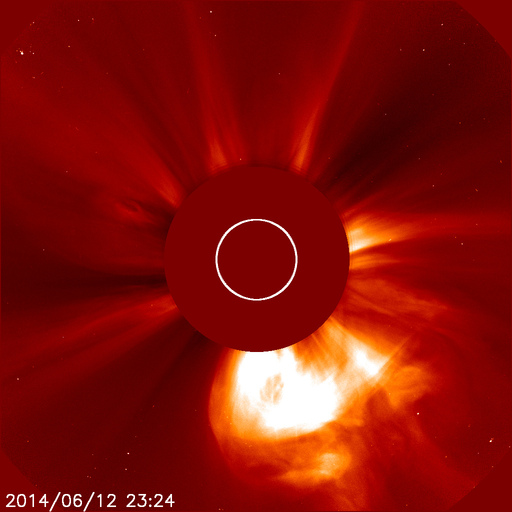
The same Catania sunspot group 81 (NOAA AR 2087) was also source of the second strongest flare this week: a long duration X1.5 flare with x-ray peak at 12:52 UT on that same day. The event was associated with a coronal dimming, an EIT wave and a full halo CME. The CME was first seen in the SOHO LASCO C2 field of view at 13:25 UT and had a projected plane of the sky speed of about 1100 km/s. The majority of the CME mass was ejected eastward of the Sun-Earth line. However, a glancing blow at Earth was possible and predicted for June 13.
By the end of the week, the flaring activity decreased.
A partial halo CME was associated with a complex long duration M3.1 flare (peaking at 22:16 UT) on June 12 originating from the Catania sunspot group 76 (NOAA AR 2085). The CME was first seen in the SOHO/LASCO C2 field of view at 22:12 UT. The CME had an angular width of around 150 degrees and a projected plane of the sky speed of 548 km/s (as reported by the CACTUS software). The bulk of the CME mass was ejected south-west from the Sun-Earth line.
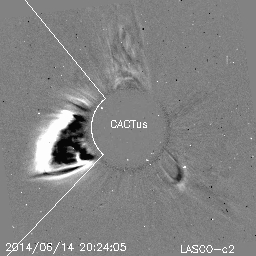
On June 14, a CME with angular width of around 100 degrees and a projected plane of the sky speed of 583 km/s was reported by CACTus. The plasma was ejected eastward of the Sun-Earth Line. This event is probably related to the M1.4 flare linked to the unnumbered source region (see first paragraph).
A narrow, small equatorial coronal hole reached the central meridian late on June 08 - early on June 9. Another small low latitude coronal hole reached the central meridian on June 12.
| DAY | BEGIN | MAX | END | LOC | XRAY | OP | 10CM | TYPE | Cat | NOAA |
| 10 | 1136 | 1142 | 1144 | S15E80 | X2.2 | SF | 1400 | III/2II/1 | 2087 | |
| 10 | 1236 | 1252 | 1303 | S17E82 | X1.5 | 1F | 530 | IV/2V/1VI/2 | 2087 | |
| 11 | 0530 | 0534 | 0536 | S12W35 | M1.8 | SN | 100 | III/1 | 69 | 2080 |
| 11 | 0800 | 0809 | 0815 | S14E68 | M3.0 | 2B | 130 | IV/1III/1VI/1 | 81 | 2087 |
| 11 | 0859 | 0906 | 0910 | S18E65 | X1.0 | SF | 190 | V/2III/2 | 81 | 2087 |
| 11 | 2053 | 2103 | 2110 | S21E58 | M3.9 | SF | 420 | V/3III/1 | 81 | 2087 |
| 12 | 0414 | 0421 | 0426 | S16E55 | M2.0 | SF | 89 | III/3 | 81 | 2087 |
| 12 | 0923 | 0937 | 0942 | S25W53 | M1.8 | 1B | 87 | 76 | 2085 | |
| 12 | 1014 | 1021 | 1027 | S20E52 | M2.7 | 1F | III/2 | 81 | 2087 | |
| 12 | 1803 | 1813 | 1823 | S19E48 | M1.3 | SF | 31 | 81 | 2087 | |
| 12 | 1956 | 2003 | 2005 | N17E5 | M1.1 | SF | 82 | 2089 | ||
| 12 | 2101 | 2113 | 2119 | S22E49 | M1.0 | SF | VI/1 | 81 | 2087 | |
| 12 | 2134 | 2216 | 2252 | S20W55 | M3.1 | 1F | II/3 | 76 | 2085 | |
| 13 | 0749 | 0756 | 0759 | S18E40 | M2.6 | 1N | II/2 | 81 | 2087 | |
| 14 | 1923 | 1929 | 1934 | M1.4 | III/2 | |||||
| 15 | 1110 | 1139 | 1150 | M1.1 | 76 | 2085 | ||||
| 15 | 2350 | 0001 | 0017 | M1.0 | 81 | 2087 |
| LOC: approximate heliographic location | TYPE: radio burst type |
| XRAY: X-ray flare class | Cat: Catania sunspot group number |
| OP: optical flare class | NOAA: NOAA active region number |
| 10CM: peak 10 cm radio flux |
On June 9, the Earth was under the influence of a coronal hole wind stream of which the speed was in the decaying phase. The speed decreased from 600 km/s on June 8 to about 400 km/s in the evening of June 9.
This coronal hole influence was immediately followed by another coronal hole wind stream probably associated with the small equatorial coronal hole that reached the central meridian early on June 09. The solar wind speed profile was similar with an increase again to 600 km/s on June 11.
None of the shocks or CMEs mentioned in the section Solar Activity arrived at the Earth.
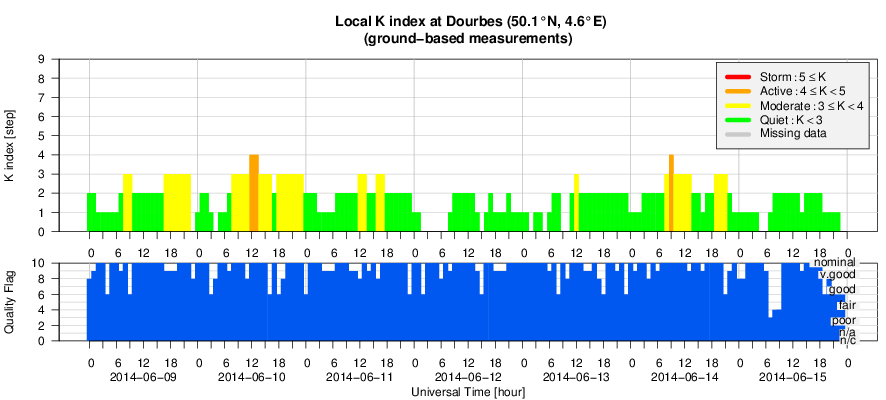
The Kp index was three at most, this occurred on June 11 (one 3-hours time interval) and on June 14 (two 3-hours time interval).
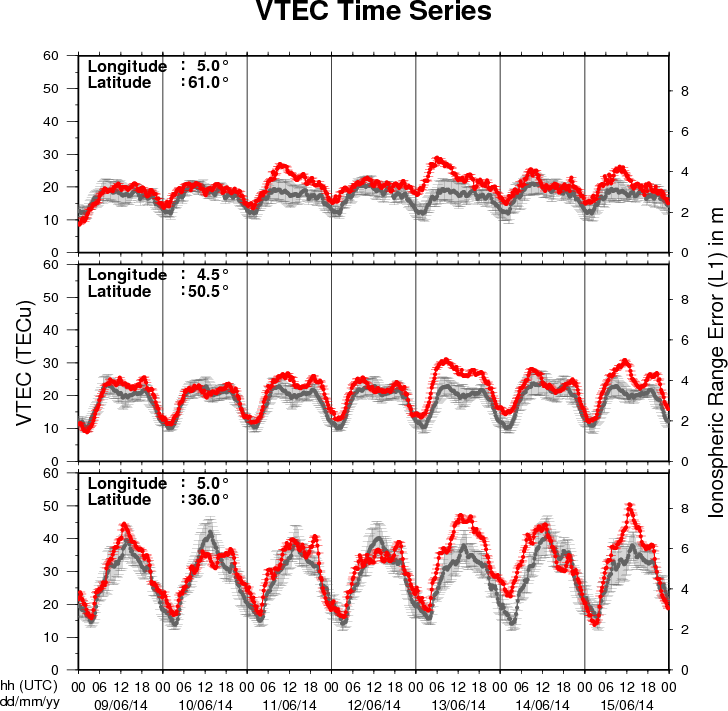
The figure shows the time evolution of the Vertical Total Electron Content (VTEC) (in red) during the last week at three locations:
a) in the northern part of Europe(N61°, 5°E)
b) above Brussels(N50.5°, 4.5°E)
c) in the southern part of Europe(N36°, 5°E)
This figure also shows (in grey) the normal ionospheric behaviour expected based on the median VTEC from the 15 previous days.
The VTEC is expressed in TECu (with TECu=10^16 electrons per square meter) and is directly related to the signal propagation delay due to the ionosphere (in figure: delay on GPS L1 frequency).
The Sun's radiation ionizes the Earth's upper atmosphere, the ionosphere, located from about 60km to 1000km above the Earth's surface.The ionization process in the ionosphere produces ions and free electrons. These electrons perturb the propagation of the GNSS (Global Navigation Satellite System) signals by inducing a so-called ionospheric delay.
See http://stce.be/newsletter/GNSS_final.pdf for some more explanations ; for detailed information, see http://gnss.be/ionosphere_tutorial.php