
The Solar-Terrestrial Centre of Excellence (STCE) is a collaborative network of the Belgian Institute for Space Aeronomy, the Royal Observatory of Belgium and the Royal Meteorological Institute of Belgium.
|
Published by the STCE - this issue : 10 Jul 2014. The Solar-Terrestrial Centre of Excellence (STCE) is a collaborative network of the Belgian Institute for Space Aeronomy, the Royal Observatory of Belgium and the Royal Meteorological Institute of Belgium. |
| Archive of the newsletters | Subscribe to this newsletter by mail |
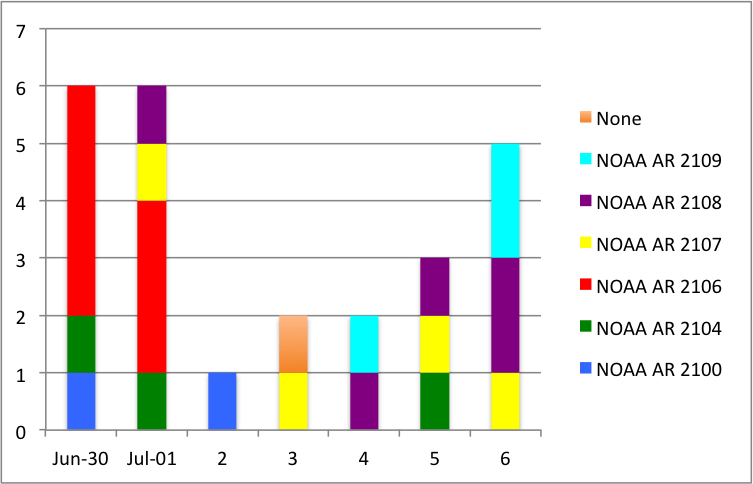
Coinciding with the traditional summer festivals, the Sun started a party on its own by producing a flurry of relatively large and complex sunspot groups. While on 29 June the daily sunspot number was only 62, by 5 July it was at an estimated 152. The 10.7cm radio flux happily joined the festivities, by rising over the same time period from 126 to 193 solar flux units.
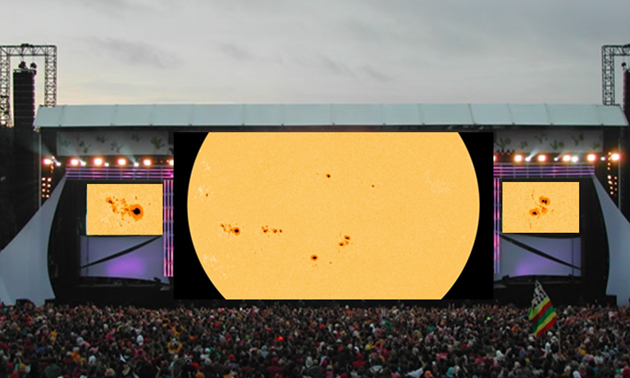
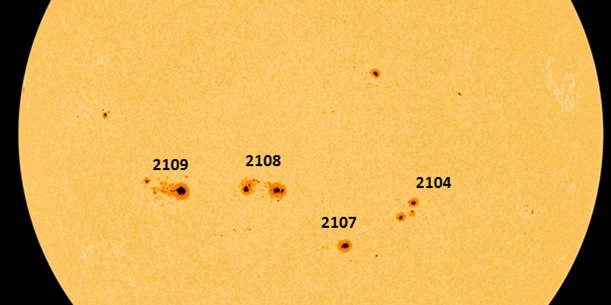
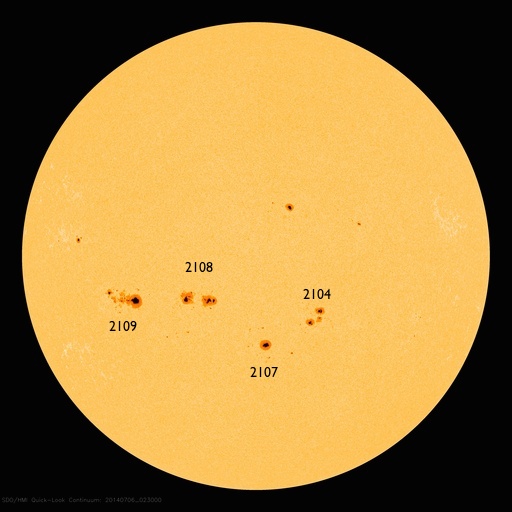
At the beginning of the week, the largest sunspot groups were NOAA 2104 and 2107. A few days later, the appearance of NOAA 2108 and 2109 near the southeast limb assured high sunspot numbers. NOAA 2104, 2108 and 2109 all reached a sunspot area about 4 times the surface area of the Earth. All these sunspot groups were located on the southern solar hemisphere.
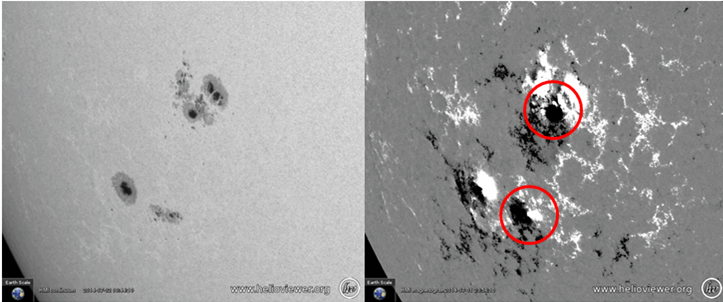
Both NOAA 2104 and 2107 showed magnetic delta's (sunspots with opposite magnetic polarity within the same penumbra - see annotated image underneath), but like some overrated groups, they really were a disappointment in terms of strong flares. Actually they did not produce any M- or X-class flares at all. The same scenario unfolded for NOAA 2108 and 2109.
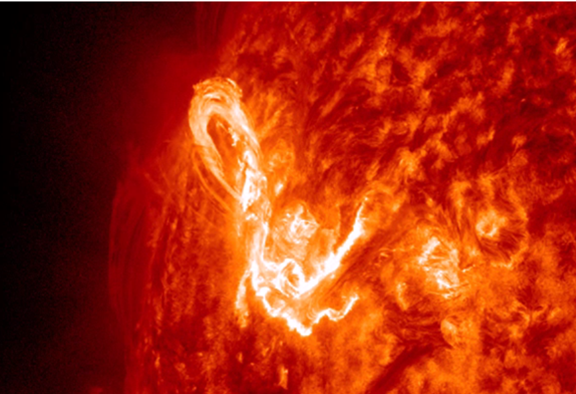
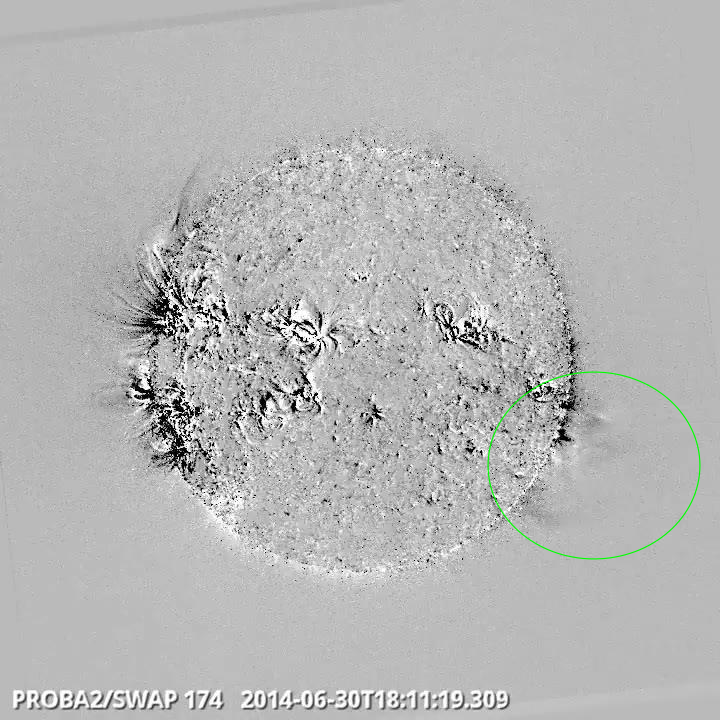
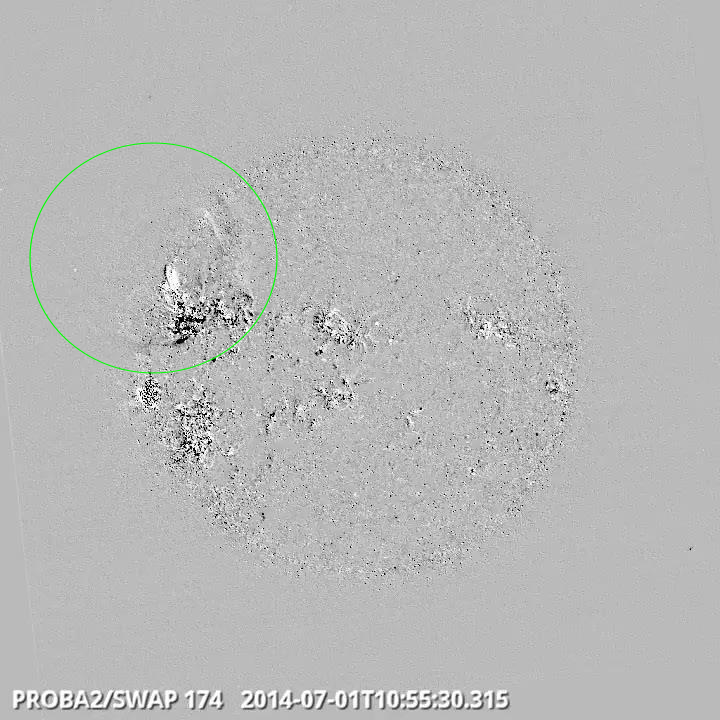
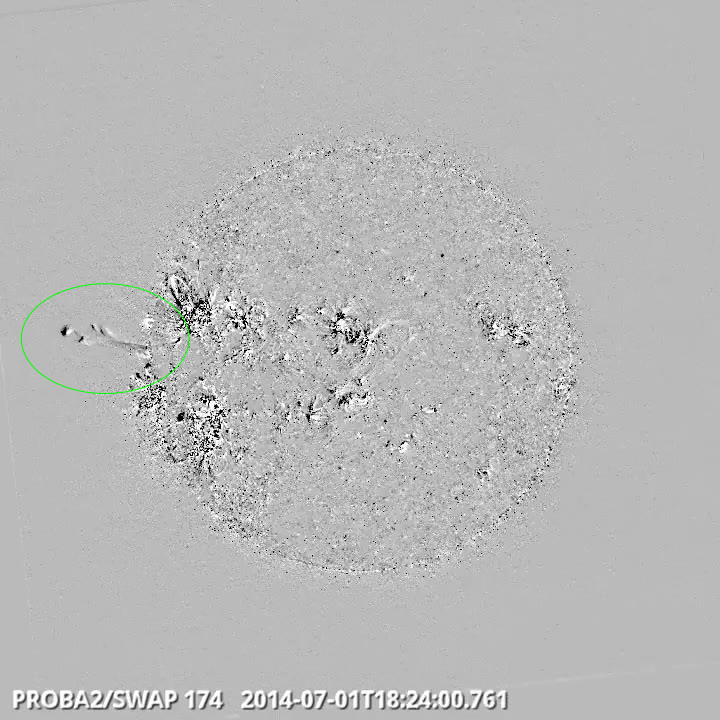
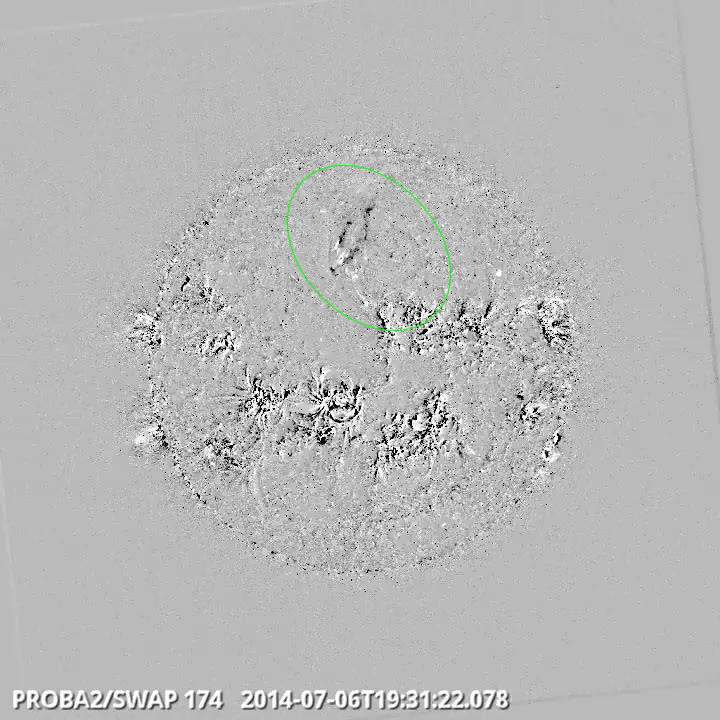
The top act of the week took place in small sunspot region NOAA 2106 on the northern hemisphere, or more precisely, in the filament to the south and west of this sunspot region. The M1.4 flare occurred on 1 July, and peaked at 11:23UT. The flare was associated to an EIT-wave (see http://www.stce.be/news/241/welcome.html ) and a coronal mass ejection. This CME was directed to the north and did not have an earth-directed component.
This movie at http://youtu.be/SO6aXoTypiM first shows the evolution of the various sunspot groups in white light, then a closer view on the magnetic evolution of the main groups, topped by the M1 flare as seen in extreme ultraviolet, with the associated EIT-wave (PROBA2 difference images) and CME.
Credits - Imagery for this movie was taken from SDO (http://sdo.gsfc.nasa.gov/data/aiahmi/), SOHO (http://sohowww.nascom.nasa.gov/home.html), PROBA2 (http://proba2.oma.be/ssa), and Helioviewer (http://helioviewer.org/).
The level of solar activity was mostly low during this week, moderate on Tuesday (M1.4 flare).
In order to view the activity of this week in more detail, we suggest going to the following website from which all the daily (normal and difference) movies can be accessed: http://proba2.oma.be/ssa.
This page also lists the recorded flaring events.
A weekly overview movie can be found here: http://proba2.oma.be/swap/data/mpg/movies/WeeklyReportMovies/WR223_Jun30_Jul06/weekly_movie_2014_06_30.mp4 (SWAP week 223).
Details about some of this week’s events can be found further below.
Four large sunspot groups dominated the outlook of the solar disk for most of the week. These were NOAA 2104, 2107, 2108 and 2109, and were all located on the southern solar hemisphere. All these groups had several days during which they had one or more magnetic delta's, but these did not result in any major flaring. The evolution of the sunspots over the solar disk can be seen in this movie: http://stce.be/movies/20140630_hmi.mp4
There was however one M-flare in active region NOAA 2106, associated with a partial eruption of a long filament south-west of this region. This M1.4 flare peaked on 1 July at 11:23UT, and was associated to an EIT-wave and a non-Earth directed CME which had a speed of about 320 km/s.
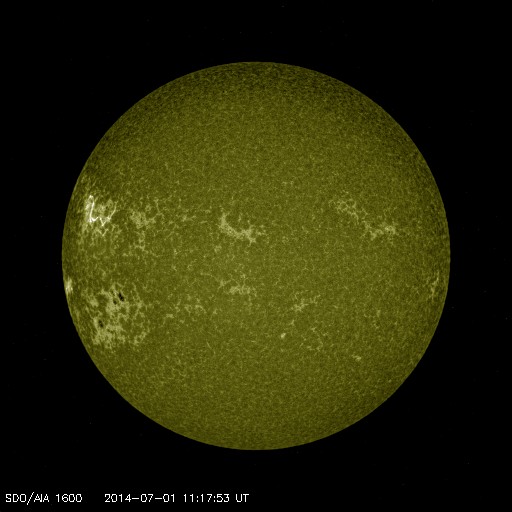
In a SDO/AIA 1600 movie ( http://stce.be/movies/20140701_aia_1600.mp4 ) the light flash or flare looks like "electrical discharges". The number 1600 indicates that the movie is made in the 160.0 nm wavelength, i.e. UV. AIA 1600 monitors the solar transition region, the chromosphere and the upper photosphere. The ejected plasma is also visible.
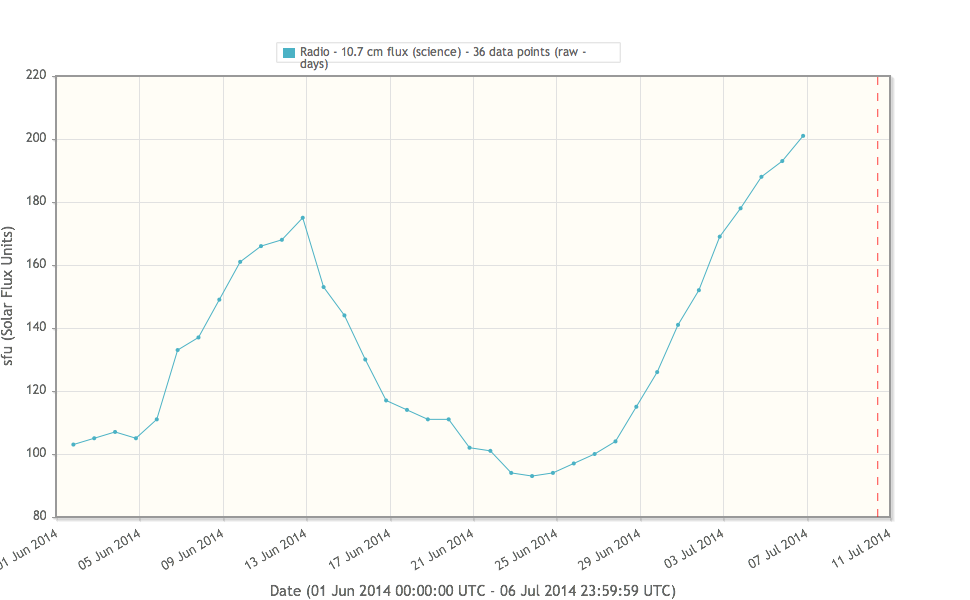
Most of the other CMEs were directed to the north or east, and did also not have an Earth directed component. The x-ray background flux was near of just above the C1-level for the entire week, and the 10.7 cm radio flux rose from 126 sfu on 29 June to 201 sfu on 6 July. The graph below shows the 10.7 cm radio flux from June 1 to July 6.
| DAY | BEGIN | MAX | END | LOC | XRAY | OP | 10CM | TYPE | Cat | NOAA |
| 01 | 1105 | 1123 | 1159 | M1.4 | 5 | 2106 |
| LOC: approximate heliographic location | TYPE: radio burst type |
| XRAY: X-ray flare class | Cat: Catania sunspot group number |
| OP: optical flare class | NOAA: NOAA active region number |
| 10CM: peak 10 cm radio flux |
Solar wind speed varied between 350 and 250 km/s, while Bz was between -8 and +6 nT. Note that in the graph below the data are averages over 1 hour, this gives less details compared with 5 minutes averages.
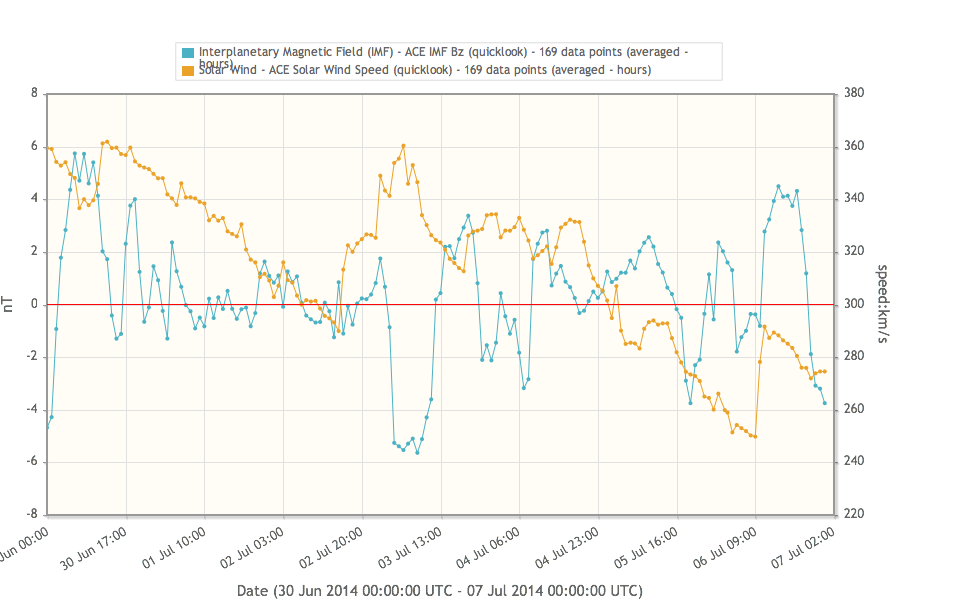
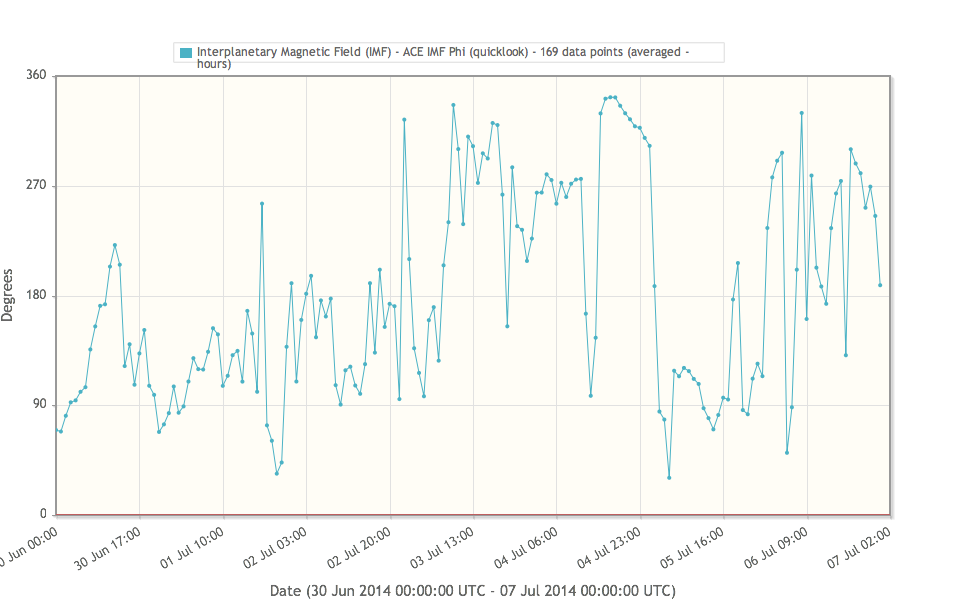
For information about sector boundary crossings and its relation with Phi, check the STCE newsletter http://stce.be/newsletter/pdf/2014/STCEnews20140605.pdf
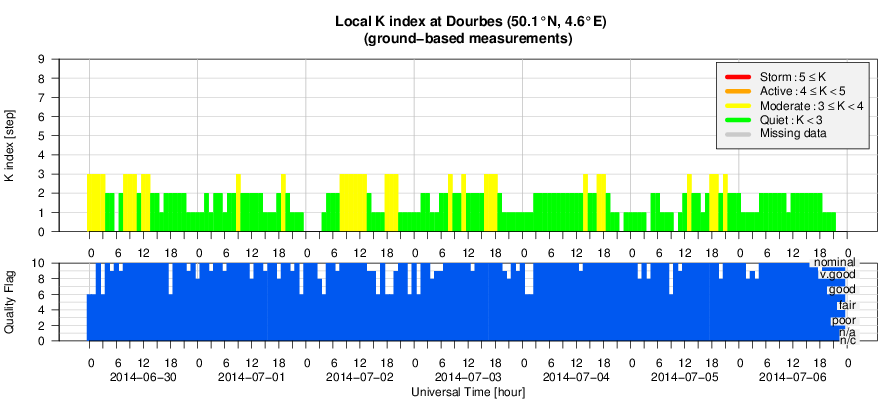
Geomagnetic conditions were mostly quiet, with locally some brief episodes of K=3.
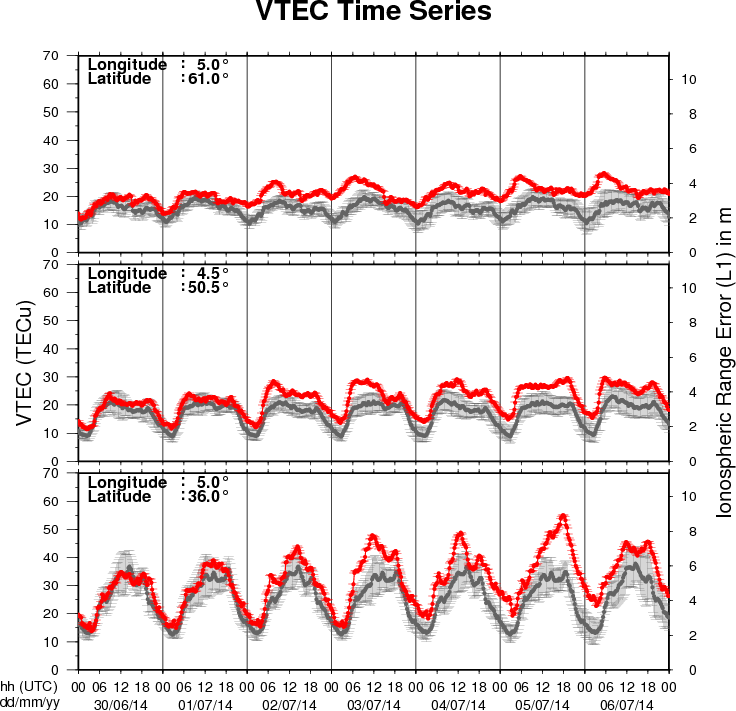
The figure shows the time evolution of the Vertical Total Electron Content (VTEC) (in red) during the last week at three locations:
a) in the northern part of Europe(N61°, 5°E)
b) above Brussels(N50.5°, 4.5°E)
c) in the southern part of Europe(N36°, 5°E)
This figure also shows (in grey) the normal ionospheric behaviour expected based on the median VTEC from the 15 previous days.
The VTEC is expressed in TECu (with TECu=10^16 electrons per square meter) and is directly related to the signal propagation delay due to the ionosphere (in figure: delay on GPS L1 frequency).
The Sun's radiation ionizes the Earth's upper atmosphere, the ionosphere, located from about 60km to 1000km above the Earth's surface.The ionization process in the ionosphere produces ions and free electrons. These electrons perturb the propagation of the GNSS (Global Navigation Satellite System) signals by inducing a so-called ionospheric delay.
See http://stce.be/newsletter/GNSS_final.pdf for some more explanations ; for detailed information, see http://gnss.be/ionosphere_tutorial.php
Presentation given during the STCE workshop Modelling of antennas and calibration of radio instruments.
http://www.spaceweather.eu/en/repository/show?id=526
Presentation given during the STCE workshop Modelling of antennas and calibration of radio instruments.
http://www.spaceweather.eu/en/repository/show?id=527
Presentation given during the STCE workshop Modelling of antennas and calibration of radio instruments.
http://www.spaceweather.eu/en/repository/show?id=528
Presentation given at the STCE workshop Modelling of antennas and calibration of radio instruments, June 2014.
http://www.spaceweather.eu/en/repository/show?id=529
Presentation given at the STCE workshop Modelling of antennas and calibration of radio instruments, June 2014.
http://www.spaceweather.eu/en/repository/show?id=530
Presentation given at the STCE workshop Modelling of antennas and calibration of radio instruments, June 2014.
http://www.spaceweather.eu/en/repository/show?id=531
Presentation given at the STCE workshop Modelling of antennas and calibration of radio instruments, June 2014.
http://www.spaceweather.eu/en/repository/show?id=532
Presentation given at the STCE workshop Modelling of antennas and calibration of radio instruments, June 2014.
http://www.spaceweather.eu/en/repository/show?id=533