
The Solar-Terrestrial Centre of Excellence (STCE) is a collaborative network of the Belgian Institute for Space Aeronomy, the Royal Observatory of Belgium and the Royal Meteorological Institute of Belgium.
|
Published by the STCE - this issue : 19 Sep 2014. The Solar-Terrestrial Centre of Excellence (STCE) is a collaborative network of the Belgian Institute for Space Aeronomy, the Royal Observatory of Belgium and the Royal Meteorological Institute of Belgium. |
| Archive of the newsletters | Subscribe to this newsletter by mail |
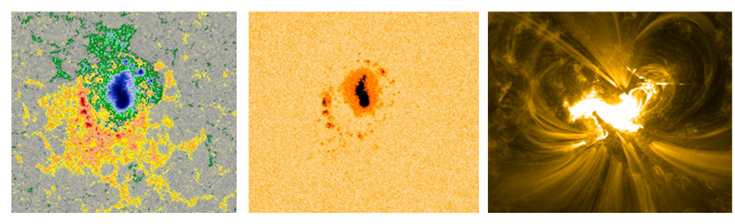
On 10 September at 17:45UT, NOAA 2158 produced the 35th X-class flare of the ongoing solar cycle. The X1.6 event was extensively covered in this news item at http://stce.be/news/267/welcome2.html The images underneath show the sunspot region in white light and the corresponding magnetogram about 30 minutes prior to the flare's peak, and the flare at its maximum flux as observed in SDO/AIA 171. The flare took place along the borderline between negative (blue) and positive (red) magnetic polarity.
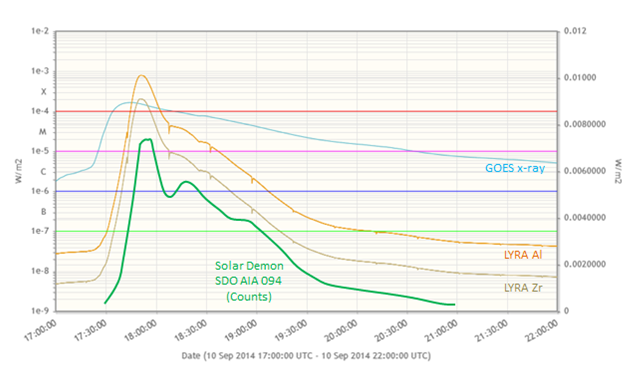
Graph underneath shows the evolution of the flare in x-ray (GOES) and EUV (PROBA2/LYRA in W/m2; Solar Demon AIA 094 in counts). One can see that the EUV emissions peak 6-12 minutes later than those from x-ray. This is due to the cooling of the post-flare coronal loops, whose emissions become then better visible in the less energetic EUV passbands. The AIA 094 emissions also show a second peak about 30 minutes after its maximum. This second peak is not visible in x-ray. This "extra" EUV emission does not originate from the original flare site, but most probably from a volume of higher coronal loops. This may indicate there's additional post-flare loop reconnection, but at a lower temperature than during the flare's main peak. This is called the "EUV late phase". No doubt this flare will generate quite a few scientific papers!
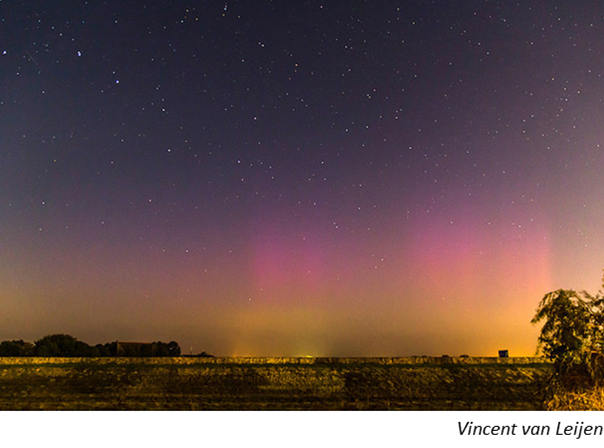
The geomagnetic storm from the CME related to this X1 flare did not live up to the expectations, as the CME's magnetic field was directed mostly northward. This prevented a good connection with the Earth's magnetic field, and thus severe geomagnetic storming was not possible. Nice polar lights were observed, but they were confined to the usual places (Scandinavia, Canada, Alaska,...). Nonetheless, some aurora were photographed from Franeker, Friesland (northern part of the Netherlands), as picture underneath demonstrates. It was taken by Vincent van Leijen on 12 September at 23:05LT, when the storm was most intense. See also this webpage at https://www.flickr.com/photos/fotovins/15035943737 Can you see the Big Dipper constellation?
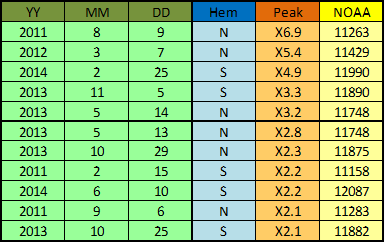
This X1.6 flare was certainly not the strongest one of solar cycle 24 (SC24), ranking somewhere half of the pack. A table with the Top 11 most powerful flares during SC24 can be found underneath. Aside the date, also the hemisphere and source region are mentioned. A little more than half of the X-class flares (20) took place on the northern solar hemisphere. The X6.9 flare, currently the strongest of SC24, is the only one that ranks within the Top 50 of strongest flares since systematic measurements began in 1976 (36th place).
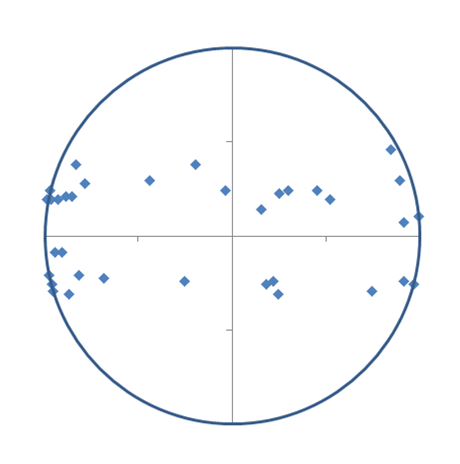
It's also interesting to take a look at the position of these 35 X-class flares on the solar disk. Only one third of these flares took place in the center half of the solar disk, with most of the other events taking place near the solar limb. In fact, nearly half took place near the east limb, which makes it of course very difficult for any associated CME to have a geo-effective impact.
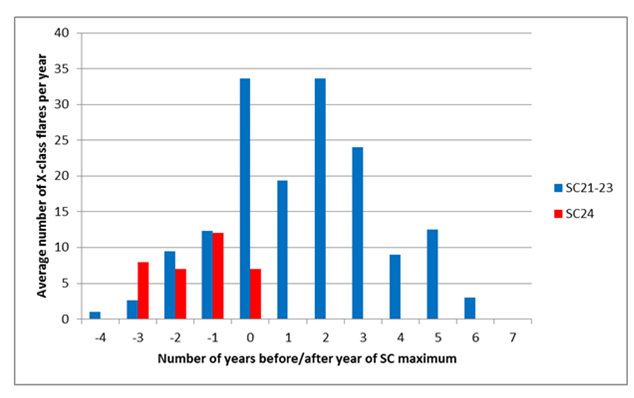
Finally, this solar cycle will certainly produce quite a few more X-class flares as it further unfolds. Indeed, averaging per year the total number of X-flares over the last 3 cycles, the bar-diagram underneath shows that there is a second peak of "eXtreme" flares about 2-3 years after the year when the solar cycle maximum actually occurred. For example, the Halloween flares (October 2003) occurred about 3 years after SC23 maximum. So, though we have not observed that many X-class flares so far this solar cycle, statistically we are still in for quite a bit of X-class activity in years to come.
Credits - Data and imagery were taken from SDO (http://sdo.gsfc.nasa.gov/data/aiahmi/), Solar Demon (http://solardemon.oma.be/), PROBA2/Lyra (http://proba2.oma.be/ssa), GOES (http://www.swpc.noaa.gov/rt_plots/), NGDC (http://www.ngdc.noaa.gov/), Staff (http://sun-ts-dev.oma.be/), and Vincent van Leijen (https://www.flickr.com/photos/fotovins/15035943737).
August 2014, an article about water vapour research appeared in the journal Atmospheric Measurement Techniques. So what? I hear you thinking. The thing is that the three institutes BIRA-IASB, RMI and ROB worked together, each with its own speciality: positioning by ROB, meteorology by RMI and satellite data retrieval by BIRA-IASB. This collaboration resulted in a remarkable piece of research with a societal relevance: 'A multi-site inter comparison of integrated water vapour observations for climate change analysis'.
check http://www.atmos-meas-tech.net/7/2487/2014/amt-7-2487-2014.html
On top of the 29 C-class flares that were observed this week, also 4 M-class flares as well as 1 X-class flare were recorded.
An overview is given in the chart below where M/X stands for an M/X-flare, flares without a letter are C-flares. The yellow are flares which are not associated with an on disk NOAA active region but come from a region behind the east (E) or west (W) limb.
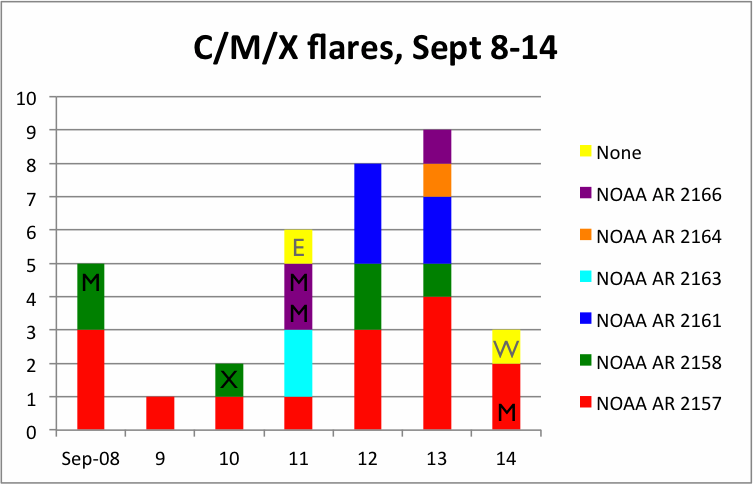
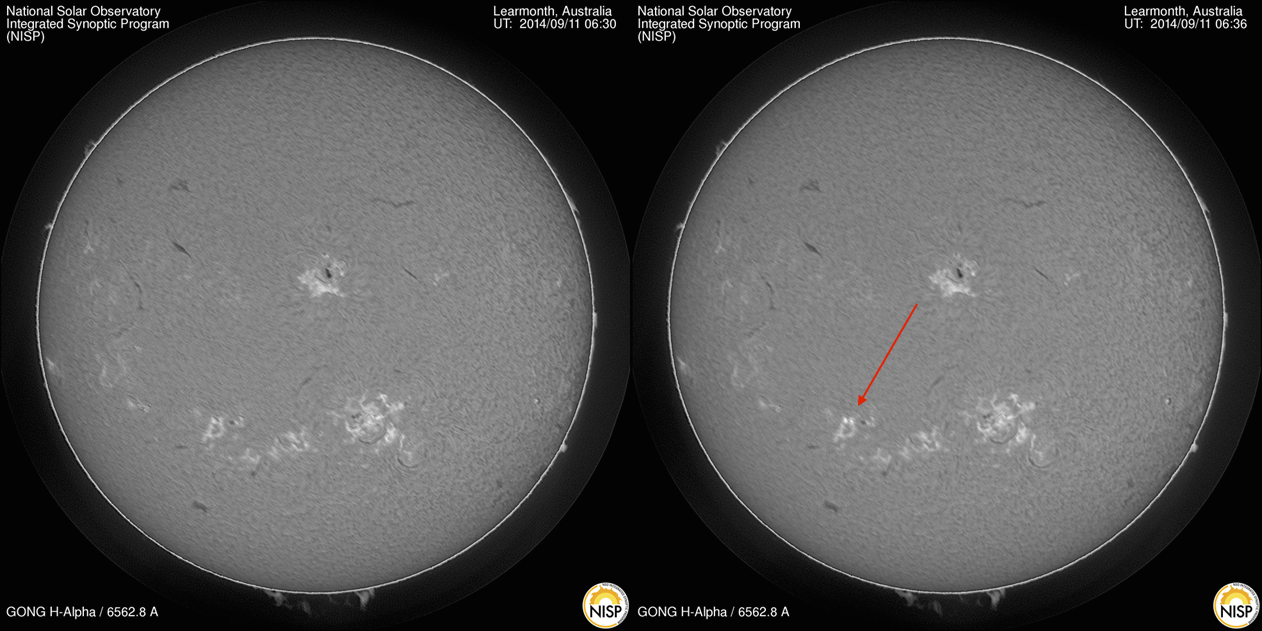
There is one peculiar case with no space weather relevance but just nice to know: GOES and LYRA detected a flare peaking at 06:36UT on 11 September. At that time, the moon blocked the view on the Sun of SDO/AIA which of course could not be used to determine the source region. But, H-alpha pictures taken by a ground-based telescope in Learmonth, Australia (part of the GONG network) gave a clear hint: it was NOAA AR 2163 that 'flickered' in H-alpha. NOAA AR 2163 had only one glory day during which it produced 2 C-flares.
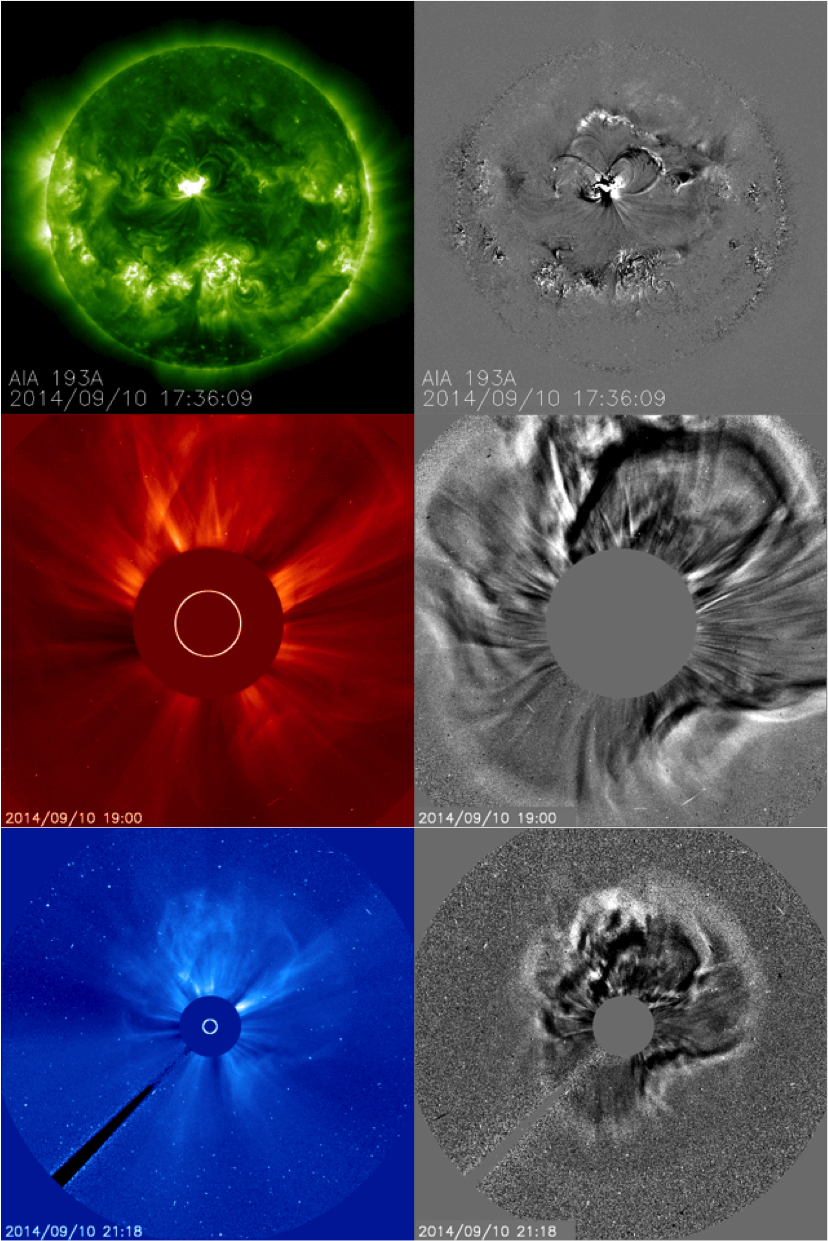
NOAA 2158 (located in the middle of the solar disk at that time - top left) produced an M4.5 flare that peaked on 9 September at 00:29UT. Though the bulk of the associated halo CME was directed to the northeast, it was determined that it had an Earth-directed component. Its plane-of-the-sky speed was about 710 km/s. On 10 September, the same active region produced an X1.6 flare that peaked at 17:45UT. There was an EUV wave which is seen as the circular feature around NOAA 2158 in the grey difference image, top right. An EUV wave is an on disk signature of a plasma ejection. It was a full halo CME clearly visible on the coronagraph LASCO C2 (middle) and C3 (bottom), with a plane-of-the-sky speed around 1200 km/s.
The greater than 10 MeV proton flux levels, still enhanced from a backside event on 1 September, gradually rose to reach a maximum of 28 pfu on 11 September. It was still above event threshold when the arrival of the aforementioned CMEs (in particular the CME related to the X1 flare) drove flux levels back up. The proton flux eventually reached 126 pfu on 12 September at 15:55UT. The proton event ended later that day around 23:10UT.
The other complex active region of this week, NOAA 2157, did produce only 1 M-class flare (M1.5 on 14 September peaking at 02:16UT). The associated CME was not Earth directed. The two other M-class flares originated from NOAA 2166 while the region was at or just behind the northeast limb. The M2.1 and M1.4 flare were produced on 11 September, peaking resp. at 15:26UT and 21:26UT.
Various filament eruptions were observed, e.g. on 12 September around 18:30UT and 23:50UT, and on 13 September around 03:40UT, 16:30UT and 20:00UT. None of the associated CMEs were deemed to be geo-effective.
| DAY | BEGIN | MAX | END | LOC | XRAY | OP | 10CM | TYPE | Cat | NOAA |
| 08 | 2312 | 0029 | 0131 | N12E29 | M4.5 | 1N | CTM/1 | 48 | 2158 | |
| 10 | 1721 | 1745 | 1820 | N14E2 | X1.6 | 2B | 1300 | II/2IV/2 | 48 | 2158 |
| 11 | 1520 | 1526 | 1531 | M2.1 | 210 | 2166 | ||||
| 11 | 2101 | 2126 | 2130 | M1.4 | 2166 | |||||
| 14 | 0203 | 0216 | 0236 | S13W49 | M1.5 | 2N | CTM/1 | 45 | 2157 |
| LOC: approximate heliographic location | TYPE: radio burst type |
| XRAY: X-ray flare class | Cat: Catania sunspot group number |
| OP: optical flare class | NOAA: NOAA active region number |
| 10CM: peak 10 cm radio flux |
From 8 till late on 11 September, geomagnetic conditions were mostly quiet to unsettled. A sector boundary crossing was observed on 10 September around 21:30UT, with IMF turning away from the Sun, resulting locally in brief periods of active geomagnetic conditions.
On 11 September at 23:02UT, ACE observed a shock in the solar wind indicating the arrival of the CME related to the M4 flare. Solar wind speed increased from about 350 to 480 km/s, with Bz oscillating between -14 and +11nT. The impact resulted in active geomagnetic conditions (Dourbes), while Kp reached minor geomagnetic storm levels.
On 12 September at 15:27UT, ACE observed another shock in the solar wind, this time related to the arrival of the CME associated to the X1 flare. Wind speed increased abruptly from 430 to 670 km/s, and further increased to a maximum of nearly 800 km/s around 22:00UT. Bz was oriented southward between 20:30 and 22:00UT with maximum values near -17nT, then abruptly turned northward to steady values around +20 nT. The period between 21:00UT and 24:00UT was geomagnetically the most intense, with Kp reaching 7 (strong geomagnetic storm), and local K-indices at Dourbes and Potzdam reaching 6 (moderate storming). Geomagnetic conditions then quieted down, with unsettled to active conditions observed during the first half of 13 September.
By the end of the period, solar wind speed had decreased to values near 450 km/s, and Bz was at +5 nT. Geomagnetic conditions were quiet to unsettled.

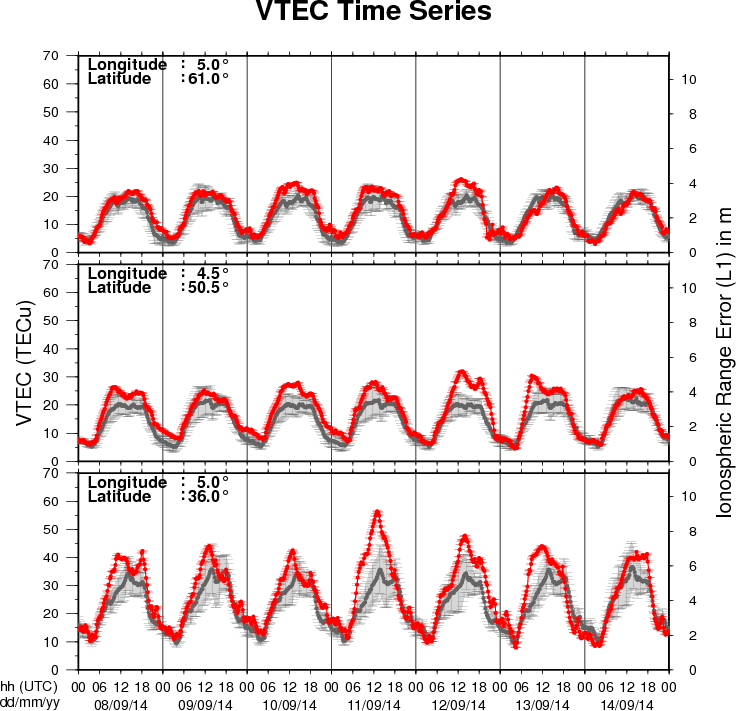
The figure shows the time evolution of the Vertical Total Electron Content (VTEC) (in red) during the last week at three locations:
a) in the northern part of Europe(N61°, 5°E)
b) above Brussels(N50.5°, 4.5°E)
c) in the southern part of Europe(N36°, 5°E)
This figure also shows (in grey) the normal ionospheric behaviour expected based on the median VTEC from the 15 previous days.
The VTEC is expressed in TECu (with TECu=10^16 electrons per square meter) and is directly related to the signal propagation delay due to the ionosphere (in figure: delay on GPS L1 frequency).
The Sun's radiation ionizes the Earth's upper atmosphere, the ionosphere, located from about 60km to 1000km above the Earth's surface.The ionization process in the ionosphere produces ions and free electrons. These electrons perturb the propagation of the GNSS (Global Navigation Satellite System) signals by inducing a so-called ionospheric delay.
See http://stce.be/newsletter/GNSS_final.pdf for some more explanations ; for detailed information, see http://gnss.be/ionosphere_tutorial.php
Presentation given during a users' visit about the STCE operational space weather services and products.
http://www.spaceweather.eu/en/repository/show?id=534
Presentation given during a users' visit about the STCE operational space weather services and products.
http://www.spaceweather.eu/en/repository/show?id=535
Presentation given during a users' visit about the STCE operational space weather services and products.
http://www.spaceweather.eu/en/repository/show?id=536
Presentation given during a users' visit about the STCE operational space weather services and products.
http://www.spaceweather.eu/en/repository/show?id=537
Presentation given during a users' visit about the STCE operational space weather services and products.
http://www.spaceweather.eu/en/repository/show?id=538
Presentation given during a users' visit about the STCE operational space weather services and products.
http://www.spaceweather.eu/en/repository/show?id=539
Presentation given during a users' visit about the STCE operational space weather services and products.
http://www.spaceweather.eu/en/repository/show?id=540
http://www.spaceweather.eu/en/repository/show?id=541
Start : 2014-11-12
This conference aims to bring together researchers, engineers,
users in the area of Big Data in the Space sector.
The focus is on the whole data lifecycle, ranging from data
acquisition by spaceborne and ground-based sensors to data
management, analysis and exploitation in the domains of Earth
Observation, Space Science, Space Engineering, Space Weather,
etc.
Special emphasis will be put on highlighting synergies and
cross-fertilization opportunities from domains like Climate Change,
Solid Earth Science, Planetary Sciences, Life Science,
Astrophysics, High Energy Physics, Social Sciences, etc.
We expect this conference to:
* contribute towards a common "Big Data from Space" scientific
and programmatic framework
* widen competences and expertise of universities, labs and
industrial actors
* foster networking of experts and users towards better access
and sharing of data, tools and resources
* leverage innovation, spin-in, spin off of technologies, and
business development arising from research and industry
progress
Website:
http://congrexprojects.com/2014-events/BigDatafromSpace/objectives
Start : 2014-11-17 - End : 2014-11-21
The 11th Edition of the European Space Weather Week will take
place on 17-21nd November 2014 in Liège, Belgium.
The ESWW will again adopt the central aim of bringing together
the diverse groups in Europe working on different aspects of Space
Weather. This includes but isn't limited to the scientific
community, the engineering community, applications developers,
service providers and service end users.
The meeting organisation is coordinated by the Belgian
Solar-Terrestrial Centre of Excellence (STCE), ESA and the Space
Weather Working Team. The local organisation is done by the
STCE.
Website:
http://www.stce.be/esww11/
Start : 2014-12-15 - End : 2014-12-19
The AGU Fall Meeting is the largest worldwide conference in the
geophysical sciences, attracting more than 22,000 Earth and space
scientists, educators, students, and other leaders. For 46 years,
energized and passionate Earth and space scientists from around the
world gather at the AGU Fall Meeting to connect with colleagues,
broaden their knowledge base, and embrace the joy of science. The
2014 meeting takes place Monday 15 - Friday 19 December 2014.
Several sessions about space weather are foreseen:
*
When and Why Does Space weather Forecasting Fail?
*
Addressing Operational Space Weather Needs
*
Near Real Time Data for Earth Science and Space Weather
Applications
*
Understanding Hemispheric Asymmetry and Space Weather
*
Connection of Solar Events With the Variability of Space
Environments
*
Bz from the Sun to the Earth: Observations and Modeling
*
Solar Sources and Heliospheric Consequences of Coronal Mass
Ejections in Solar Cycle 24
*
Advances in Ionospheric Forecasting - Modeling, Observations, and
Validation
Abstract Submission Deadline: August 6, 2014
Website:
http://fallmeeting.agu.org/2014/
Start : 2015-04-20 - End : 2015-04-24
This gathering was born out of the desire to collect in one
place the latest technologies required for advancement of science
in the discipline of Solar and Space Physics. In doing so, it was
recognized that the two 1998 volumes of 'Measurement Techniques in
Space Plasmas' (Particles and Fields) have been a valuable
reference and resource for advanced students and scientists who
wish to know the fundamentals of measurement techniques and
technology.
Website:
https://mtssp.msfc.nasa.gov/
Start : 2015-06-22 - End : 2015-07-02
We invite contributions on novel inversion methods with
application across the geosciences. Of particular interest are 3D
imaging, joint inversion of geodetic, geophysical and geochemical
datasets, and multi-disciplinary interpretation approaches such as
integration of gravity, EM and seismic data or thermo-mechanical
modelling studies constrained by physical parameters.
Modelling of Space Weather Effects: Solar, Magnetospheric and
Earth Resistivity Constraints (IAGA, IAMAS)
In this symposium we welcome contributions on all aspects of the
modelling of space weather and its effects, from the Sun to Earth.
This includes the modelling of the various interactions between
travelling solar storms and the solar wind, magnetosphere,
ionosphere and solid Earth and the validation of models through
measurements. Contributions on models developed to aid end-users,
such as satellite and power grid operators, survive the impact of
space weather are also encouraged.
Website:
http://www.iugg2015prague.com/joint-inter-association-symposia.htm#JA