
The Solar-Terrestrial Centre of Excellence (STCE) is a collaborative network of the Belgian Institute for Space Aeronomy, the Royal Observatory of Belgium and the Royal Meteorological Institute of Belgium.
|
Published by the STCE - this issue : 7 Nov 2014. The Solar-Terrestrial Centre of Excellence (STCE) is a collaborative network of the Belgian Institute for Space Aeronomy, the Royal Observatory of Belgium and the Royal Meteorological Institute of Belgium. |
| Archive of the newsletters | Subscribe to this newsletter by mail |
Solar filaments are clouds of ionized gas above the solar surface squeezed between magnetic regions of opposite polarity. Being cooler and denser than the plasma underneath and their surroundings, they appear as dark lines when seen on the solar disk using special filters. At the solar limb, the same features shine bright over the solar limb and are called prominences. As filaments grow longer, they are more likely to erupt, often accompanied by a coronal mass ejection (CME).
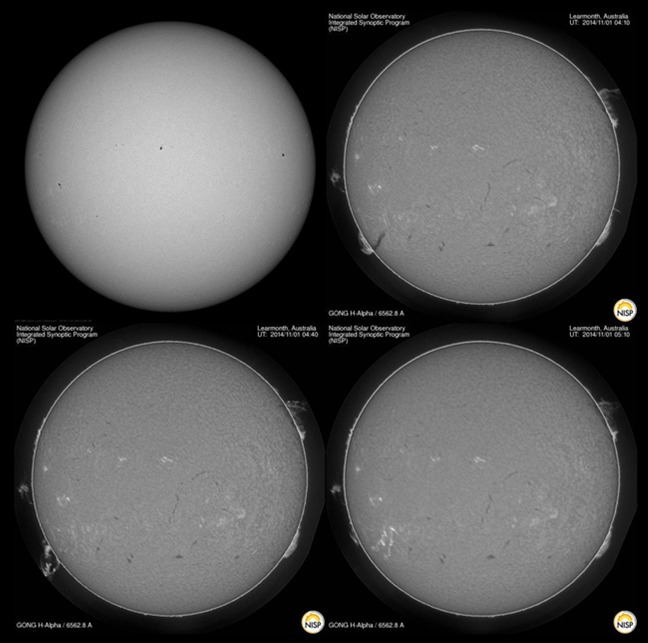
An impressive filament eruption took place during the morning hours of 1 November 2014, near the southeast solar limb. It was accompanied by a long duration C2.7 flare, starting at 04:44UT and ending only at 07:05UT. This was a typical example of a "spotless" flare, that is a flare occurring far from any active sunspot region. It is also called a Hyder flare, after the scientist who first studied this kind of phenomena in detail and published two hallmark papers on it in 1967 (see note 1). The filament eruption and flare can be seen in the above images of the Sun's lower chromosphere (H-alpha), taken at 04:10, 04:40 and 05:10UT. SDO's white light image (upper left) shows the absence of any nearby sunspot group. A movie of the event in various wavelengths can be found at http://youtu.be/aLYWJ1Vk3hU
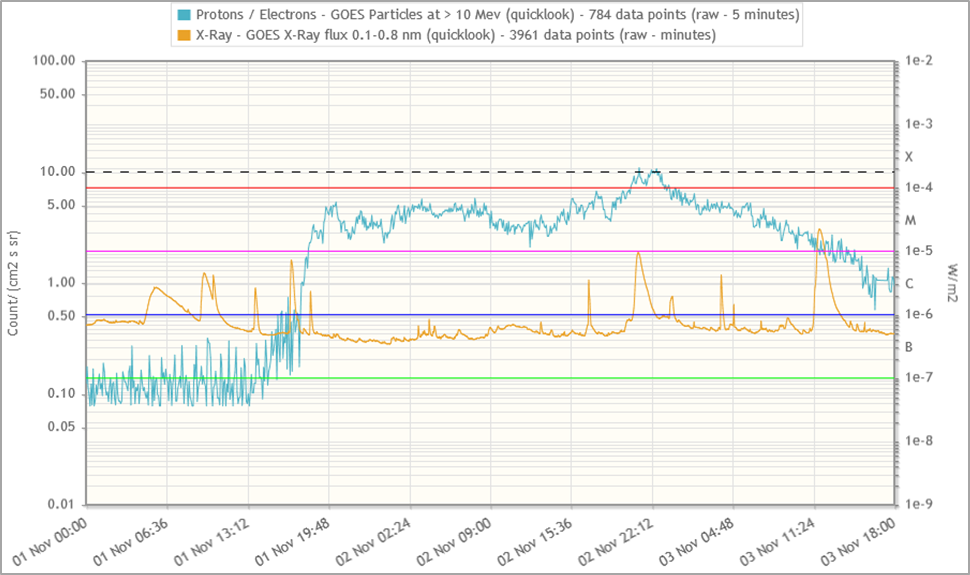
Most likely, the filament eruption was also associated to a small proton event (graph above). Proton flux started to increase on 1 November at 17:30UT, that is nearly 12 hours after the flare's peak (05:34UT). The greater than 10 MeV proton flux only briefly reached the event threshold (10 pfu - see note 2) on 2 November at 21:10UT, and occasionally between 22:10 and 22:45UT. In view of the peculiar evolution of the proton flux, it is not excluded that there were other sources for or contributing to this proton event.

The image above was take at 07:30UT through AIA 171 and AIA 304 filters (transition zone and lower corona). The expanding flare ribbons ("parallel ribbons") and the series of post-flare coronal loops ("arcade") that can be seen are the effect of the reconnection higher up in the solar atmosphere. The charged particles get accelerated towards the denser inner solar atmosphere, where they collide with other particles and heat the local chromospheric environment and make it evaporate. The footpoints of some faint coronal loops can be seen embedded in the expanding disturbance.
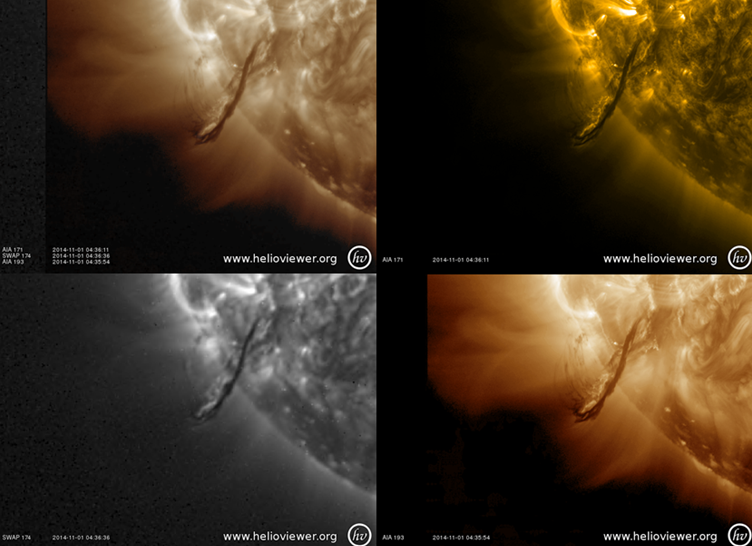
The CME associated to this filament eruption had an average plane-of-the-sky speed of nearly 700 km/s, but the bulk was not earth-directed. In the images above, the loops that can be seen are probably part of the same loop system but seen in different wavelengths and temperatures, i.e. SDO/AIA171 and 193, and SWAP174 in EUV (resp. at about 700.000 degrees, 1.3 and 1 million degrees), and LASCO in white light (density driven - images underneath).

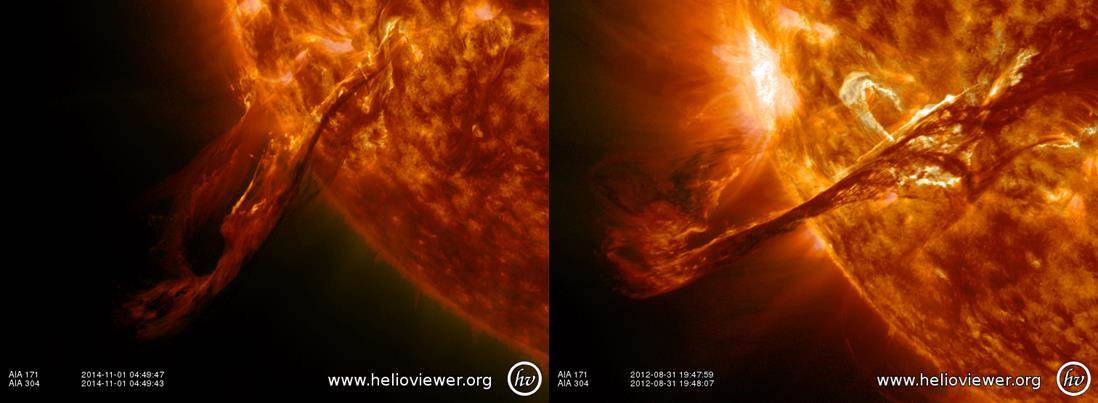
This filament eruption bears quite some resemblance to another event just over 2 years ago, when, on 31 August 2012, a filament similar in length and position, but slightly more to the central meridian, erupted. It was associated to a Hyder flare (C8) and a proton event that reached 59 pfu at its maximum. At the time, Earth received a glancing blow from the CME resulting in a minor geomagnetic storm. See this STCE News item from 7 September 2012 at http://stce.be/news/157/welcome.html
- Hyder, Charles L., A Phenomenological Model for Disparitions Brusques followed by Flarelike Chromospheric Brightenings, Part I and II, http://adsabs.harvard.edu/abs/1967SoPh....2...49H and http://adsabs.harvard.edu/abs/1967SoPh....2..267H A comprehensive summary can be found on the IPS webpages at http://www.ips.gov.au/Educational/2/4/1
- More info on proton events and pfu (particle flux unit) in this 23 January 2014 news item at http://stce.be/news/233/welcome.html
- Images for the movie were taken from GONG H-alpha Network (http://halpha.nso.edu/), SDO (http://sdo.gsfc.nasa.gov/data/aiahmi/), PROBA2 (http://proba2.oma.be/ssa), SOHO (http://sohodata.nascom.nasa.gov/cgi-bin/data_query), and (J)Helioviewer (http://helioviewer.org/).
The satellite PROBA2, launched on 2 November 2009, will celebrate its fifth anniversary in space next Sunday.
PROBA2 is an ESA satellite built in and operated from Belgium. Its main purpose is to study the Sun and space weather. To this end, it successfully uses of a number of new and experimental technologies. David Berghmans, of the Royal Observatory of Belgium, is one of the researchers at the origin of the PROBA2 project. He explains: “The ‘A’ in PROBA2 stands for ‘autonomy’, that is the satellite is only operated during business hours, and flies on ‘automatic pilot’ for the rest of the time. The onboard instruments are directly controlled by the scientists through their laptop.”
During the past 5 years, PROBA2 has orbited the Earth more than 25000 times, covering more than a billion km. The satellite has taken more than 1 million individual images of the Sun, and recorded over 6000 solar flares, including the very strong flares of last week. After 5 years of operation, PROBA2 continues to make high quality images and data that are often used by scientists in their research and articles.

Solar flare activity fluctuated between low and high during the week.
In order to view the activity of this week in more detail, we suggest to go to the following website from which all the daily (normal and difference) movies can be accessed: http://proba2.oma.be/ssa
This page also lists the recorded flaring events.
A weekly overview movie can be found here (SWAP week 240).
http://proba2.oma.be/swap/data/mpg/movies/WeeklyReportMovies/WR240_Oct27_Nov02/weekly_movie_2014_10_27.mp4
Details about some of this week's events, can be found further below.
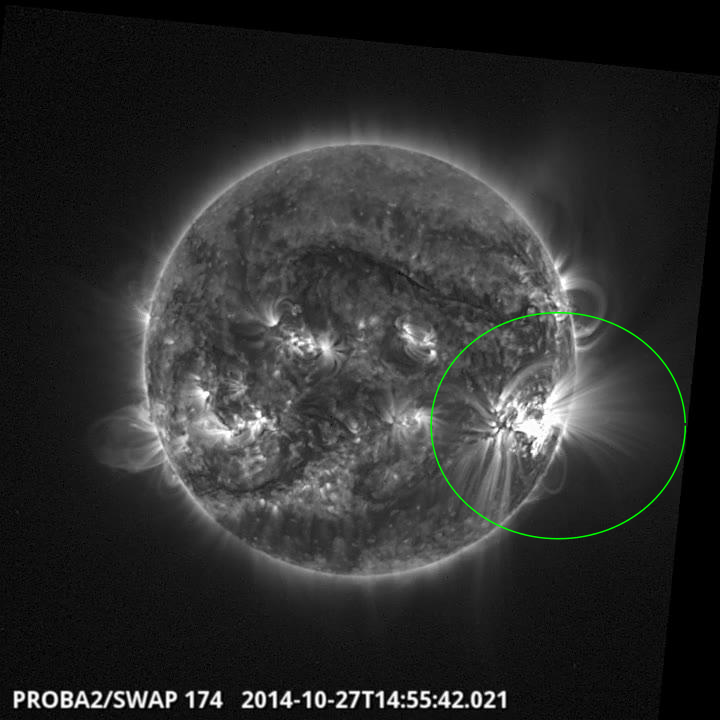
Xflare on the south west quad@ 14:55 SWAP image
Find a movie of the events here (SWAP movie)
http://proba2.oma.be/swap/data/mpg/movies/2014/10/20141027_swap_movie.mp4
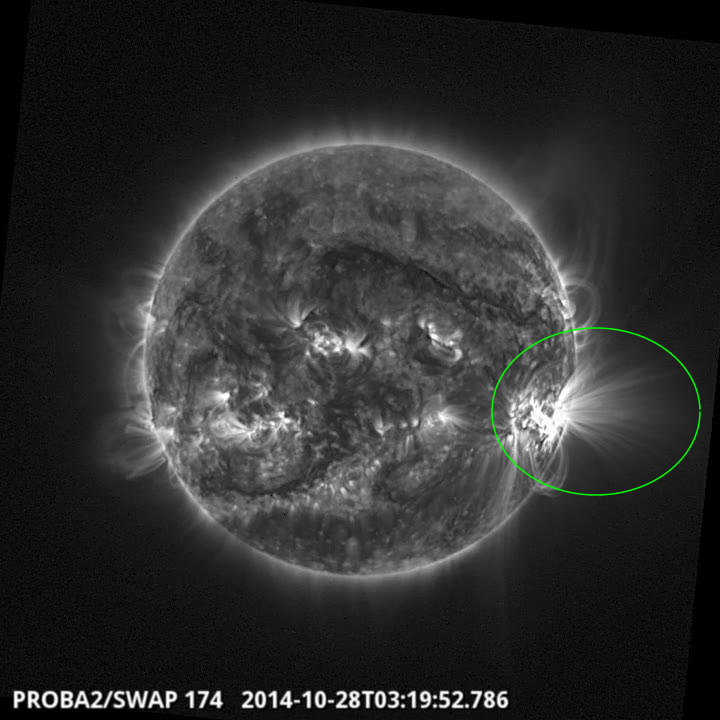
Mflare on the south west quad @ 03:19 SWAP image
Find a movie of the event here (SWAP movie)
http://proba2.oma.be/swap/data/mpg/movies/2014/10/20141028_swap_movie.mp4
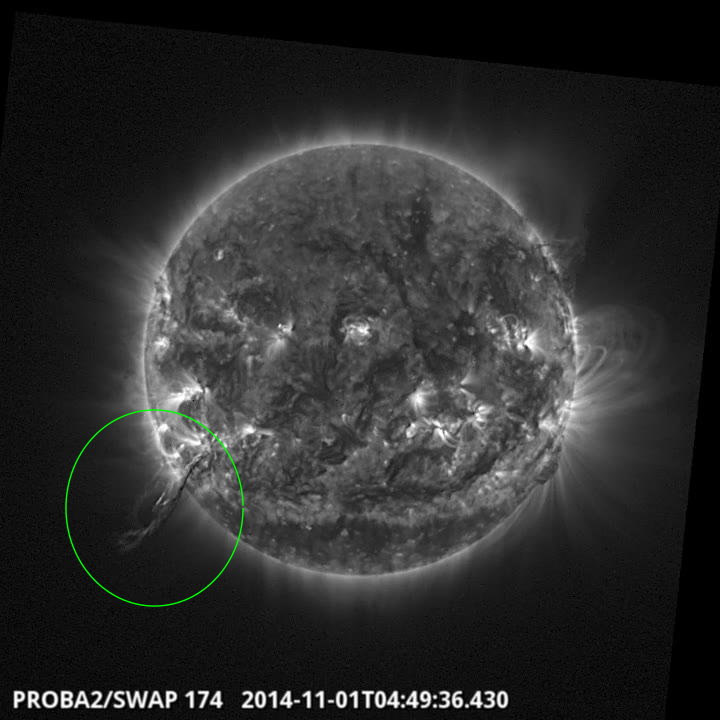
Eruption on the south east quad @ 04:49 SWAP image
Find a movie of the event here (SWAP movie)
http://proba2.oma.be/swap/data/mpg/movies/2014/10/20141028_swap_movie.mp4
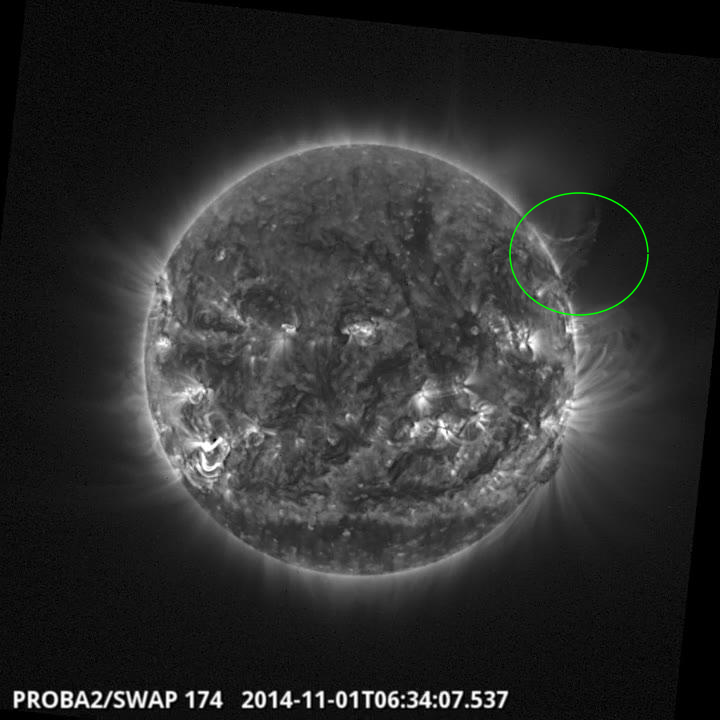
Failed eruption on the north west limb @ 06:34 SWAP image
Find a movie of the event here (SWAP movie)
http://proba2.oma.be/swap/data/mpg/movies/2014/10/20141028_swap_movie.mp4
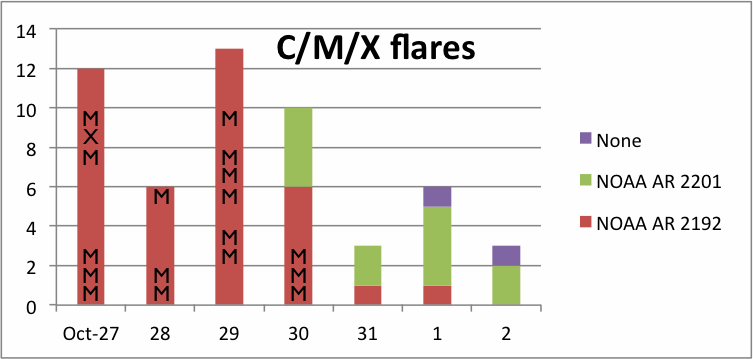
Thirteen active regions were reported last week by NOAA. In the beginning of the week, the frontside of the solar disk was dominated by Catania sunspot region 88 (NOAA 2192), situated near the West limb. Catania 88 produced an X2.1 flare, peaking at 14:45 UT on October 27. This was the sixth X-flare of this large sunspot region. The region was also responsible for seventeen M-flares and several C-flares. In the second half of the week activity was mainly originating from Catania region 3 (NOAA 2201), that produced twelve C-flares, of which a C7.2 peaking at 16:46 UT on November 1 was the largest one. On Sunday November 2 at 21:05 UT a C9.4 flare was observed at the east limb.
Four partial halo CMEs were observed in coronagraphic imagery. The first one was a CME which came into the LASCO-C2 FOV at 5:00 UT on November 1 in LASCO-C2.
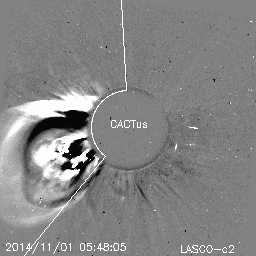
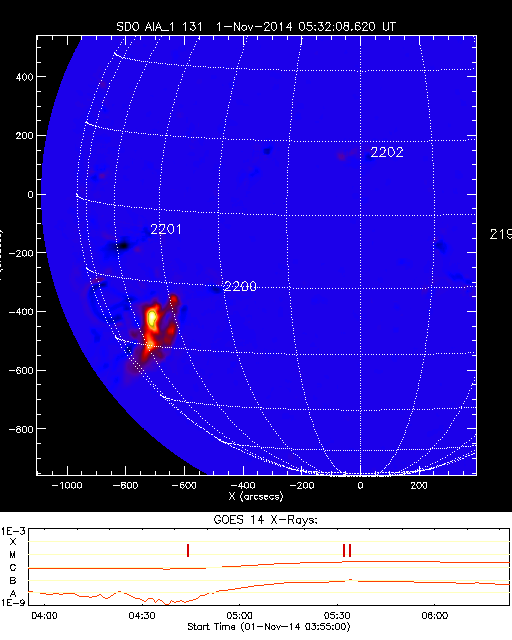
The CME was related to a filament eruption in the southeast quadrant, starting at 4:00 UT and associated with a Hyder flare visible in PROBA2/SWAP and SDO/AIA imagery (the purple box in the chart above, Nov 1 bar).
Two additional CMEs were observed on November 1. A CME with first measurement at 19:00 UT was believed to be back sided. Another CME with first measurement at 15:48 UT in LASCO-C2 possibly is backsided as well, but this is not completely clear due to lack of STEREO data.
Another partial halo CME occurred with first measurement at 10:00 UT on November 2. The CME is associated to flaring activity at the East limb (N20). The main component is propagating to the East and is not expected to be Earth-bound.
An enhancement of the proton flux started on November 1 around 13:00 UT. The GOES spacecraft has observed several increases in the > 10 MeV proton flux: a steep rise at 17:30 UT and then a few increases on November 1 at 19:20 UT, November 2 at 00:20 UT, 14:20 UT and 18:45 UT till it passed the event threshold a few times in the time interval between 21:10 UT and 22:45 UT. Similar observations were noted in ACE/SIS data. The proton flux did not go above 11 pfu.
The sequence of several proton flux rises arguments for the relation with several solar events, among which possibly the CME starting at 5:00 UT on November 1.
The magnitude of the interplanetary magnetic field (IMF) at the L1 point just in front of the Earth was in the range of 5 to 7 nT on the first 2 days (blue curve in the graph below), till the Earth crossed a sector boundary on October 30 around 7:30 UT going from a positive to negative sector. A fluctuation between positive and negative sectors continued through the week. The magnitude of the IMF increased till 15 nT on November 1 at 7:00 UT with a mainly positive Bz, varying between -4 and 10 nT (orange curve).
Solar wind speed was at values around 400 km/s in the beginning of the week, till the arrival of solar wind stream with higher speeds on October 31 at 0:00 UT. The solar wind speed (brown curve) then increased till a peak of 580 km/s at 8:00 UT on November 1.

The local geomagnetic K-index at Dourbes achieved values between K=0 and K=3, with a few isolated slots of K=4 on October 27. The NOAA estimated Kp reached similar values, with in addition a few time slots of K=4 on October 28.
| DAY | BEGIN | MAX | END | LOC | XRAY | OP | 10CM | TYPE | Cat | NOAA |
| 27 | 0006 | 0034 | 0044 | S14W44 | M7.1 | 3B | III/1 | 2192 | ||
| 27 | 0144 | 0202 | 0211 | M1.0 | III/1 | 2192 | ||||
| 27 | 0335 | 0341 | 0348 | M1.3 | 2192 | |||||
| 27 | 0959 | 1009 | 1026 | S18W48 | M6.7 | 2B | 2192 | |||
| 27 | 1412 | 1447 | 1509 | S17W52 | X2.0 | 2B | 110 | 2192 | ||
| 27 | 1733 | 1740 | 1747 | M1.4 | III/1 | 2192 | ||||
| 28 | 0215 | 0242 | 0308 | S14W61 | M3.4 | 1B | 2192 | |||
| 28 | 0323 | 0332 | 0341 | M6.6 | 2192 | |||||
| 28 | 1354 | 1406 | 1423 | S18W72 | M1.6 | SF | 29 | 2192 | ||
| 29 | 0603 | 0820 | 0852 | M1.0 | 88 | 2192 | ||||
| 29 | 0954 | 1001 | 1006 | M1.2 | 88 | 2192 | ||||
| 29 | 1424 | 1433 | 1451 | S16W81 | M1.4 | SF | III/2 | 88 | 2192 | |
| 29 | 1606 | 1620 | 1633 | M1.0 | 88 | 2192 | ||||
| 29 | 1847 | 1850 | 1852 | M1.3 | 88 | 2192 | ||||
| 29 | 2118 | 2122 | 2125 | M2.3 | 88 | 2192 | ||||
| 30 | 0034 | 0037 | 0040 | M1.3 | 88 | 2192 | ||||
| 30 | 0119 | 0135 | 0156 | M3.5 | III/1 | 88 | 2192 | |||
| 30 | 0417 | 0428 | 0436 | S16E62 | M1.2 | SF | 88 | 2192 |
| LOC: approximate heliographic location | TYPE: radio burst type |
| XRAY: X-ray flare class | Cat: Catania sunspot group number |
| OP: optical flare class | NOAA: NOAA active region number |
| 10CM: peak 10 cm radio flux |

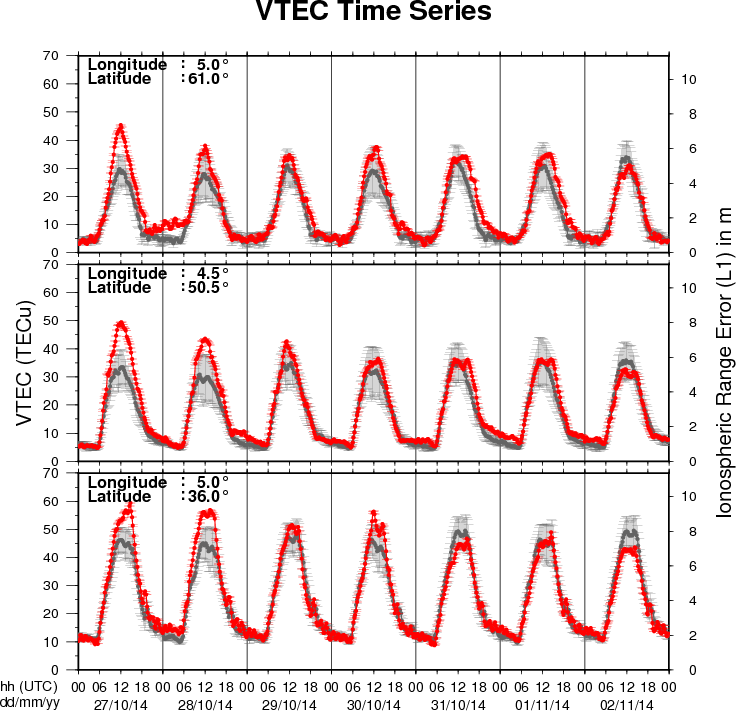
The figure shows the time evolution of the Vertical Total Electron Content (VTEC) (in red) during the last week at three locations:
a) in the northern part of Europe(N61°, 5°E)
b) above Brussels(N50.5°, 4.5°E)
c) in the southern part of Europe(N36°, 5°E)
This figure also shows (in grey) the normal ionospheric behaviour expected based on the median VTEC from the 15 previous days.
The VTEC is expressed in TECu (with TECu=10^16 electrons per square meter) and is directly related to the signal propagation delay due to the ionosphere (in figure: delay on GPS L1 frequency).
The Sun's radiation ionizes the Earth's upper atmosphere, the ionosphere, located from about 60km to 1000km above the Earth's surface.The ionization process in the ionosphere produces ions and free electrons. These electrons perturb the propagation of the GNSS (Global Navigation Satellite System) signals by inducing a so-called ionospheric delay.
See http://stce.be/newsletter/GNSS_final.pdf for some more explanations ; for detailed information, see http://gnss.be/ionosphere_tutorial.php
Presentation, in French given at the open doors of the Space Pole, Brussels, Belgium, 2014
http://www.spaceweather.eu/en/repository/show?id=542
Presentation, in Dutch given at the open doors of the Space Pole, Brussels, Belgium, 2013.
http://www.spaceweather.eu/en/repository/show?id=543
Presentation, in French given at the open doors of the Space Pole, Brussels, Belgium, 2014
http://www.spaceweather.eu/en/repository/show?id=544
Presentation, in French given at the open doors of the Space Pole, Brussels, Belgium, 2014
http://www.spaceweather.eu/en/repository/show?id=545
Presentation, in French given at the open doors of the Space Pole, Brussels, Belgium, 2014
http://www.spaceweather.eu/en/repository/show?id=546
Presentation, in Dutch given at the open doors of the Space Pole, Brussels, Belgium, 2014
http://www.spaceweather.eu/en/repository/show?id=547
Presentation, in French given at the open doors of the Space Pole, Brussels, Belgium, 2014
http://www.spaceweather.eu/en/repository/show?id=549
Presentation, in Dutch given at the open doors of the Space Pole, Brussels, Belgium, 2014
http://www.spaceweather.eu/en/repository/show?id=548
Presentation, in Dutch given at the open doors of the Space Pole, Brussels, Belgium, 2014
http://www.spaceweather.eu/en/repository/show?id=550
Presentation, in Dutch, given at the open doors of the Space Pole, Belgium, 2014
http://www.spaceweather.eu/en/repository/show?id=551
Presentation, in Dutch, given at the open doors of the Space Pole, Belgium, 2014
http://www.spaceweather.eu/en/repository/show?id=552
http://www.spaceweather.eu/en/repository/show?id=553
Start : 2016-07-30 - End : 2016-08-07
The 41st COSPAR Scientific Assembly will be held in Istanbul,
Turkey from 30 July - 7 August 2016. This Assembly is open to all
bona fide scientists.
Website:
https://www.cospar-assembly.org/