
The Solar-Terrestrial Centre of Excellence (STCE) is a collaborative network of the Belgian Institute for Space Aeronomy, the Royal Observatory of Belgium and the Royal Meteorological Institute of Belgium.
|
Published by the STCE - this issue : 18 Sep 2015. The Solar-Terrestrial Centre of Excellence (STCE) is a collaborative network of the Belgian Institute for Space Aeronomy, the Royal Observatory of Belgium and the Royal Meteorological Institute of Belgium. |
| Archive of the newsletters | Subscribe to this newsletter by mail |
The total solar eclipse observed in March 2015 caught a lot of people's attention, especially as the path of totality passed over most of Northern Europe. There was a great deal of fan-fair and plans to observe the eclipse from the ground. However, due to heavy cloud cover, a lot of people had to turn to space-based observations, such as those made by the sun watching extreme-ultraviolet imager: SWAP, on board the European Space Agency's PROBA2 satellite, which images the Sun from the vantage point of a polar Earth orbit, away from pesky cloud cover. More information about the March eclipse can be found at http://proba2.oma.be/total-eclipse-2015 and at http://proba2.oma.be/Eclipse-Analysis-2015
SWAP observes the solar corona in a passband centered on a wavelength of 17.4 nm. The structures seen in SWAP images have a temperature of approximately 1 million degrees. More information about the SWAP instrument is available at http://proba2.oma.be/about/SWAP
It may come as some surprise, especially for those in Europe, that there was another eclipse observed on 13 September 2015. Whether you are able to observe an eclipse from the ground depends on your geographic location, in contrast to the March eclipse which was seen from Northern Europe and the Arctic regions, the September eclipse was observed in the southern hemisphere from Antarctica and southern Africa. In any given year the Earth will experience at least 2 solar eclipses due to the Earth and Moon's orbit.
Although the eclipse was not visible from Europe, it was once again clearly observed with the SWAP imager on board the European Space Agency's PROBA2 satellite. An image of the eclipse from SWAP can be seen underneath.
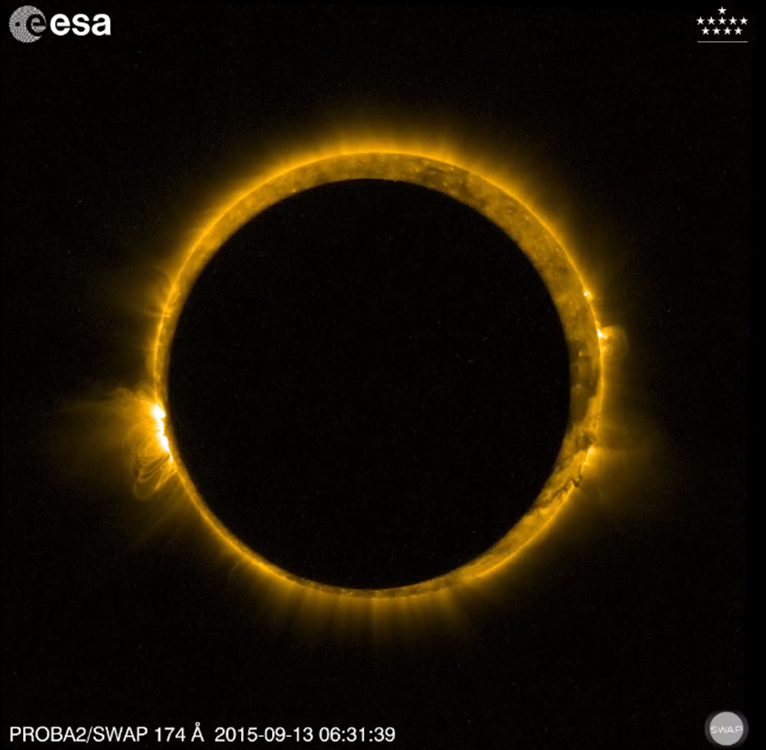
Those with a keen eye for detail, may notice a few subtle differences between the annular eclipse observed last Sunday (13 September; below, left) and the total eclipse from earlier this year (20 March; below, right), the most striking being the apparent size of the Moon. In September, the Moon looked much smaller.
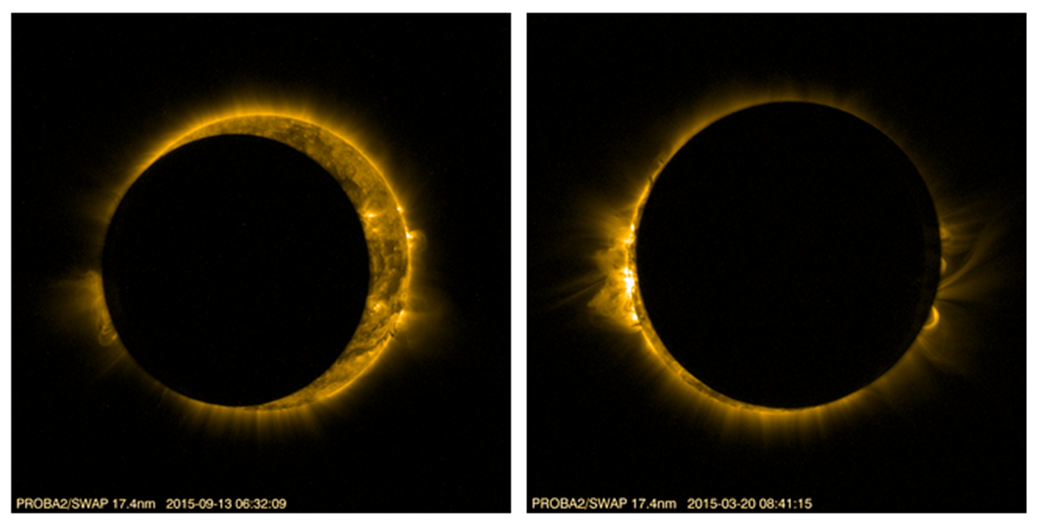
Annular eclipses only occur when the Moon is at apogee, that is, when the Moon is furthest from the Earth. The Moon's orbit is elliptical rather than a perfect circle around the Earth, so from the ground, the relative sizes of the Moon and the Sun vary according to where the Moon is in its orbit. More information about this phenomenon can be found at http://www.timeanddate.com/astronomy/moon/lunar-perigee-apogee.html
So why does the eclipse appear as a partial eclipse from the Earth, but as an annular eclipse from the perspective of SWAP? The center of the Moon's shadow was located some number of kilometers above (from the perspective of an observer on the ground) the south pole. PROBA2's orbit, at about 700 km above the Earth's surface was the right height to pass through this central shadow region where the eclipse is truly annular. From a vantage point on the ground, however, an observer was not in this central shadow, so the disk of the Moon didn't pass entirely over the disk of the Sun, and the eclipse was a partial one, as illustrated at http://eclipse.gsfc.nasa.gov/SEplot/SEplot2001/SE2015Sep13P.GIF
The next total solar eclipse observed from the ground will be observed in 08 March 2016 from South-East Asia and North-East Australia, and then closely followed by another observed in 21 August 2017 from North America.
This item was written by Matthew West and the PROBA2-team and can be read at http://proba2.oma.be/annular-eclipse-2015
Project Call: ASGARD challenges students to think of a science experiment, build it a space proof version, test it, fly it on a stratospheric balloon and analyse the results.
Exciting - challenging - act as a real scientist - serious fun
Spread the news to interested students and schools!
Check
http://www.esero.be/_WP/?page_id=218
Solar flare activity fluctuated between quiet and low during the week.
In order to view the activity of this week in more detail, we suggest to go to the following website from which all the daily (normal and difference) movies can be accessed: http://proba2.oma.be/ssa
This page also lists the recorded flaring events.
A weekly overview movie can be found here:
http://proba2.sidc.be/swap/data/mpg/movies/weekly_movies/weekly_movie_2015_09_07.mp4 (SWAP week 285).
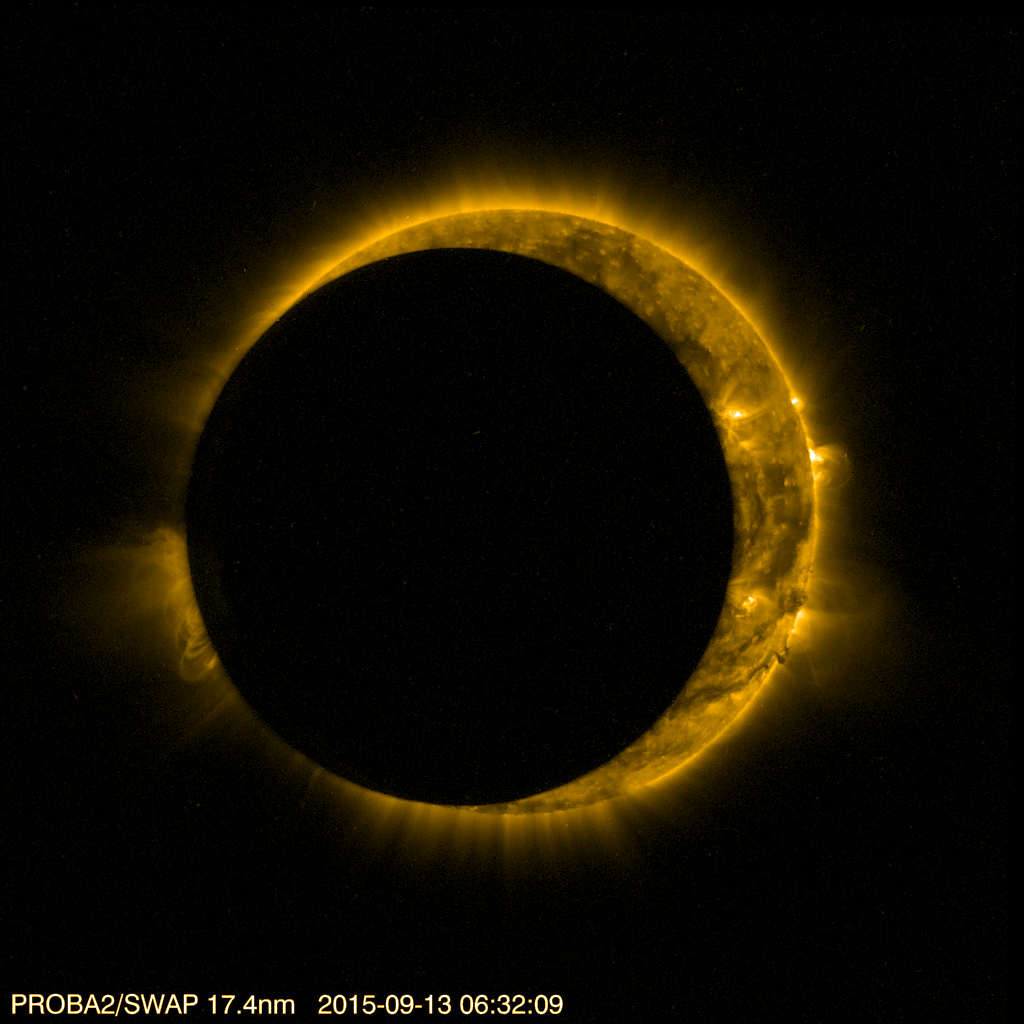
The Sun has been particularly quiet this week, no M-class flares or above were observed.
However, one specific event drew our attention: On Sunday 13 September, the PROBA2 satellite witnessed three partial solar eclipses. The SWAP image provided below shows a snapshot of one of the eclipses. Images and movies of the events can be found on the PROBA2 website through the following link:
http://proba2.oma.be/Events/2015-Sep-13-SolarEclipse/
The complete daily SWAP movie from that day can be found here:
http://proba2.sidc.be/swap/data/mpg/movies/20150913_swap_movie.mp4
Solar activity was very low this week: the strongest reported flare was only a C-class flare. There was no further flaring activity above the B level.
No Earth directed CMEs were observed during this week.
A partial halo CME, associated with the filament which erupted from the south-east quadrant of the Sun on September 4, arrived at the Earth at about 12 UT on September 7. The arrival of the ICME induced a geomagnetic storm on September 7 and September 9.
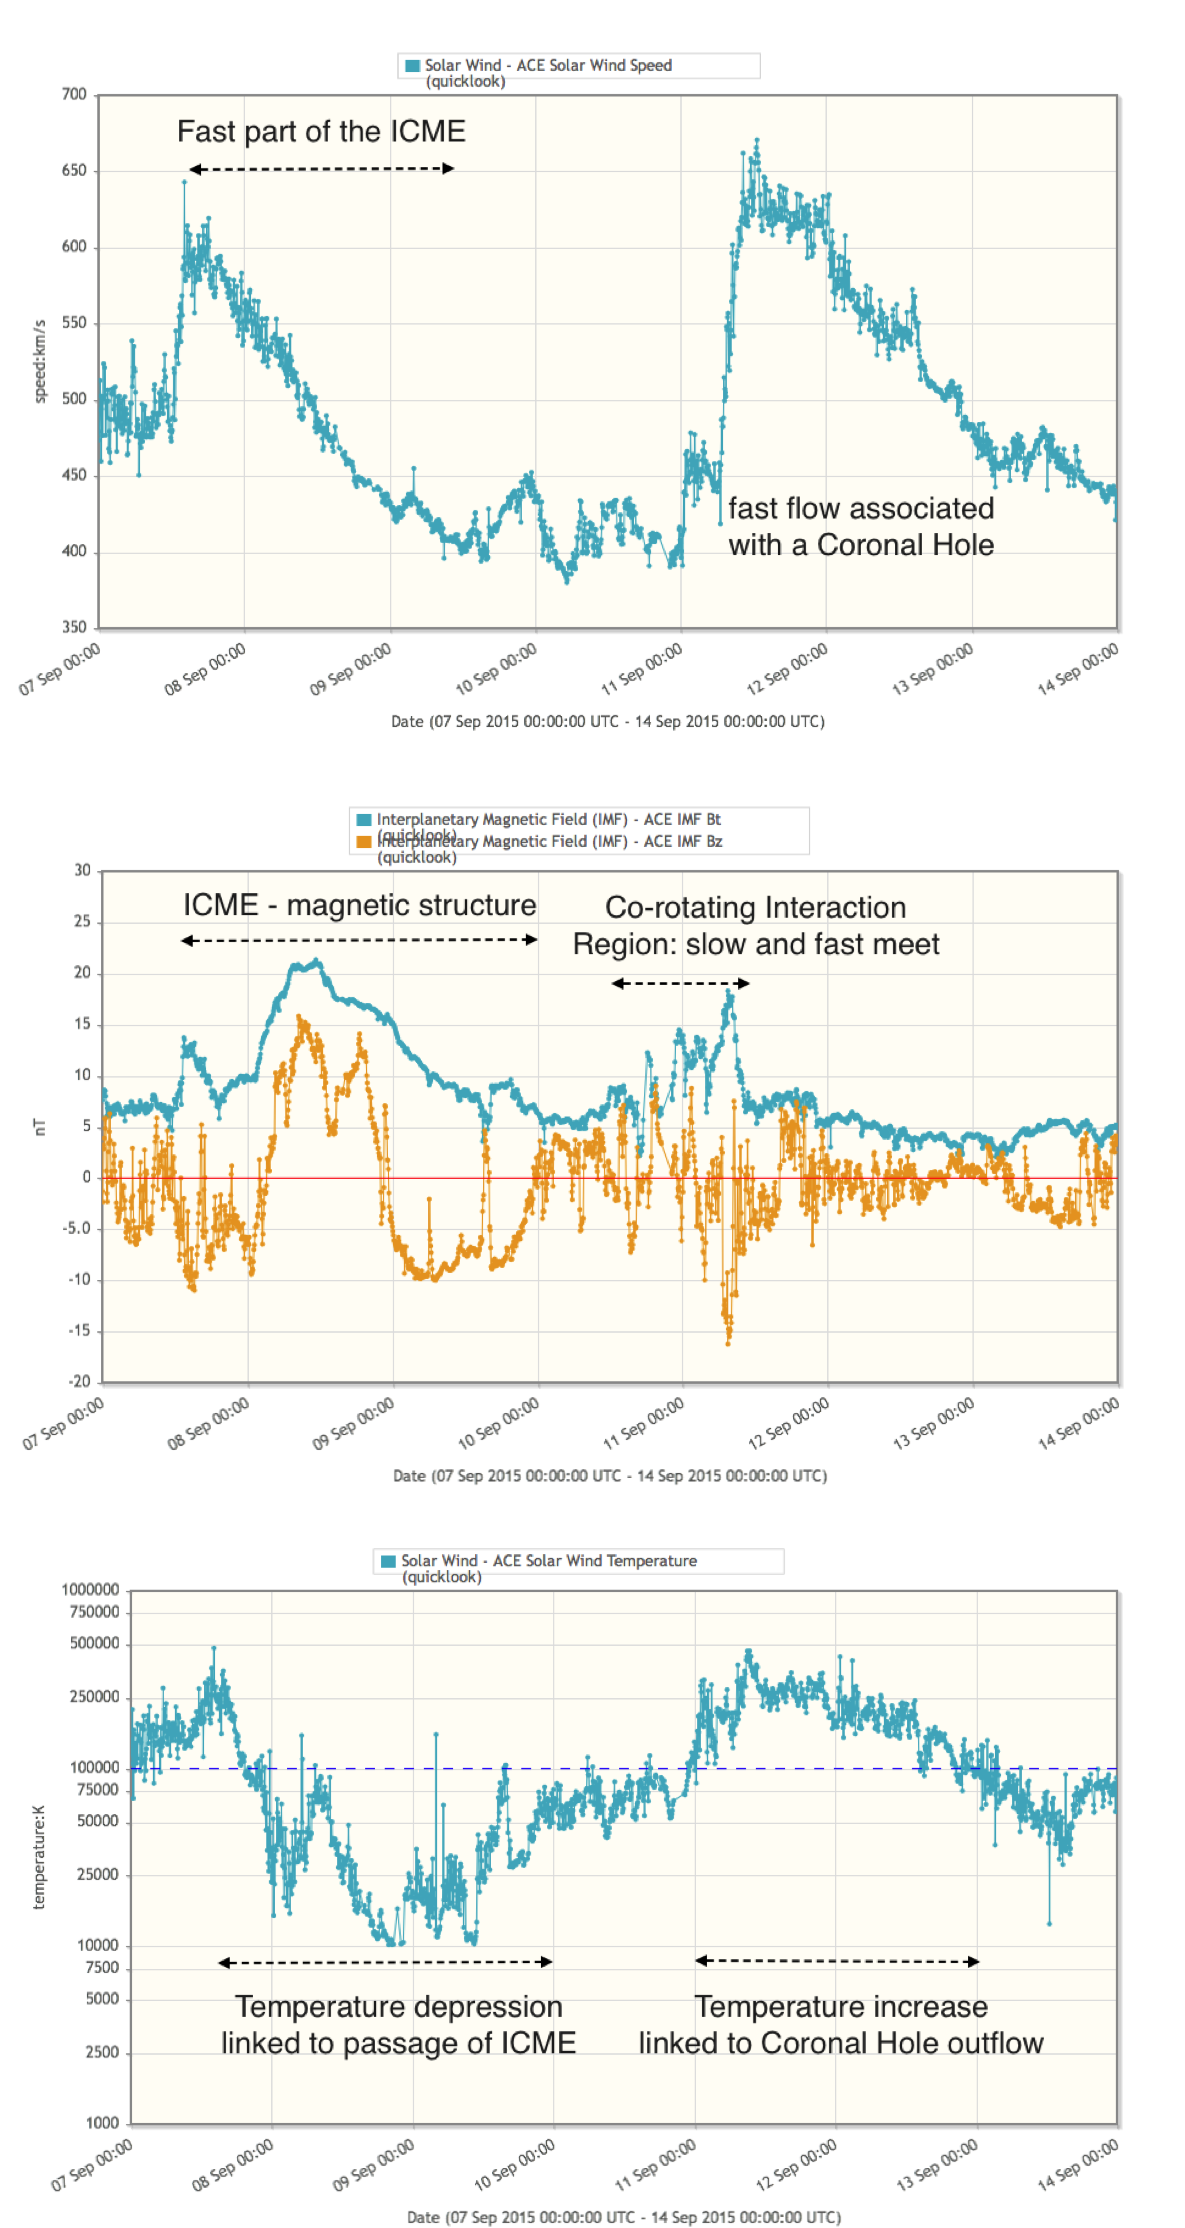
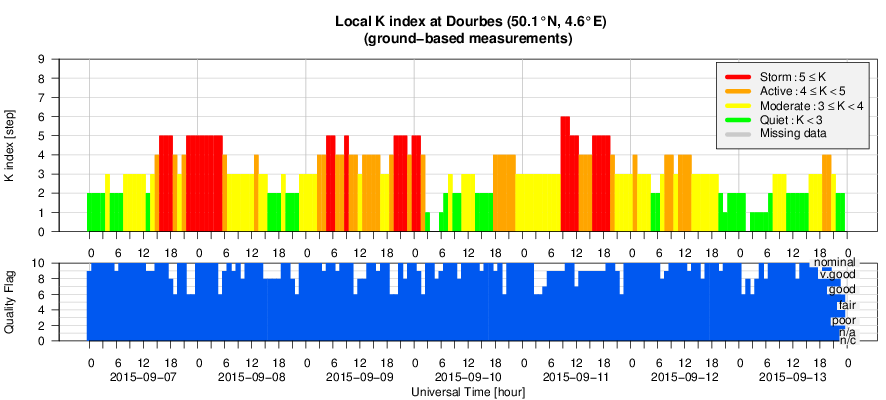
On September 7, ACE data showed a simultaneous increase of the solar wind speed from 500 km/s up to about 600 km/s, and the increase of the interplanetary magnetic field magnitude to a value of about 22 nT on September 8. The Bz component of the interplanetary magnetic field had long southward intervals (down to -12nT) on September 7. This rather strong southward field and the fast solar wind produced long lasting geomagnetic storm, NOAA reported Kp=6 and local stations Dourbes and Izmiran reported K=5.
On September 09, the Bz component of the interplanetary magnetic field had long southward intervals (of about -10 nT) which induced the geomagnetic storm conditions, NOAA reported Kp=6 and local station Dourbes reported K=5.
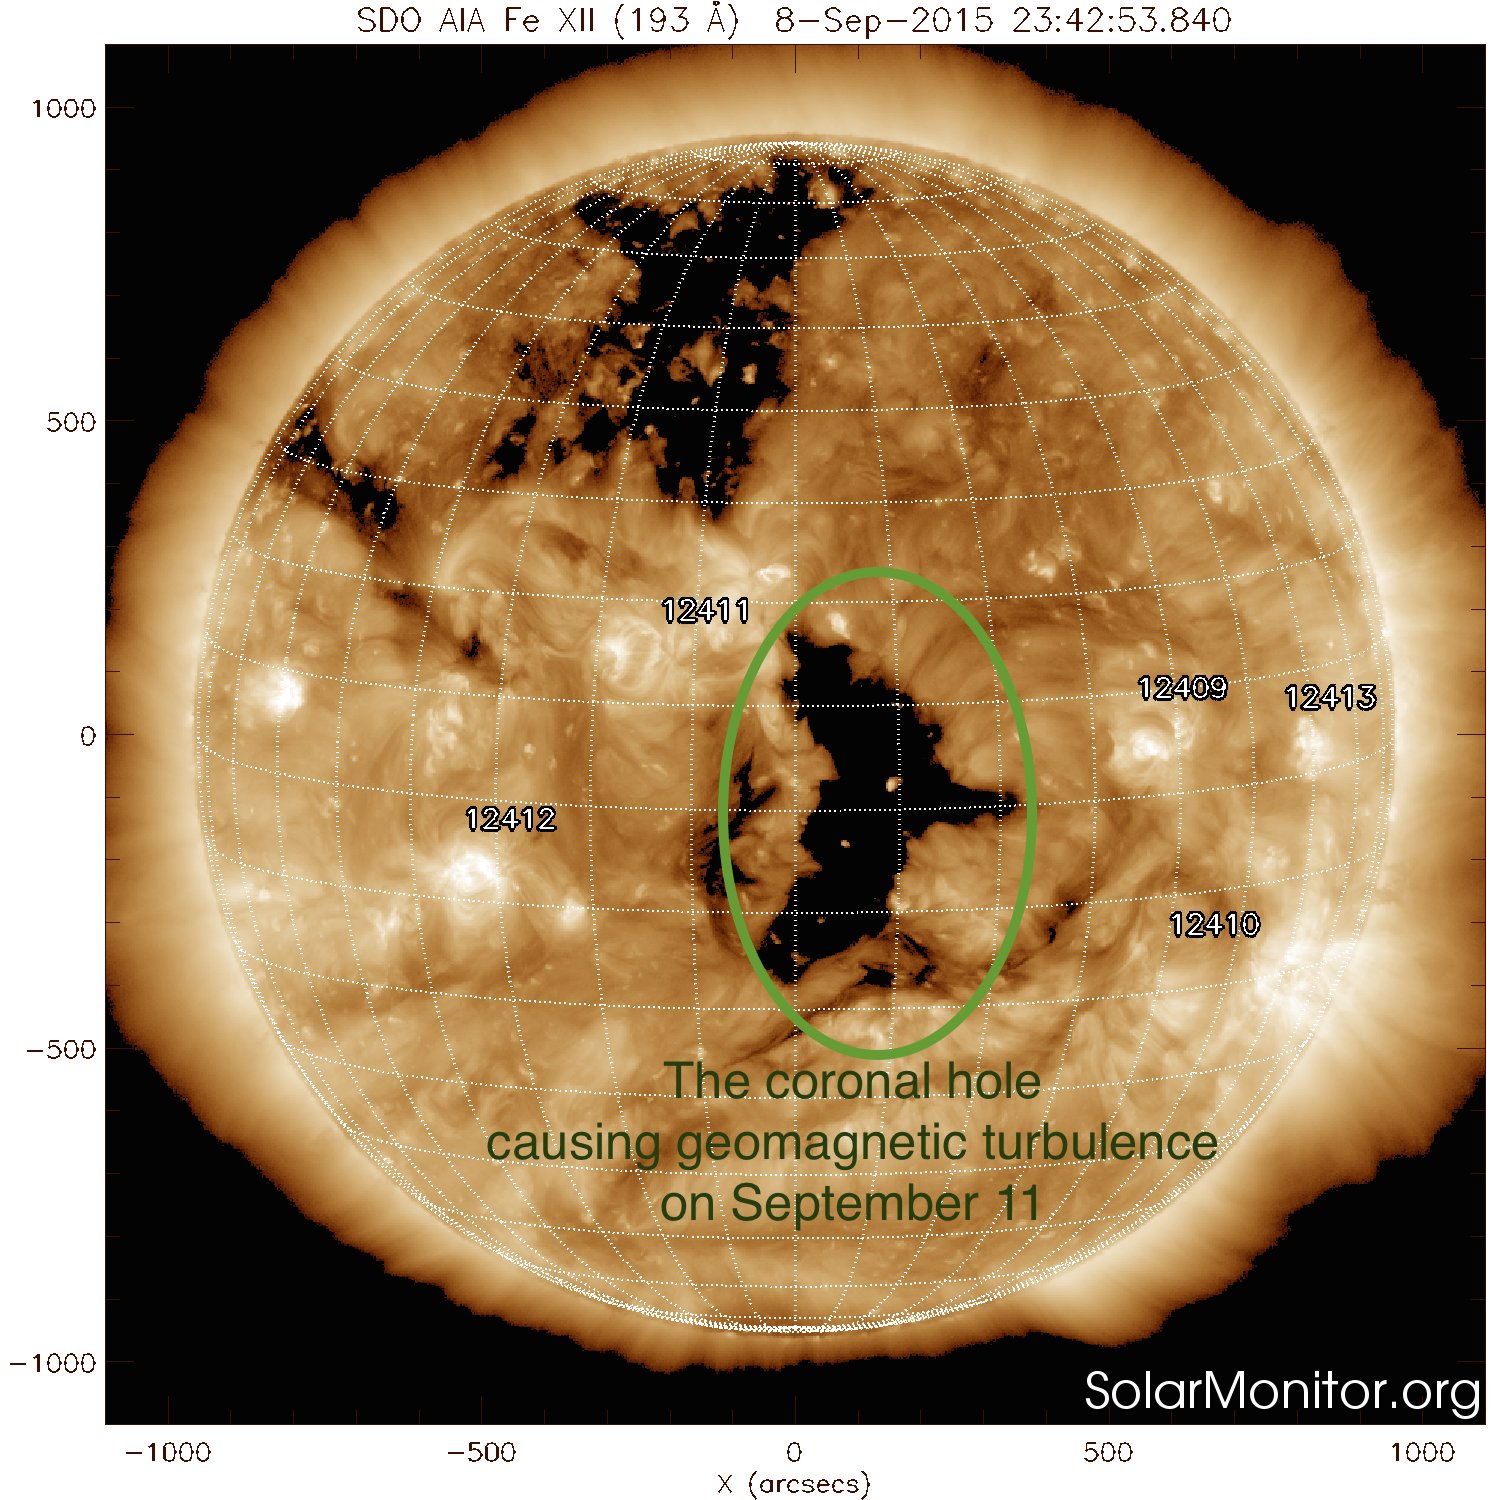
The fast flow associated with the elongated equatorial coronal hole (20S to 20N) which crossed central meridian in the morning of September 08, arrived at the Earth on September 11, around 06:40 UT. The maximum speed of this fast flow was about 700 km/s (reported around the mid-day of September 11). The arrival of the fast flow induced geomagnetic storm conditions, NOAA reported Kp=7 and local stations Dourbes and Izmiran reported K=6 on September 11.
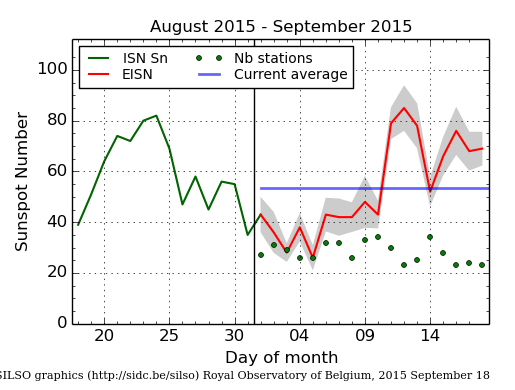
The daily Estimated International Sunspot Number (EISN, red curve with shaded error) derived by a simplified method from real-time data from the worldwide SILSO network. It extends the official Sunspot Number from the full processing of the preceding month (green line). The plot shows the last 30 days (~ one solar rotation). The horizontal blue line shows the current monthly average, while the green dots give the number of stations included in the calculation of the EISN for each day.
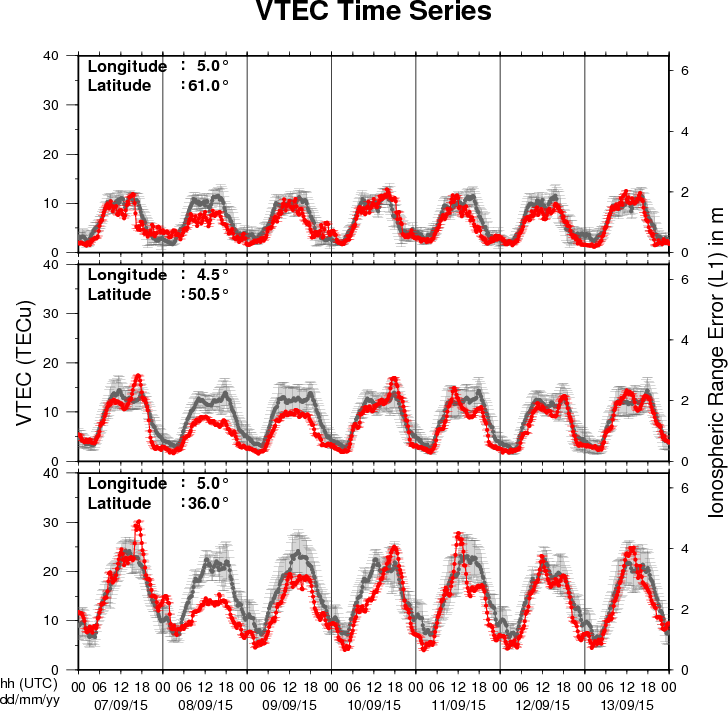
The figure shows the time evolution of the Vertical Total Electron Content (VTEC) (in red) during the last week at three locations:
a) in the northern part of Europe(N61°, 5°E)
b) above Brussels(N50.5°, 4.5°E)
c) in the southern part of Europe(N36°, 5°E)
This figure also shows (in grey) the normal ionospheric behaviour expected based on the median VTEC from the 15 previous days.
The VTEC is expressed in TECu (with TECu=10^16 electrons per square meter) and is directly related to the signal propagation delay due to the ionosphere (in figure: delay on GPS L1 frequency).
The Sun's radiation ionizes the Earth's upper atmosphere, the ionosphere, located from about 60km to 1000km above the Earth's surface.The ionization process in the ionosphere produces ions and free electrons. These electrons perturb the propagation of the GNSS (Global Navigation Satellite System) signals by inducing a so-called ionospheric delay.
See http://stce.be/newsletter/GNSS_final.pdf for some more explanations ; for detailed information, see http://gnss.be/ionosphere_tutorial.php
Start : 2015-10-26 - End : 2015-10-29
Erupting prominences/filaments, surges, flares, and coronal mass
ejections (CMEs) are prominent examples of the dynamic Sun.
Multi-wavelength and multi-instrument observations have the
potential to reveal highly energetic physical processes on the Sun
reaching from the photosphere, over the chromosphere and the
transition region, to the corona and beyond. Solar physicists have
nowadays access to a suite of new ground-based observing facilities
including, for example, the 1.5-meter GREGOR solar telescope at the
Observatorio del Teide, Tenerife, Spain, the European Low Frequency
Array (LOFAR), the Atacama Large Millimeter/Submillimeter Array
(ALMA) in Chile, and the Coronal Multi-Channel Polarimeter for
Slovakia (COMP-S) at Lomnicky Peak Observatory. A powerful fleet of
space missions, for example, the Reuven Ramaty High Energy Solar
Spectroscopic Imager (RHESSI), the Japanese Hinode, and the Solar
Dynamics Observatory (SDO), adds more capabilities to investigate
magnetic fields, complex plasma flows, and accelerated particle,
and thermal properties of solar eruptive events. In the tradition
of the series of »Potsdam Thinkshops«, we
invite instrument specialists, observers, modellers, and theorists
to exchange ideas, to stimulate discussion, to initiate future
collaborations among participants, and to attract new users of
instruments by showcasing the capabilities. The aim is to make
progress towards a comprehensive description of solar eruptive
events effectively aggregating their global properties as well as
their highly dynamic fine structure. Thinkshop 12 takes place at
the science park »Albert Einstein«, home to
AIP's Great Refractor and the Solar Observatory Einstein Tower at
the Telegraphenberg.
Website:
https://thinkshop.aip.de/12/cms/
Start : 2015-10-26 - End : 2015-10-29
The IRIS-5 workshop will be conducted at the Inter-University
Centre for Astronomy and Astrophysics (IUCAA), Pune, India from
October 26-29, 2015. This workshop is mainly aimed at the
participants who could not attend IRIS-4, which is being held at
Boulder, USA. Therefore, set up of the IRIS-5 workshop would be
essentially be very similar to that of IRIS-4.
The main aim of the workshop is to introduce the Interface
Region Imaging Spectrometer (IRIS) to students and young post docs.
This would be done through tutorials on IRIS data analysis, physics
of optically thick radiative transfer, MHD simulations of the solar
atmosphere related to IRIS and hydrodynamic simulations of flares.
There will be lectures as well as hands on sessions.
Website:
http://www.iucaa.ernet.in/~solar/Welcome.html
Start : 2015-11-09 - End : 2015-11-11
The fundamentally most important source of inner heliospheric
plasma physics and space weather is the active Sun, its solar
active region eruptions. Prediction of the evolution and influence
of solar active regions on solar storms in the near-Earth
environment is of particular interest to several forecasting
institutions, industrial stakeholders, and the public in
general.
State-of-the-art solar storm prediction tools are limited to
monitoring solar active regions, registering eruptions and mass
ejections while attempting, then, at extrapolating subsequent
evolution and spatio-temporal propagation: no realistic
physics-based and data-driven synthesis tool exists, which is
capable of predicting when a solar flare will be triggered, or when
a Coronal Mass Ejection will be launched into inter-planetary
space. In short, we are not yet able to answer the question: When
and why do solar storms launch?
Our meeting will be focused around initiation of space weather
events at the Sun. We will discuss and develop three major
challenges, and we aim to develop a draft resolution road-map for
those challenges during the meeting.
Website:
https://indico.nbi.ku.dk/conferenceDisplay.py?confId=817
Start : 2015-11-13 - End : 2015-11-13
With the launch of NASA's Solar Dynamics Observatory (SDO)
mission on 02/11/2010, researchers in solar physics have entered
the era of Big Data. The Atmospheric Imaging Assembly (AIA)
instrument on SDO provides imaging data and the Helioseismic and
Magnetic Imager (HMI) instrument on SDO provides magnetic field
data. Both instruments record data at a high spatial resolution and
a time cadence, amounting to about 1 Petabyte of scientific data
each year. The Big Data challenges in Solar Astronomy are expected
to grow even further with the inauguration of the NSF funded Daniel
K. Inouye Solar Telescope (DKIST), currently under construction in
Hawaii. This telescope is expected to generate: 3-5 Petabytes of
data per year.
Start : 2016-06-27 - End : 2016-07-01
Website:
http://www.issibern.ch/program/workshops.html