
The Solar-Terrestrial Centre of Excellence (STCE) is a collaborative network of the Belgian Institute for Space Aeronomy, the Royal Observatory of Belgium and the Royal Meteorological Institute of Belgium.
|
Published by the STCE - this issue : 23 Oct 2015. The Solar-Terrestrial Centre of Excellence (STCE) is a collaborative network of the Belgian Institute for Space Aeronomy, the Royal Observatory of Belgium and the Royal Meteorological Institute of Belgium. |
| Archive of the newsletters | Subscribe to this newsletter by mail |
This year's team-building day (22 October) brought us to the geophysical station of Membach, in the eastern part of Belgium ("Hautes Fagnes"). Indeed, in 2015, the station celebrated its 40 years of seismic measurements and 20 years of continuous monitoring of gravity variations. A very long tunnel brought the participants 48 meters under the ground to rooms where the gravimeters and seismometers were installed. It was tempting to use one of the helium bottles of the superconducting gravimeter for further experimenting...
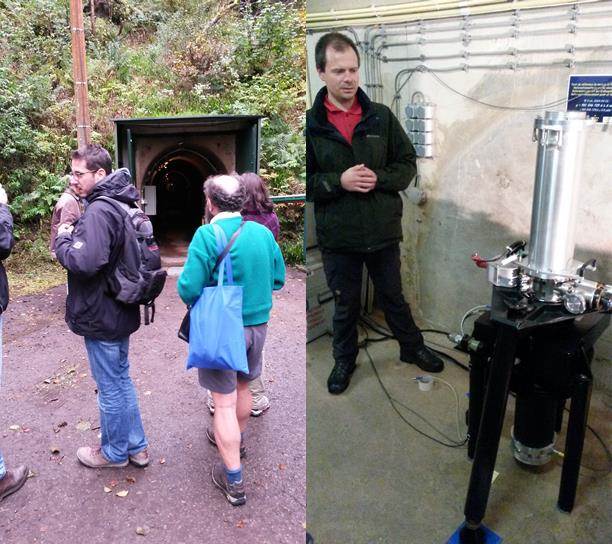
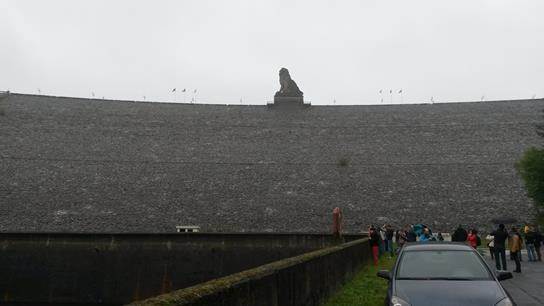
After this very instructive introduction to gravimetry and seismology, we went for lunch to the restaurant "Le Lac de la Gileppe", a 77-meter high tower whose glass top provides a breath-taking view on the barrage and the wide surroundings. During the fine lunch, some of the topics of discussion included the taste of honey in combination with cheese, the effects of mixing softdrinks with wine, the fact that sparkling water is coming out of Romanian water wells, and the famous moving stones in California's Death Valley.

We then visited the barrage itself, and went all the way down to the 264 meters wide base of the barrage. The barrage is being used as both a water-collection and hydroelectric power plant. The bus brought us at the base entrance, and so we did not have to descend the hundreds of stairs and go back to the top: This would otherwise have been an extraordinary team-building exercise! We also got a demo of the tremendous power that this barrage can unleash, and visited the control center.

A big "Thank you" to the people of the Seismology-Gravimetry Service of the ROB for the organization and all for making this a most memorable day!
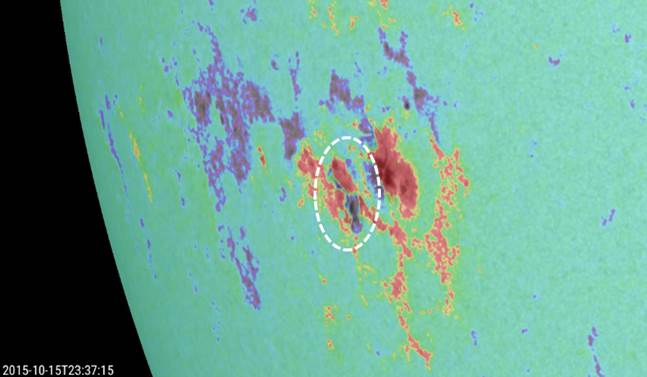
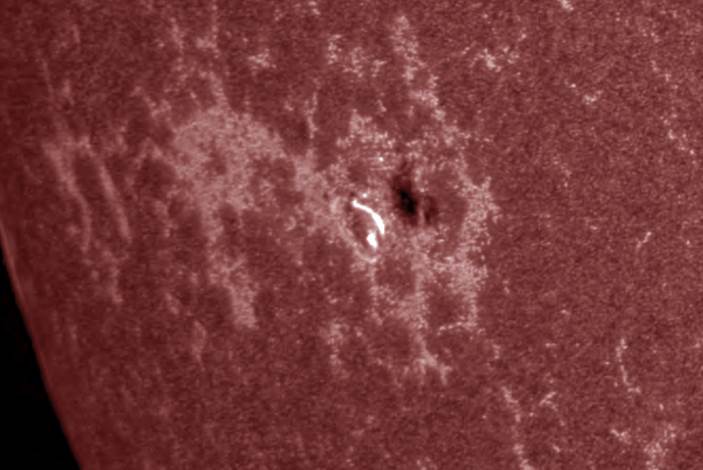
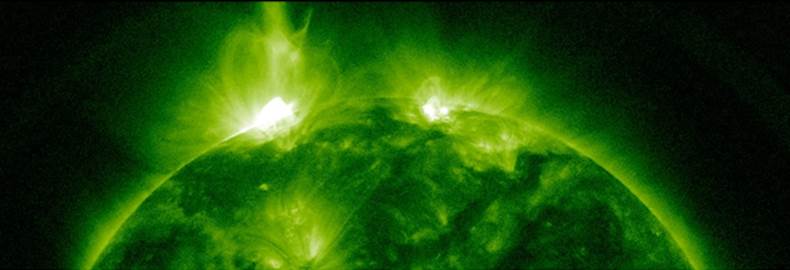
The week started with a few small and flare quiet sunspot regions. By 13 October, NOAA 2434 had rounded the southeast limb. It developed a delta structure southeast of the main spot and was the source of several C-class flares as well as two M1.1 flares on 15 (at 23:31UT) and 16 (at 06:16UT) October. The images underneath show the delta structure (sunspots of opposite magnetic polarity in the same penumbra), as well as an image in extreme ultraviolet (EUV; AIA 1700) from the first M1 flare.
The group also developed a small delta to the north of the main spot, but this resulted only in a few low-level C-class flares. NOAA 2434 was followed by another flare active region, NOAA 2437. This group produced 2 M1 flares while it was still at the southeast limb, i.e. late on 17 October at resp. 20:23UT and 20:42UT. The image underneath shows the east limb in EUV at temperatures of several million degrees, about 45 minutes after the pair of M-class flares from NOAA 2437.
In all, 45 C- and 4 M-class flares were recorded during the period, with two-thirds of the C- and all M-class flares concentrated in the 3-day period of 15-17 October. None of the associated coronal mass ejections had an earth directed component. No proton events were observed.

Solar flare activity fluctuated between low and moderate during the week.
In order to view the activity of this week in more detail, we suggest to go to the following website from which all the daily (normal and difference) movies can be accessed:
http://proba2.oma.be/ssa
This page also lists the recorded flaring events.
A weekly overview movie can be found here (SWAP week 290).
http://proba2.oma.be/swap/data/mpg/movies/weekly_movies/weekly_movie_2015_10_12.mp4
Details about some of this week’s events, can be found further below.
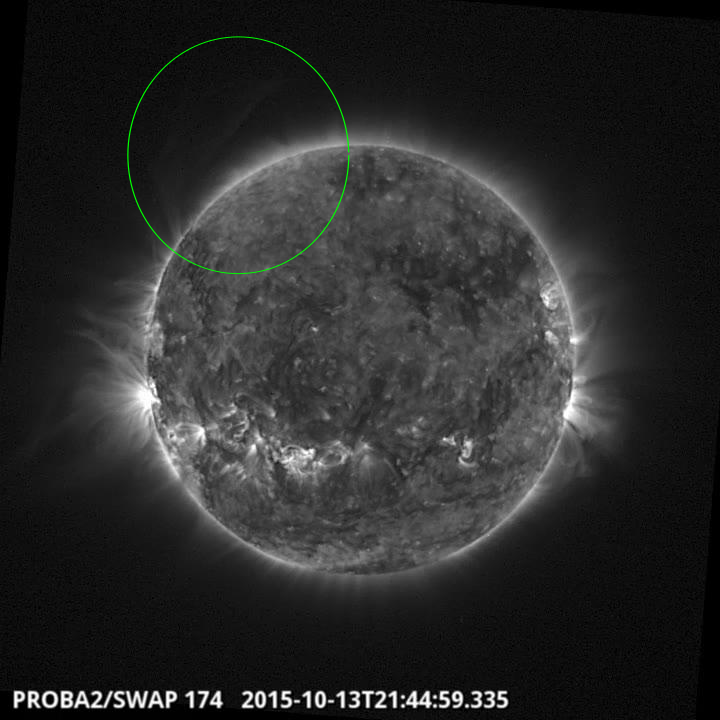
Eruption on the east limb @ 21:44 SWAP image
Find a movie of the event here (SWAP movie)
http://proba2.sidc.be/swap/movies/campaign_movies/20151013/swap_prominence_20151013.mp4
SWAP observed a prominence eruption off of the NorthEast limb.. Due to SWAPs large Field of View,
and the eruption propagating toward the corner of the detector, we were able to track the eruption to over 1.5 Solar Radii, before it passed out of view.
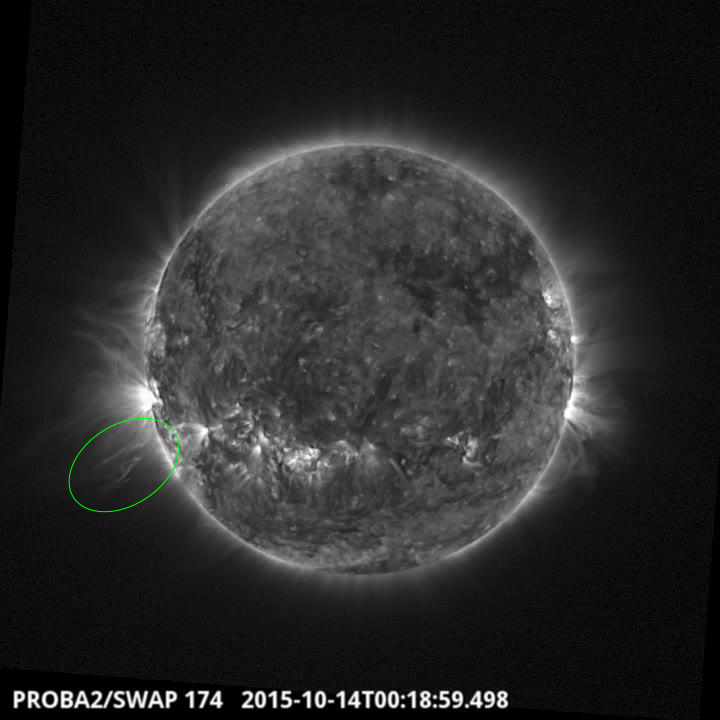
Eruption on the east limb @ 00:18 SWAP image
Find a movie of the event here (SWAP movie)
http://proba2.oma.be/swap/data/mpg/movies/20151014_swap_movie.mp4

Eruption on the east limb @ 07:41 SWAP image
Find a movie of the event here (SWAP movie)
http://proba2.oma.be/swap/data/mpg/movies/20151016_swap_movie.mp4
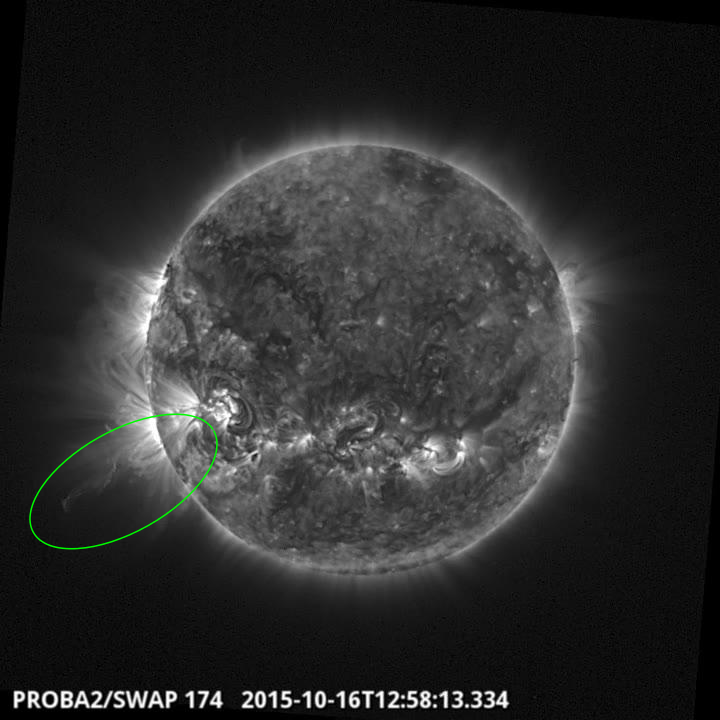
Eruption on the east limb @ 12:58 SWAP image
Find a movie of the event here (SWAP movie)
http://proba2.oma.be/swap/data/mpg/movies/20151016_swap_movie.mp4
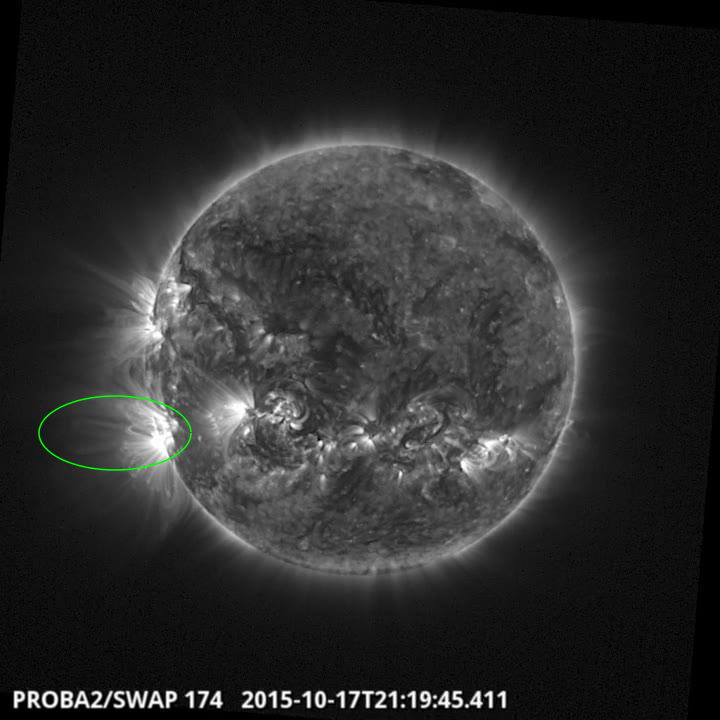
Eruption on the east limb @ 21:18 SWAP image
Find a movie of the event here (SWAP movie)
http://proba2.oma.be/swap/data/mpg/movies/20151017_swap_movie.mp4
| DAY | BEGIN | MAX | END | LOC | XRAY | OP | 10CM | TYPE | Cat | NOAA |
| 15 | 2327 | 2331 | 2337 | S11E50 | M1.1 | SF | III/1 | 51 | 2434 | |
| 16 | 0611 | 0616 | 0620 | S11E46 | M1.1 | SF | 90 | III/2 | 51 | 2434 |
| 17 | 2009 | 2023 | 2028 | M1.1 | 2437 | |||||
| 17 | 2035 | 2042 | 2046 | M1.5 | 2437 |
| LOC: approximate heliographic location | TYPE: radio burst type |
| XRAY: X-ray flare class | Cat: Catania sunspot group number |
| OP: optical flare class | NOAA: NOAA active region number |
| 10CM: peak 10 cm radio flux |
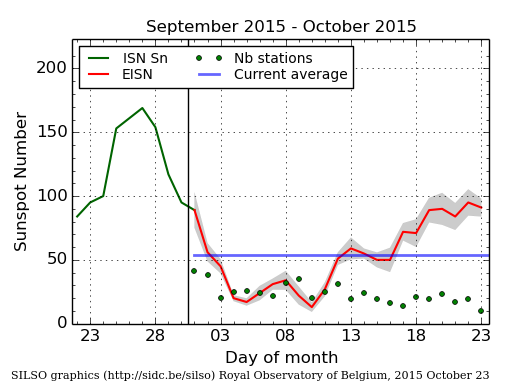
The daily Estimated International Sunspot Number (EISN, red curve with shaded error) derived by a simplified method from real-time data from the worldwide SILSO network. It extends the official Sunspot Number from the full processing of the preceding month (green line). The plot shows the last 30 days (about one solar rotation). The horizontal blue line shows the current monthly average, while the green dots give the number of stations included in the calculation of the EISN for each day.
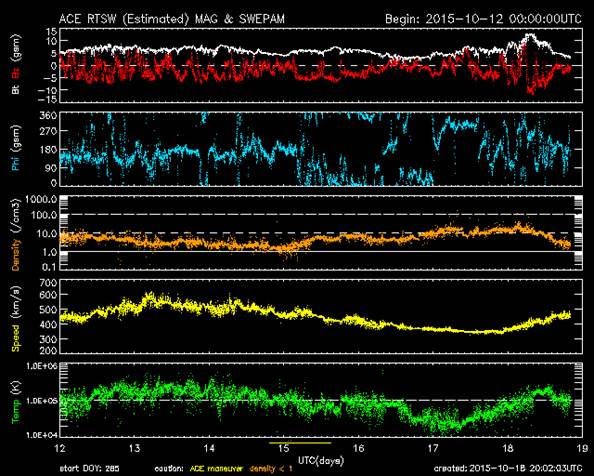
Earth was under the influence of 2 coronal hole wind streams this week. The first one originated from a wide positive coronal hole on the northern solar hemisphere.
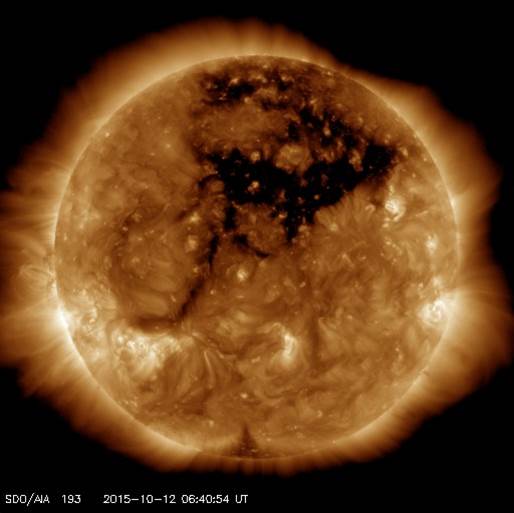
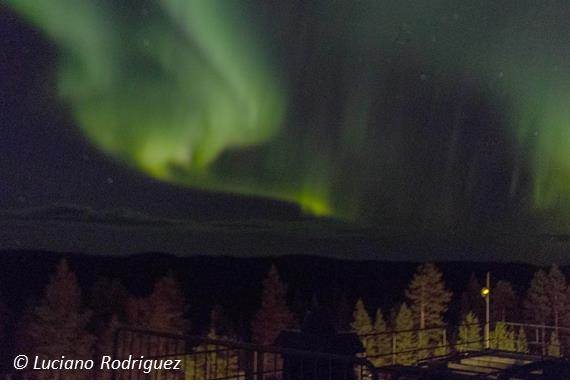
The related high speed stream dominated the earth environment from 12 to 14 October, with wind speeds close to 600 km/s. On each of these 3 days, local K at Dourbes reached active levels, while Kp reached minor storming (Kp=5). Our STCE colleague Luciano Rodriguez was able to image the aurora associated to the aftermath of the geomagnetic disturbance from Kiruna (Sweden) on 15 October.
Geomagnetic activity then calmed down to mostly quiet to unsettled conditions. Late on 17 October, about a day later than expected, solar wind speed gradually picked up as Earth came under the influence of a moderate speed stream from a trans-equatorial extension of the northern coronal hole. Though wind speeds reached only about 480 km/s (yellow curve in graph underneath), the associated strong southward magnetic field of -12 nT ("Bz"; red curve) pushed both the local and planetary K index to minor storming levels around noon on 18 October.

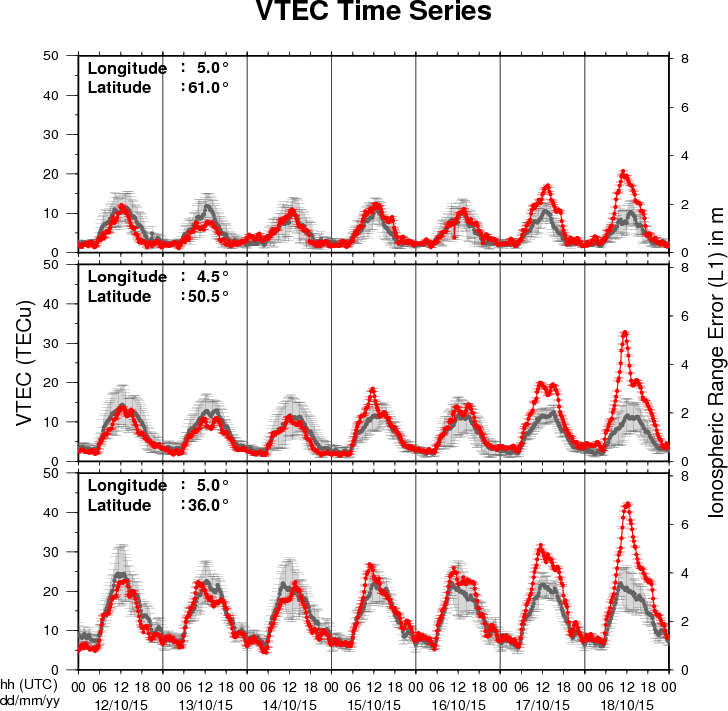
The figure shows the time evolution of the Vertical Total Electron Content (VTEC) (in red) during the last week at three locations:
a) in the northern part of Europe(N61°, 5°E)
b) above Brussels(N50.5°, 4.5°E)
c) in the southern part of Europe(N36°, 5°E)
This figure also shows (in grey) the normal ionospheric behaviour expected based on the median VTEC from the 15 previous days.
The VTEC is expressed in TECu (with TECu=10^16 electrons per square meter) and is directly related to the signal propagation delay due to the ionosphere (in figure: delay on GPS L1 frequency).
The Sun's radiation ionizes the Earth's upper atmosphere, the ionosphere, located from about 60km to 1000km above the Earth's surface.The ionization process in the ionosphere produces ions and free electrons. These electrons perturb the propagation of the GNSS (Global Navigation Satellite System) signals by inducing a so-called ionospheric delay.
See http://stce.be/newsletter/GNSS_final.pdf for some more explanations ; for detailed information, see http://gnss.be/ionosphere_tutorial.php
Start : 2015-10-26 - End : 2015-10-29
Erupting prominences/filaments, surges, flares, and coronal mass
ejections (CMEs) are prominent examples of the dynamic Sun.
Multi-wavelength and multi-instrument observations have the
potential to reveal highly energetic physical processes on the Sun
reaching from the photosphere, over the chromosphere and the
transition region, to the corona and beyond. Solar physicists have
nowadays access to a suite of new ground-based observing facilities
including, for example, the 1.5-meter GREGOR solar telescope at the
Observatorio del Teide, Tenerife, Spain, the European Low Frequency
Array (LOFAR), the Atacama Large Millimeter/Submillimeter Array
(ALMA) in Chile, and the Coronal Multi-Channel Polarimeter for
Slovakia (COMP-S) at Lomnicky Peak Observatory. A powerful fleet of
space missions, for example, the Reuven Ramaty High Energy Solar
Spectroscopic Imager (RHESSI), the Japanese Hinode, and the Solar
Dynamics Observatory (SDO), adds more capabilities to investigate
magnetic fields, complex plasma flows, and accelerated particle,
and thermal properties of solar eruptive events. In the tradition
of the series of »Potsdam Thinkshops«, we
invite instrument specialists, observers, modellers, and theorists
to exchange ideas, to stimulate discussion, to initiate future
collaborations among participants, and to attract new users of
instruments by showcasing the capabilities. The aim is to make
progress towards a comprehensive description of solar eruptive
events effectively aggregating their global properties as well as
their highly dynamic fine structure. Thinkshop 12 takes place at
the science park »Albert Einstein«, home to
AIP's Great Refractor and the Solar Observatory Einstein Tower at
the Telegraphenberg.
Website:
https://thinkshop.aip.de/12/cms/
Start : 2015-10-26 - End : 2015-10-29
The IRIS-5 workshop will be conducted at the Inter-University
Centre for Astronomy and Astrophysics (IUCAA), Pune, India from
October 26-29, 2015. This workshop is mainly aimed at the
participants who could not attend IRIS-4, which is being held at
Boulder, USA. Therefore, set up of the IRIS-5 workshop would be
essentially be very similar to that of IRIS-4.
The main aim of the workshop is to introduce the Interface
Region Imaging Spectrometer (IRIS) to students and young post docs.
This would be done through tutorials on IRIS data analysis, physics
of optically thick radiative transfer, MHD simulations of the solar
atmosphere related to IRIS and hydrodynamic simulations of flares.
There will be lectures as well as hands on sessions.
Website:
http://www.iucaa.ernet.in/~solar/Welcome.html
Start : 2015-11-09 - End : 2015-11-11
The fundamentally most important source of inner heliospheric
plasma physics and space weather is the active Sun, its solar
active region eruptions. Prediction of the evolution and influence
of solar active regions on solar storms in the near-Earth
environment is of particular interest to several forecasting
institutions, industrial stakeholders, and the public in
general.
State-of-the-art solar storm prediction tools are limited to
monitoring solar active regions, registering eruptions and mass
ejections while attempting, then, at extrapolating subsequent
evolution and spatio-temporal propagation: no realistic
physics-based and data-driven synthesis tool exists, which is
capable of predicting when a solar flare will be triggered, or when
a Coronal Mass Ejection will be launched into inter-planetary
space. In short, we are not yet able to answer the question: When
and why do solar storms launch?
Our meeting will be focused around initiation of space weather
events at the Sun. We will discuss and develop three major
challenges, and we aim to develop a draft resolution road-map for
those challenges during the meeting.
Website:
https://indico.nbi.ku.dk/conferenceDisplay.py?confId=817
Start : 2015-11-13 - End : 2015-11-13
With the launch of NASA's Solar Dynamics Observatory (SDO)
mission on 02/11/2010, researchers in solar physics have entered
the era of Big Data. The Atmospheric Imaging Assembly (AIA)
instrument on SDO provides imaging data and the Helioseismic and
Magnetic Imager (HMI) instrument on SDO provides magnetic field
data. Both instruments record data at a high spatial resolution and
a time cadence, amounting to about 1 Petabyte of scientific data
each year. The Big Data challenges in Solar Astronomy are expected
to grow even further with the inauguration of the NSF funded Daniel
K. Inouye Solar Telescope (DKIST), currently under construction in
Hawaii. This telescope is expected to generate: 3-5 Petabytes of
data per year.
Start : 2016-01-24 - End : 2016-01-29
Understanding and being able to forecast space weather is an
increasingly important aspect of our modern technology-reliant
society. This workshop will treat all aspects of space weather,
ranging from solar origins of transient events (CMEs, Flares, CIRs)
to their propagation through the heliosphere and effects on Earth
and planetary bodies, from particle energization to forecasting
particle environment and its effects on technological and
biological systems, as well as solar-cycle effects and coupling of
space weather to atmospheric response. Metrics to assess
predictions will also be discussed. The workshop is structured
along the lines of the COSPAR space weather pathways and will
include invited, contributed talks and posters, as well as panel
discussions and tutorials.
Website:
http://www.cessi.in/ssw/program.html
Start : 2016-06-27 - End : 2016-07-01
Website:
http://www.issibern.ch/program/workshops.html