- Table of Content
- 1.Proton event!
- 2.PROBA2 Observa...
- 3.Review of sola...
- 4.Noticeable Sol...
- 5.Review of geom...
- 6.Geomagnetic Ob...
- 7.Review of iono...
- 8.Future Events
2. PROBA2 Observations (26 Oct 2015 - 1 Nov 2015)
3. Review of solar activity
4. Noticeable Solar Events (26 Oct 2015 - 1 Nov 2015)
5. Review of geomagnetic activity
6. Geomagnetic Observations at Dourbes (26 Oct 2015 - 1 Nov 2015)
7. Review of ionospheric activity (26 Oct 2015 - 1 Nov 2015)
8. Future Events
Proton event!
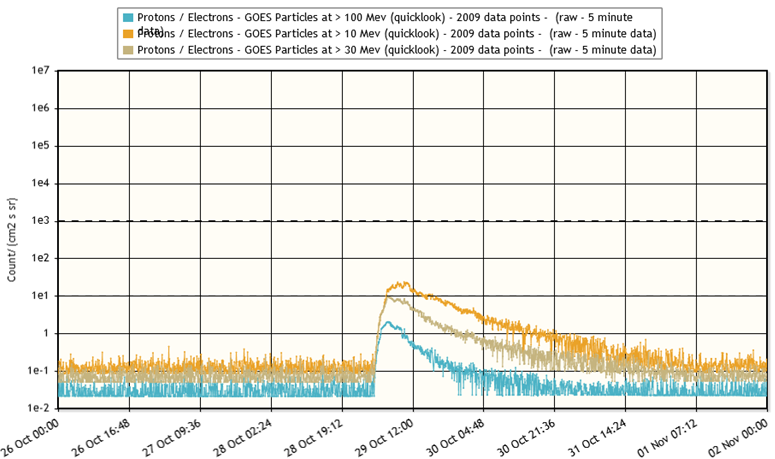
At last, another proton event in 2015! It is only the 4th event so far this year, the other three having occurred resp. on 18, 22 and 27 June (Note 1). With 23 pfu (Note 2), the greater than 10 MeV (Note 3) proton flux constituted only a minor radiation event (Note 4). The largest event this year took place on 22 June (1070 pfu), and the largest proton event so far this solar cycle was recorded on 8 March 2012 (6530 pfu, following an X5 flare from NOAA 1429 - Note 5).
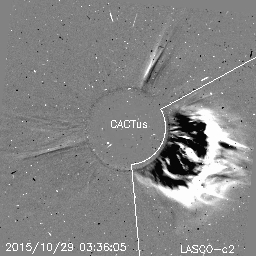
Judging from SDO's AIA193 imagery, the source of this proton event was an eruption on the solar backside, slightly beyond the southwest solar limb as seen from Earth, on 29 October probably between 02:30 and 03:00UT. Unfortunately, due to a lack of STEREO-A imagery, the true location of the eruption cannot be pinpointed. A complex coronal mass ejection (CME) was associated with this event and was first visible in LASCO/C2 imagery at 02:36UT. It had no earth-directed component. Notice the dots on the image: these are no stars, but genuine energetic particles (protons) slamming into the camera's pixels.
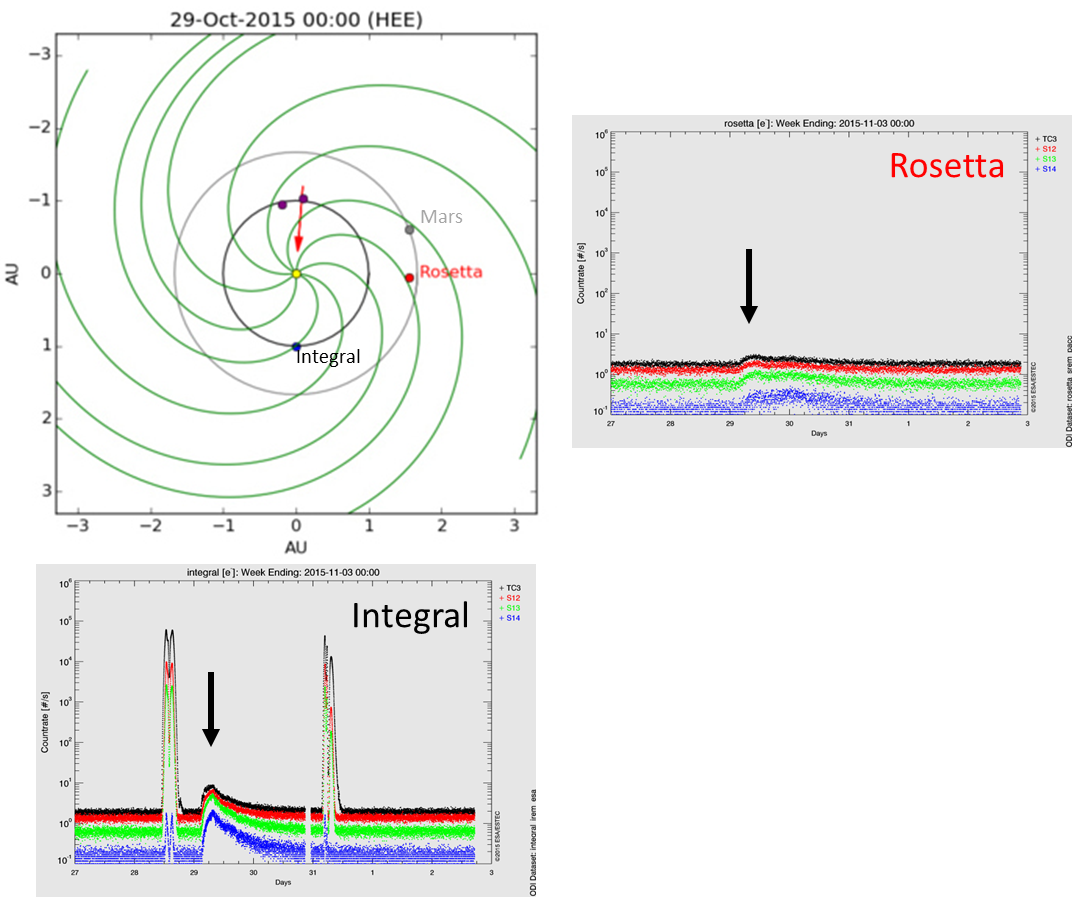
The increased proton flux levels were also recorded by Rosetta spacecraft, which is still near that comet with the unpronounceable name (see the ESA webpage at http://sci.esa.int/rosetta/ for more info). It has an onboard instrument (Note 6) to record energetic particles and which is similar to that on board the Integral satellite (see the ESA webpage at http://sci.esa.int/integral/ ). Integral is orbiting Earth since 2002, passing regularly through the Earth's radiation belts. These can be seen as the spikes in the graph underneath on 28 and 31 October. A side-by-side comparison reveals that a small peak was recorded by Integral on 29 October, whereas Rosetta recorded merely a modest hump (see the black arrows). The reason for the difference is that Integral (and thus Earth) is better connected to the location of the eruption than Rosetta is, with its magnetic footpoint closer to the eruption site than Rosetta's (indicated by the red arrow). This can also be deduced from the Parker spirals,i.e. the magnetic field lines emanating from the Sun.
Notes
Note 1 - The first proton event of 2015 was also discussed in this news item at http://www.stce.be/news/311/welcome.html , containing also more info on proton events and their general effects.
Note 2 - pfu: proton flux unit. This is the number of particles registered per second, per square cm, and per steradian.
Note 3 - 10 MeV = 10 million eV. The eV (electron volt) is a very tiny amount of energy corresponding to about 0.16 billionth of a billionth of a Joule. For comparison, a flying mosquito has a kinetic energy of about a trillion eV (= 1000 billion eV).
Note 4 - Classification of proton events is done by the NOAA's radiation scales at http://www.swpc.noaa.gov/noaa-scales-explanation
Note 5 - A list of proton events is maintained by NASA at http://umbra.nascom.nasa.gov/SEP/
Note 6 - SREM: Standard Radiation Environment Monitor - see http://srem.web.psi.ch/html/srem_home.shtml
PROBA2 Observations (26 Oct 2015 - 1 Nov 2015)
Solar Activity
Solar flare activity fluctuated between low and moderate during the week.
In order to view the activity of this week in more detail, we suggest to go to the following website from which all the daily (normal and difference) movies can be accessed:
http://proba2.oma.be/ssa
This page also lists the recorded flaring events.
A weekly overview movie can be found here (SWAP week 292).
Details about some of this week’s events, can be found further below.
Tuesday Oct 27
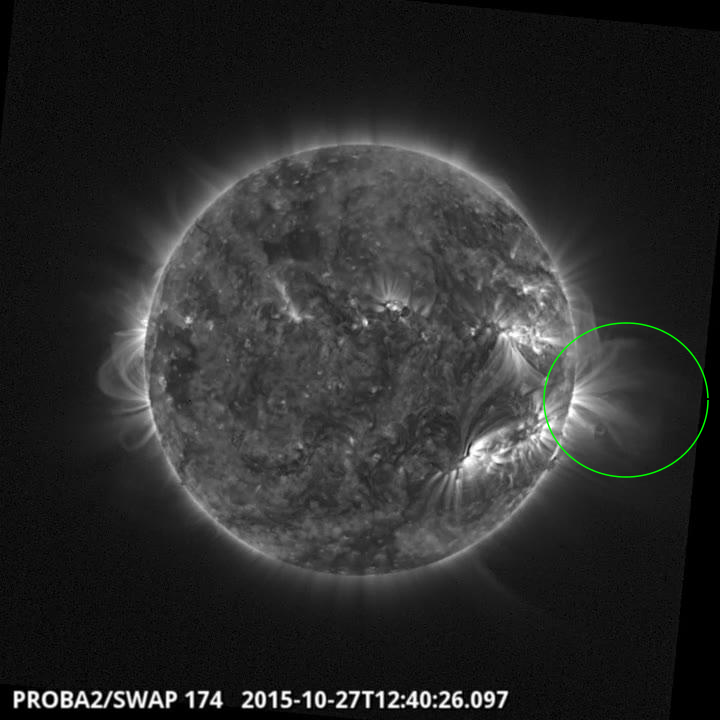
Eruption on the west limb @ 12:50 SWAP image
Find a movie of the event here (SWAP movie)
http://proba2.oma.be/swap/data/mpg/movies/2015/10/20151027_swap_movie.mp4
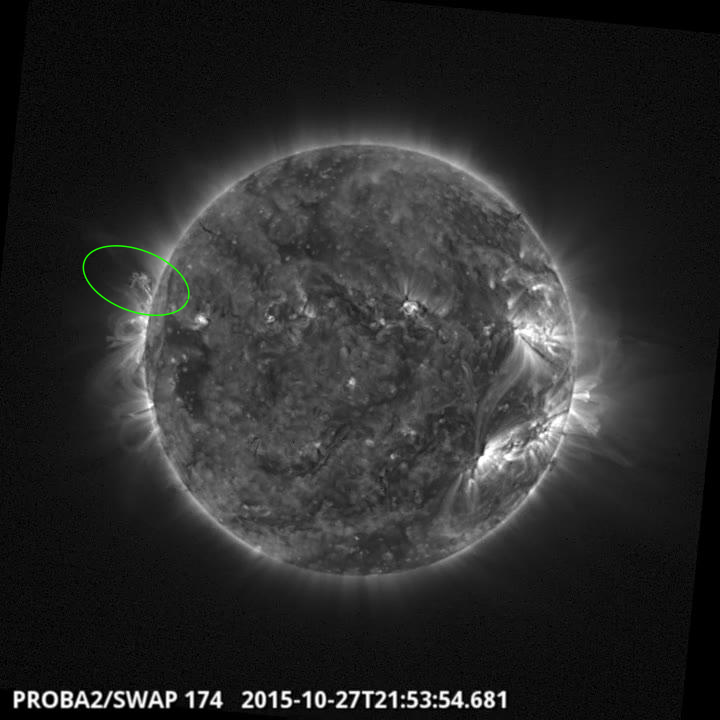
Eruption on the east limb @ 21:53 SWAP image
Find a movie of the event here (SWAP movie)
http://proba2.oma.be/swap/data/mpg/movies/2015/10/20151027_swap_movie.mp4
Thursday Oct 29
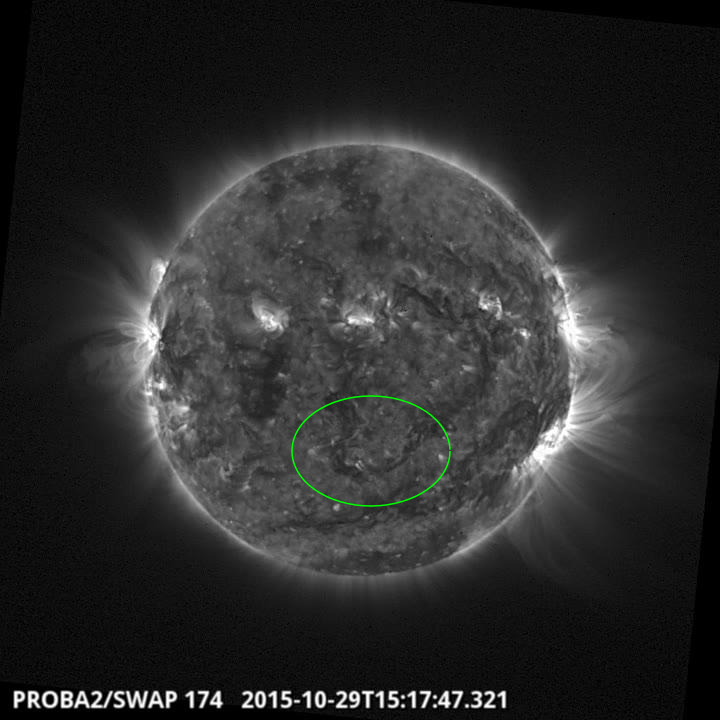
Plasma dynamics in the centre @ 15:17 SWAP image
Find a movie of the event here (SWAP movie)
http://proba2.oma.be/swap/data/mpg/movies/2015/10/20151029_swap_movie.mp4
Review of solar activity
Flares
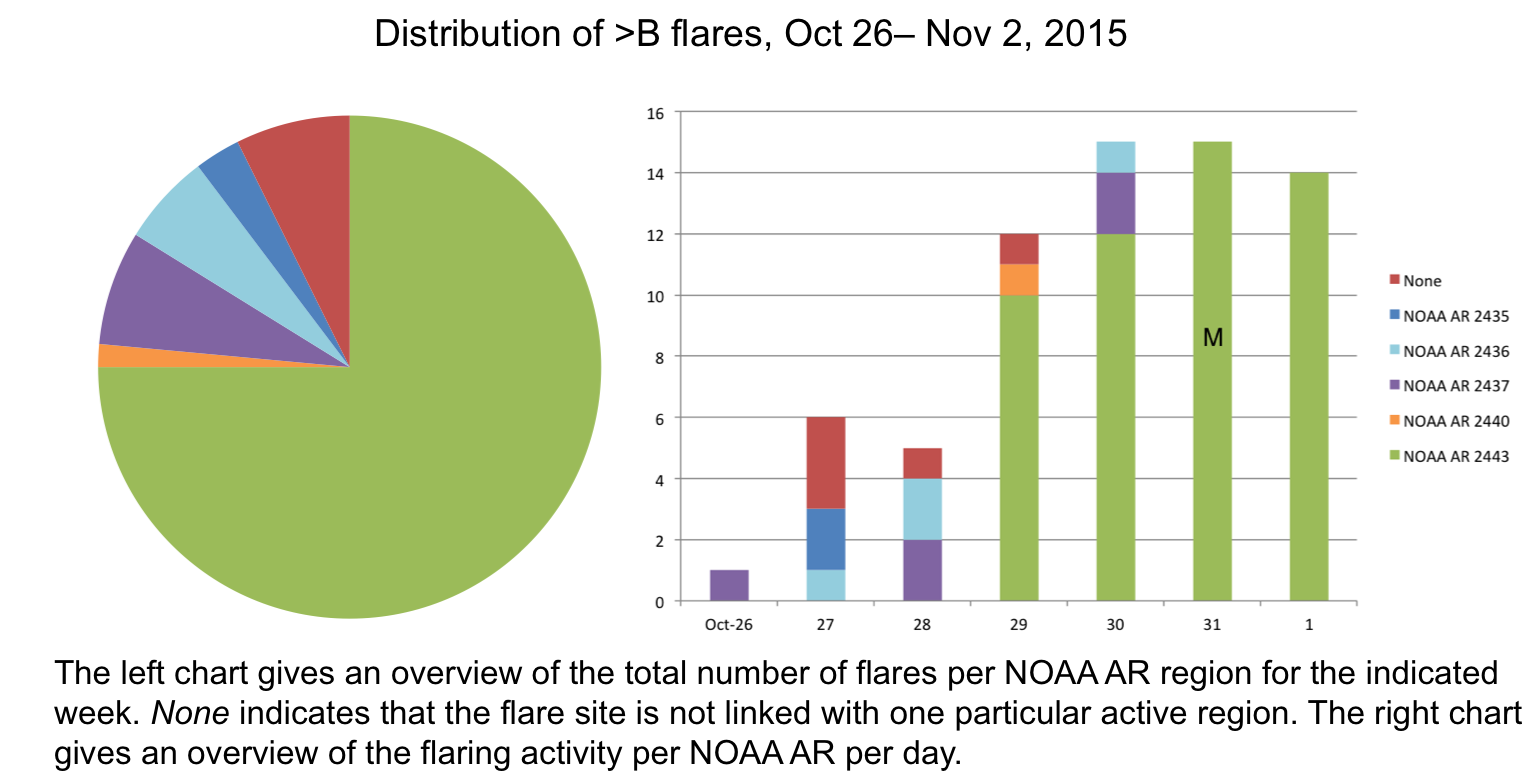
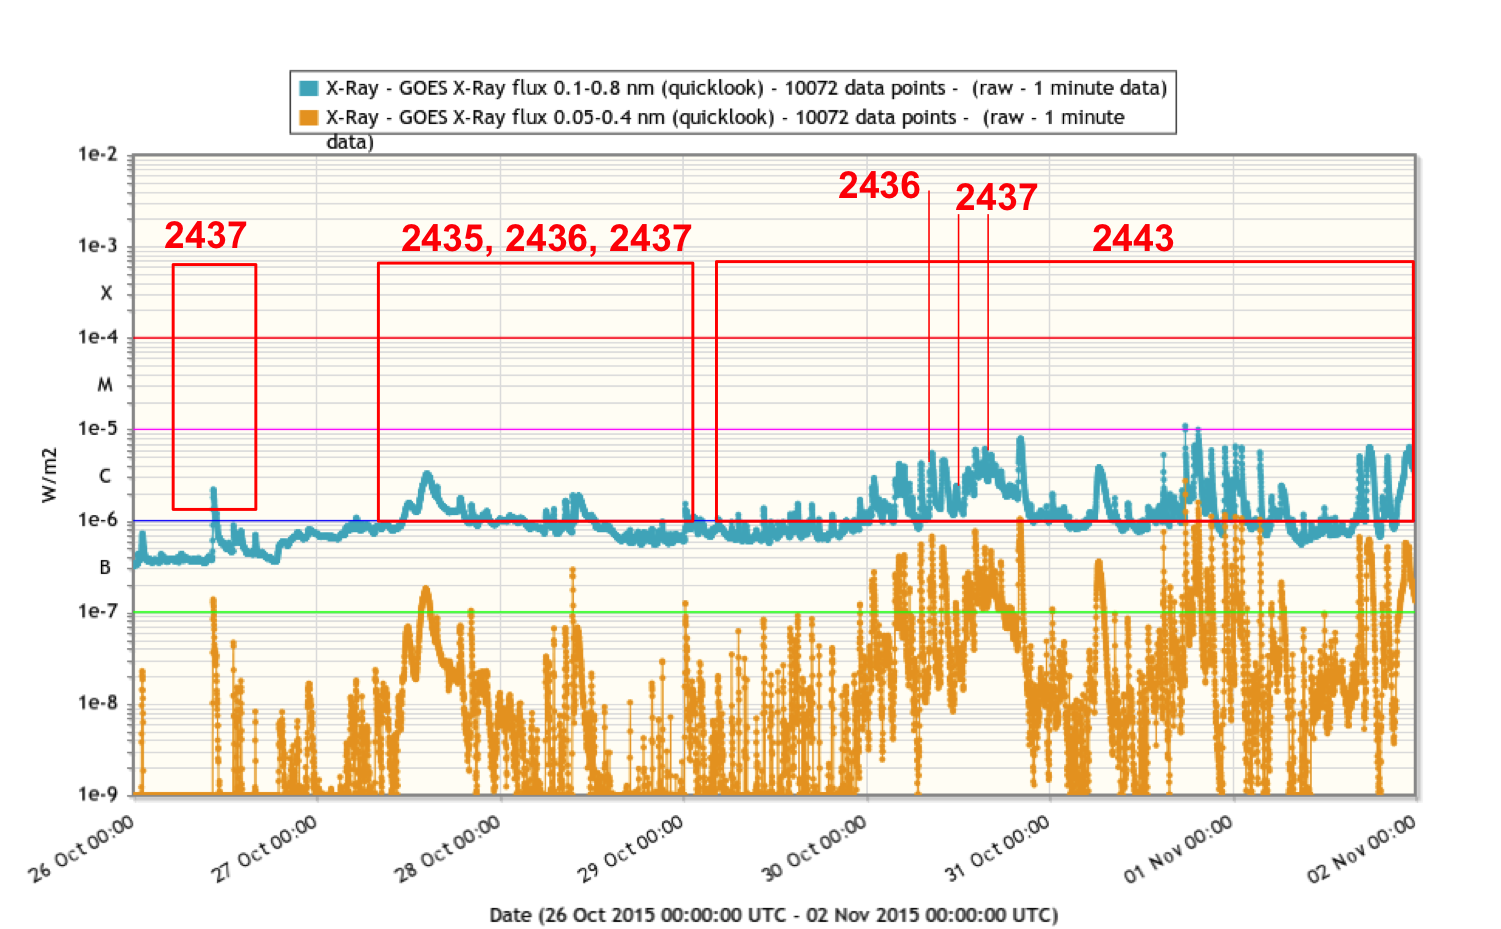
Solar activity has been quiet to moderate. The week started very quiet with only occasional low level C flares from region 2437, 2435, and 2436. This changed with region 2443 (beta-gamma-delta) rotating onto the disk from the East. This region was responsible for most of the many high level C flares and the one M flare occurring during the second half of the week. Some less significant regions formed on disk throughout the week (2440, 2441, 2442) but these remained fairly inactive.
Coronal Mass Ejections
Two significant West-bound CMEs were recorded. The first one with first appearance in SoHo/LASCO/C2 at 12:36UT October 27, was associated with a slow rising C3.2 flare from at or beyond the West limb. The angular extent was below 180 degrees and the CME was estimated to be not geoeffective. The second CME had its first appearance in SoHo/LASCO/C2 at 12:24UT October 29, and was judged to be backsided. SDO/AIA/193 shows a clear off limb dimming around the time.
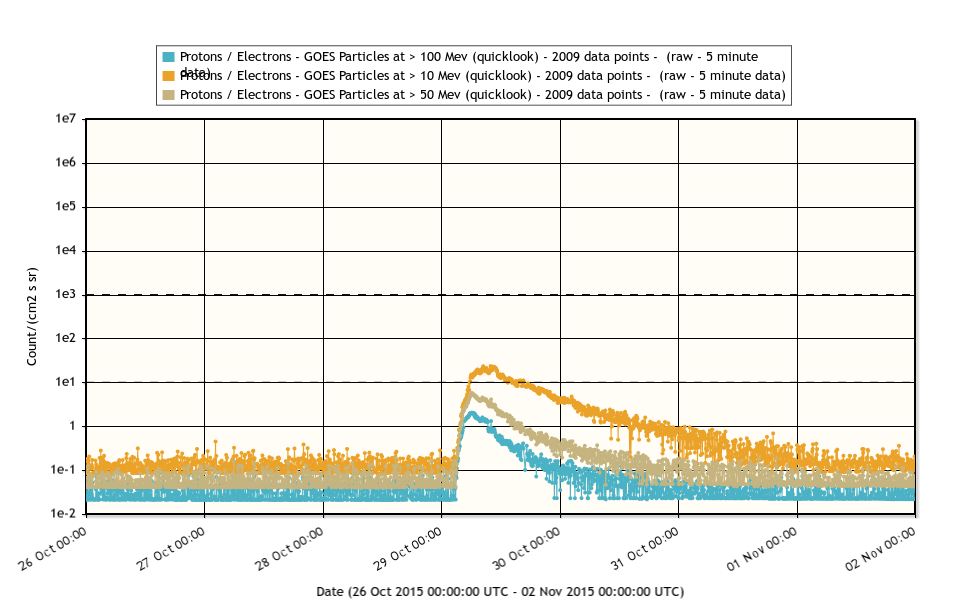
This CME was associated to a proton event at Earth, with proton levels starting to rise around 3:00 UT October 29 following the CME onset. The >10 MeV proton levels reached the event threshold of 10 pfu around 5:50UT and reached a peak of around 24 pfu around 10:00UT. The levels of >100 MeV and > 50MeV protons also increased above 1 pfu but remained below 10pfu.
Coronal hole
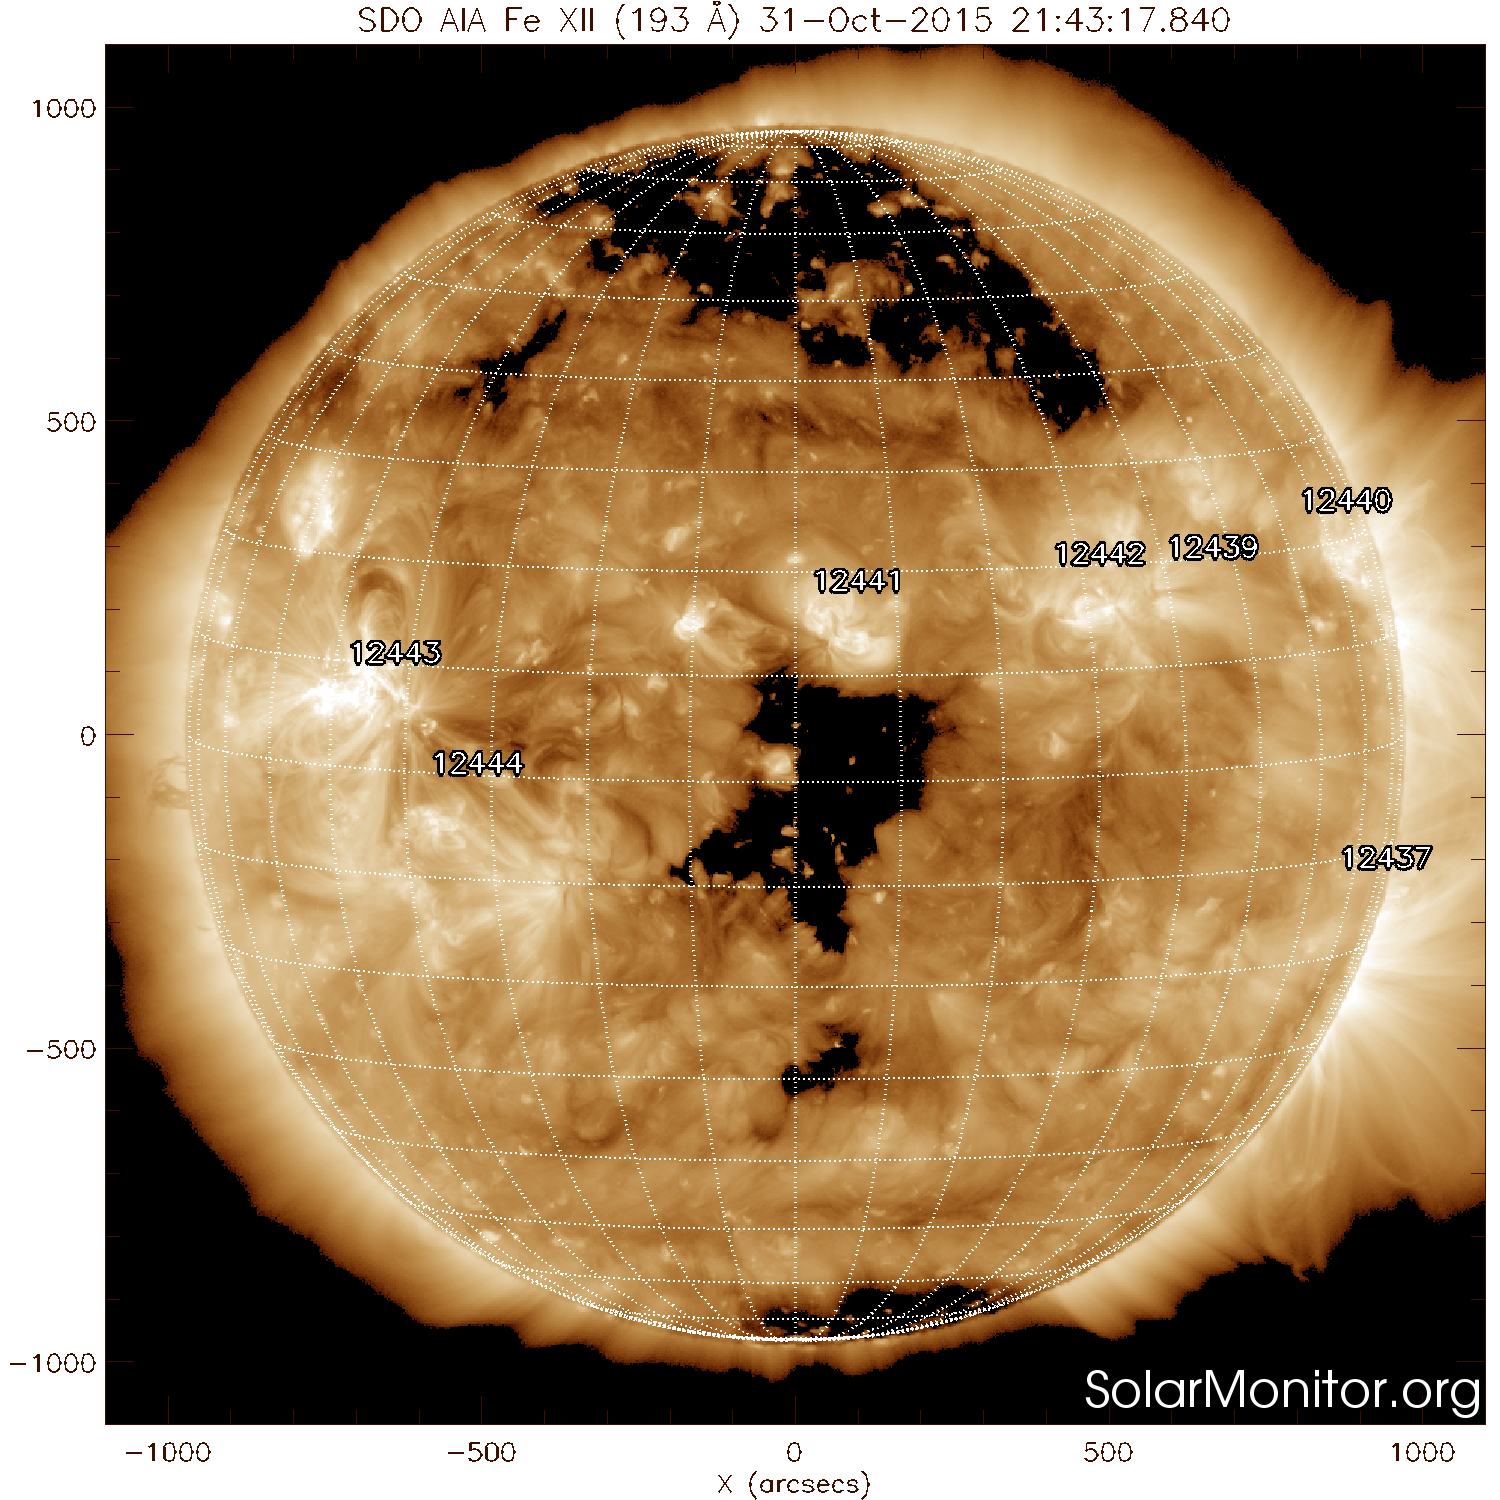
A positive polarity equatorial coronal hole started crossing the central meridian around midnight October 30/31. Its high speed stream was expected to become geoeffective from November 3 onwards.
Noticeable Solar Events (26 Oct 2015 - 1 Nov 2015)
| DAY | BEGIN | MAX | END | LOC | XRAY | OP | 10CM | TYPE | Cat | NOAA |
| 31 | 1748 | 1752 | 1755 | N6E51 | M1.0 | SF | 62 | 2443 |
| LOC: approximate heliographic location | TYPE: radio burst type |
| XRAY: X-ray flare class | Cat: Catania sunspot group number |
| OP: optical flare class | NOAA: NOAA active region number |
| 10CM: peak 10 cm radio flux |
Review of geomagnetic activity
Solar wind speed declined during the first half of the week from around 450 km/s to around 300 km/s, and then remained fairly stable in the 330-380 km/s range. The magnetic field was in the 4 to 12 nT range with Bz not below -7 nT.
The magnetic field phi angle switched from a positive to a negative sector around midnight 27/28 and back to a positive sector late November 1 (Green graph, bottom window of the ACE data).
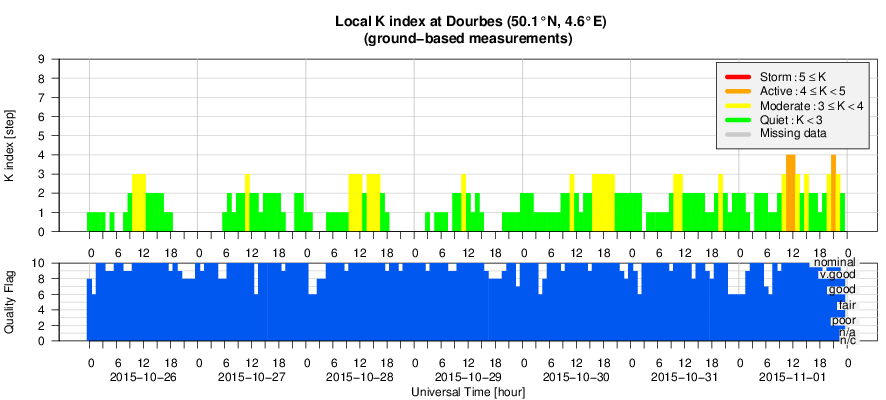
Geomagnetic conditions were mainly quiet to unsettled (NOAA Kp 0-3) with also some short periods of active conditions locally on November 1, associated with a peak negative Bz. (local K Dourbes 4 at two intervals on November 1, but K=0-3 otherwise).
Geomagnetic Observations at Dourbes (26 Oct 2015 - 1 Nov 2015)
Review of ionospheric activity (26 Oct 2015 - 1 Nov 2015)
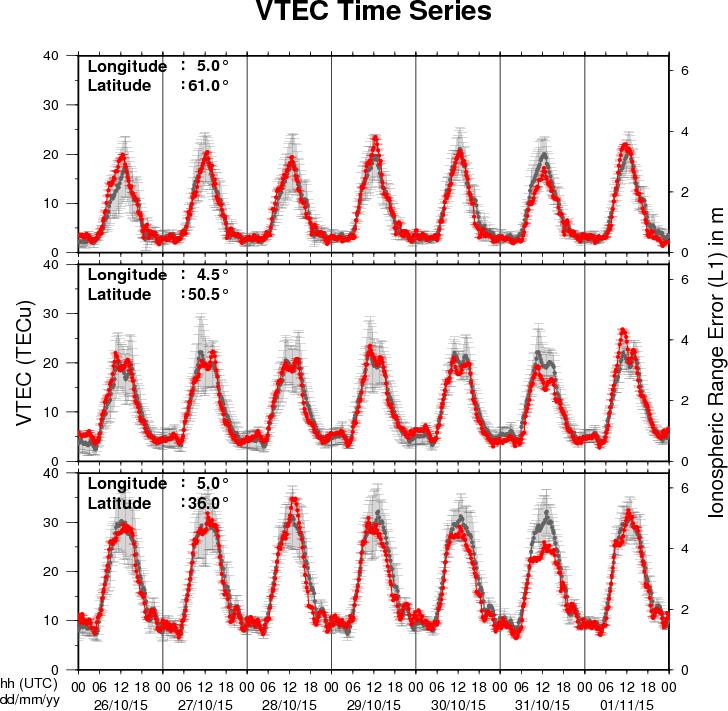
The figure shows the time evolution of the Vertical Total Electron Content (VTEC) (in red) during the last week at three locations:
a) in the northern part of Europe(N61°, 5°E)
b) above Brussels(N50.5°, 4.5°E)
c) in the southern part of Europe(N36°, 5°E)
This figure also shows (in grey) the normal ionospheric behaviour expected based on the median VTEC from the 15 previous days.
The VTEC is expressed in TECu (with TECu=10^16 electrons per square meter) and is directly related to the signal propagation delay due to the ionosphere (in figure: delay on GPS L1 frequency).
The Sun's radiation ionizes the Earth's upper atmosphere, the ionosphere, located from about 60km to 1000km above the Earth's surface.The ionization process in the ionosphere produces ions and free electrons. These electrons perturb the propagation of the GNSS (Global Navigation Satellite System) signals by inducing a so-called ionospheric delay.
See http://stce.be/newsletter/GNSS_final.pdf for some more explanations ; for detailed information, see http://gnss.be/ionosphere_tutorial.php
Future Events
For more details, see http://www.spaceweather.eu/en/event/future
Solar Storm Early Forecasting in Copenhagen, Denmark
Start : 2015-11-09 - End : 2015-11-11
The fundamentally most important source of inner heliospheric
plasma physics and space weather is the active Sun, its solar
active region eruptions. Prediction of the evolution and influence
of solar active regions on solar storms in the near-Earth
environment is of particular interest to several forecasting
institutions, industrial stakeholders, and the public in
general.
State-of-the-art solar storm prediction tools are limited to
monitoring solar active regions, registering eruptions and mass
ejections while attempting, then, at extrapolating subsequent
evolution and spatio-temporal propagation: no realistic
physics-based and data-driven synthesis tool exists, which is
capable of predicting when a solar flare will be triggered, or when
a Coronal Mass Ejection will be launched into inter-planetary
space. In short, we are not yet able to answer the question: When
and why do solar storms launch?
Our meeting will be focused around initiation of space weather
events at the Sun. We will discuss and develop three major
challenges, and we aim to develop a draft resolution road-map for
those challenges during the meeting.
Website:
https://indico.nbi.ku.dk/conferenceDisplay.py?confId=817
Workshop on Solar Astronomy Big Data - IEEE ICDM in Atlantic City, NJ, USA.
Start : 2015-11-13 - End : 2015-11-13
With the launch of NASA's Solar Dynamics Observatory (SDO)
mission on 02/11/2010, researchers in solar physics have entered
the era of Big Data. The Atmospheric Imaging Assembly (AIA)
instrument on SDO provides imaging data and the Helioseismic and
Magnetic Imager (HMI) instrument on SDO provides magnetic field
data. Both instruments record data at a high spatial resolution and
a time cadence, amounting to about 1 Petabyte of scientific data
each year. The Big Data challenges in Solar Astronomy are expected
to grow even further with the inauguration of the NSF funded Daniel
K. Inouye Solar Telescope (DKIST), currently under construction in
Hawaii. This telescope is expected to generate: 3-5 Petabytes of
data per year.
COSPAR/ILWS workshop: science for space weather in Goa, India
Start : 2016-01-24 - End : 2016-01-29
Understanding and being able to forecast space weather is an
increasingly important aspect of our modern technology-reliant
society. This workshop will treat all aspects of space weather,
ranging from solar origins of transient events (CMEs, Flares, CIRs)
to their propagation through the heliosphere and effects on Earth
and planetary bodies, from particle energization to forecasting
particle environment and its effects on technological and
biological systems, as well as solar-cycle effects and coupling of
space weather to atmospheric response. Metrics to assess
predictions will also be discussed. The workshop is structured
along the lines of the COSPAR space weather pathways and will
include invited, contributed talks and posters, as well as panel
discussions and tutorials.
Website:
http://www.cessi.in/ssw/program.html
The Scientific Foundation of Space Weather
Start : 2016-06-27 - End : 2016-07-01
Website:
http://www.issibern.ch/program/workshops.html