- Table of Content
- 1.Strong radio e...
- 2.GNSS view on t...
- 3.PROBA2 Observa...
- 4.Ionospheric ev...
- 5.Review of sola...
- 6.The Internatio...
- 7.Noticeable Sol...
- 8.Review of geom...
- 9.Geomagnetic Ob...
- 10.Review of iono...
- 11.Future Events
2. GNSS view on the Nov 04 solar radio burst
3. PROBA2 Observations (2 Nov 2015 - 8 Nov 2015)
4. Ionospheric event on Nov 3
5. Review of solar activity
6. The International Sunspot Number
7. Noticeable Solar Events (2 Nov 2015 - 8 Nov 2015)
8. Review of geomagnetic activity (2 Nov 2015 - 8 Nov 2015)
9. Geomagnetic Observations at Dourbes (2 Nov 2015 - 8 Nov 2015)
10. Review of ionospheric activity (2 Nov 2015 - 8 Nov 2015)
11. Future Events
Strong radio event on 04 November
This news item was written by Dr Jasmina Magdalenic, scientist at the Royal Observatory of Belgium.
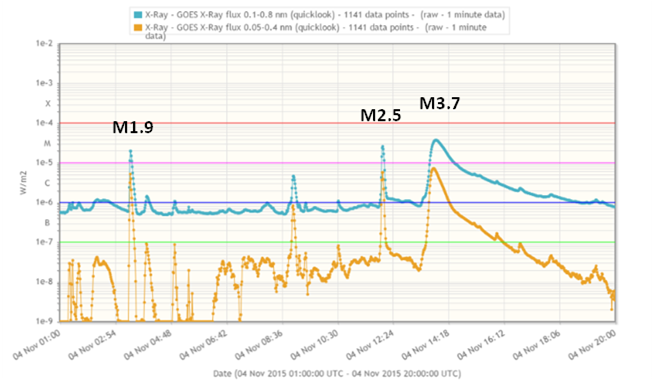
Although we are already in the declining phase of this solar cycle, the Sun was rather busy on 04 November. Three rather large eruptive phenomena (M-class flares) were observed on that day. The two smaller eruptions (i.e. M1.9 and M2.5) originated from active region NOAA 2445, while the largest one, the M3.7 flare, originated from the active region NOAA 2443 which was near disk centre at the time of the eruption. The GOES curves in the figure underneath show several solar flares recorded on 04 November. The most prominent ones were the three medium-sized M-class flares (with the maximum intensities above the pink horizontal line). All three events were associated with radio emission, but the most complex radio emission was linked to the long duration M3.7 flare.
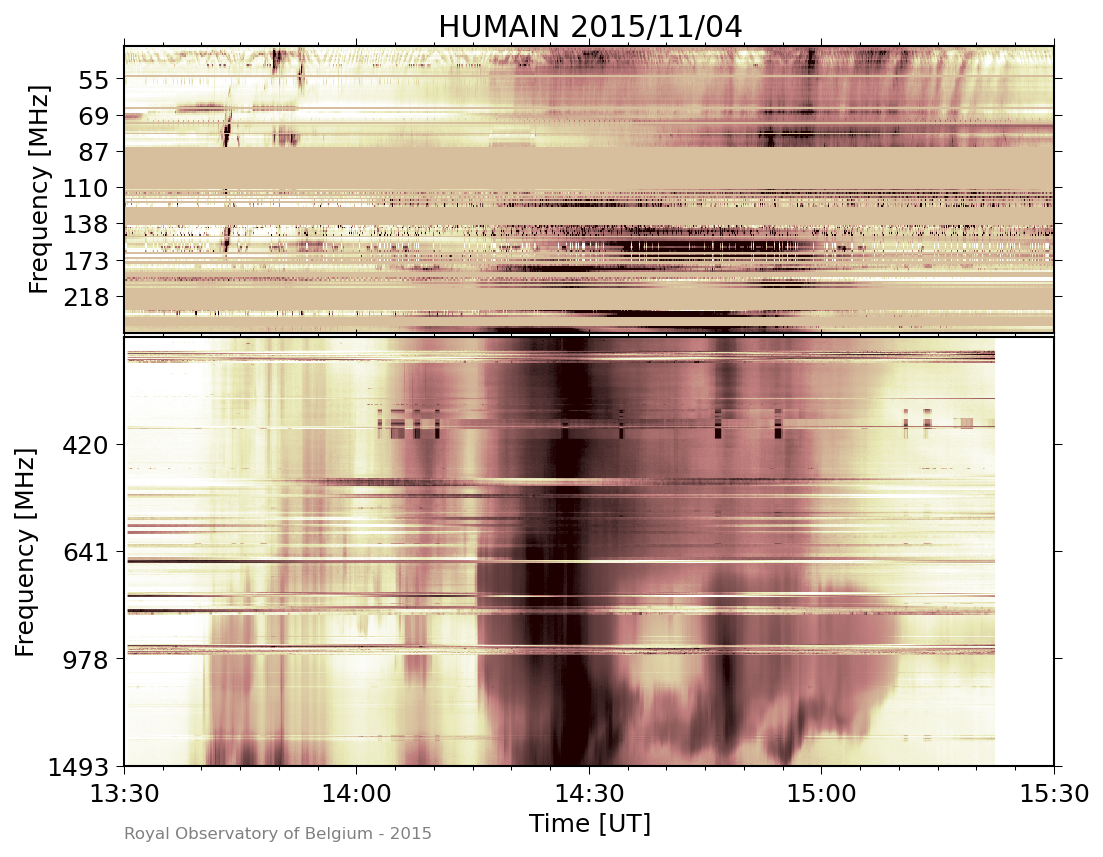
The HUMAIN Solar Radio Spectrograph (HSRS) recorded the intense radio emission (in association with the long duration M3.7 flare), consisting of a so-called type II radio burst and strong type IV radio continuum (figure underneath). The radio spectrogram or dynamic spectrum (recorded by HSRS) is a graphical presentation of the radio emission intensity, recorded at a number of closely spaced frequencies. In the spectrograms the horizontal x-axis represents time increasing from left to the right and the vertical y-axis represents frequency. Two different types of radio emission can be seen in the spectrogram underneath (darker color indicates more intense radio emission).
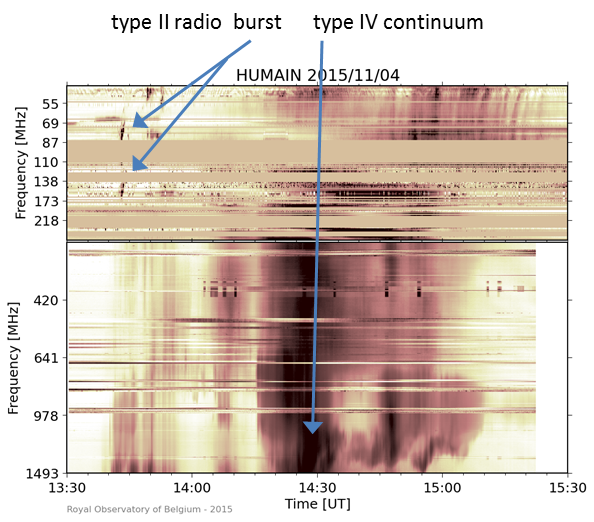
A type II burst is commonly defined as a radio signature of the shock wave, usually generated by the large eruptions of plasma confined in erupting magnetic flux ropes, so called coronal mass ejection.
The type IV continuum emission, like the one which covered the full range of HSRS observations on 04 November (figure above), is generally associated with solar flares. Since the majority of the radio observations do not estimate the real strength of the radio emission (in solar flux units), we can only guess on the intensity of the observed radio emission.
The HSRS observations are unique radio observations in Europe, covering a rather large frequency range, which offers the real time information about the ongoing radio activity, but they also do not provide information on the exact strength of the radio emission.
The problems of the Swedish air traffic control (radars stopped showing airplanes) reported on 04 November, lasted about an hour starting from around 13:30UT. These phenomena temporarily coincided with the start of the intense radio emission observed by HSRS (see figure above).
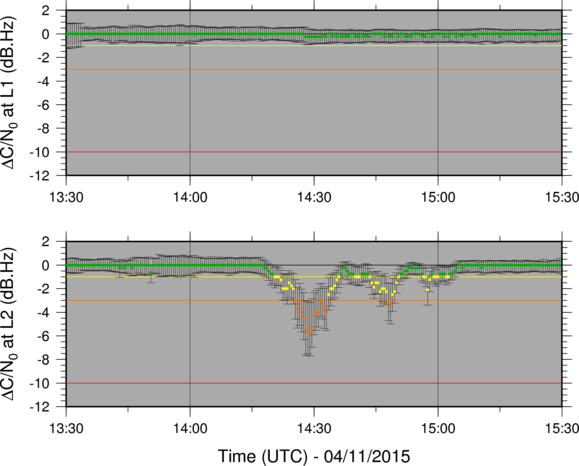
Therefore we can deduce that the apparently strong type IV radio emission which was observed on both GPS frequencies (around 1.5 GHz) and the civil air traffic control communication channels (about 120-140 MHz), might have been the source of the radio blackout experienced by the Swedish air traffic control.
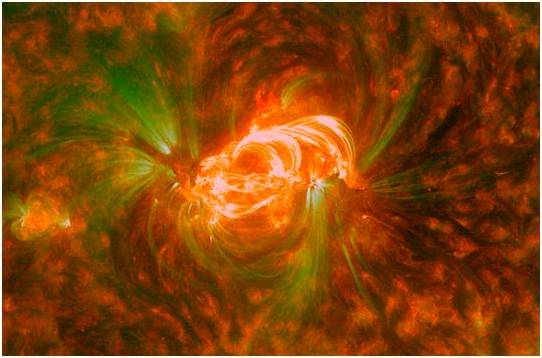
The picture above was taken by SDO on 04 November at 15:00UT in extreme ultraviolet (AIA171 and 304).
GNSS view on the Nov 04 solar radio burst
On November 04, the Sun bursted in the radio spectrum. The F10cm flux measured at the time of the M2.5 flare (peak at 12:03 UT) was 3600 sfu (solar flux units), at the time of the M3.7 flare (peak at 13:52 UT) it was 1400 sfu.
At Humain, the STCE radio antenna's picked up the signal leaving a bunch of excited radio scientists and space weather forecasters discussing the possible impacts on radar signals used in aviation. Check the tab 'Strong radio event on November 4'.
The GNSS (Global Navigation Satellite Systems) people of the STCE witnessed also exciting moments: the solar radio burst had an impact on GNSS applications between 14:00 and 15:00 UT.
Have a look at http://gnss.be/Atmospheric_Maps/srb_event.php?date=2015-11-04
PROBA2 Observations (2 Nov 2015 - 8 Nov 2015)
Solar Activity
Solar flare activity fluctuated between very low and moderate during the week.
In order to view the activity of this week in more detail, we suggest to go to the following website from which all the daily (normal and difference) movies can be accessed:
http://proba2.oma.be/ssa
This page also lists the recorded flaring events.
A weekly overview movie can be found here (SWAP week 293).
http://proba2.oma.be/swap/data/mpg/movies/weekly_movies/weekly_movie_2015_11_02.mp4
Details about some of this week’s events, can be found further below.
November Nov 02
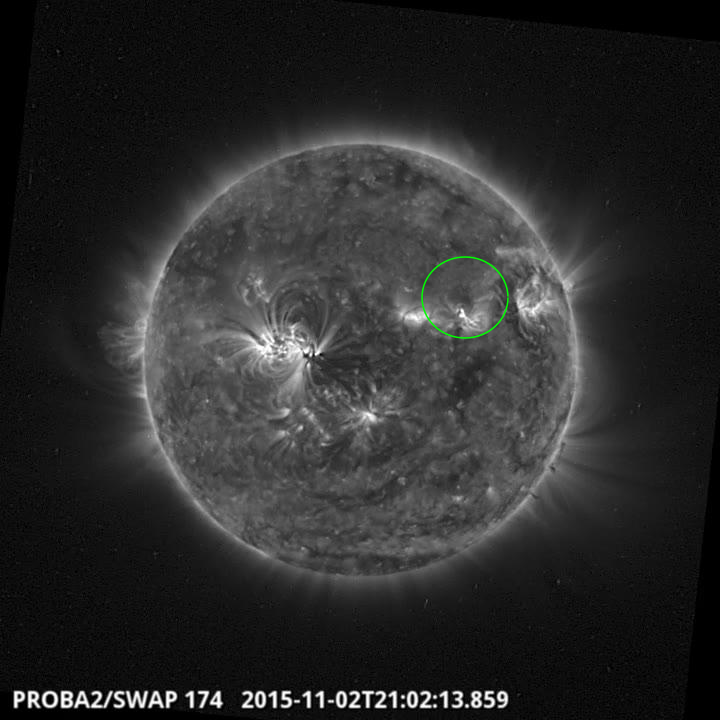
Eruption on the north west quadrant @ 21:02 SWAP image
Find a movie of the event here (SWAP movie)
http://proba2.oma.be/swap/data/mpg/movies/20151102_swap_movie.mp4
Wednesday Nov 04
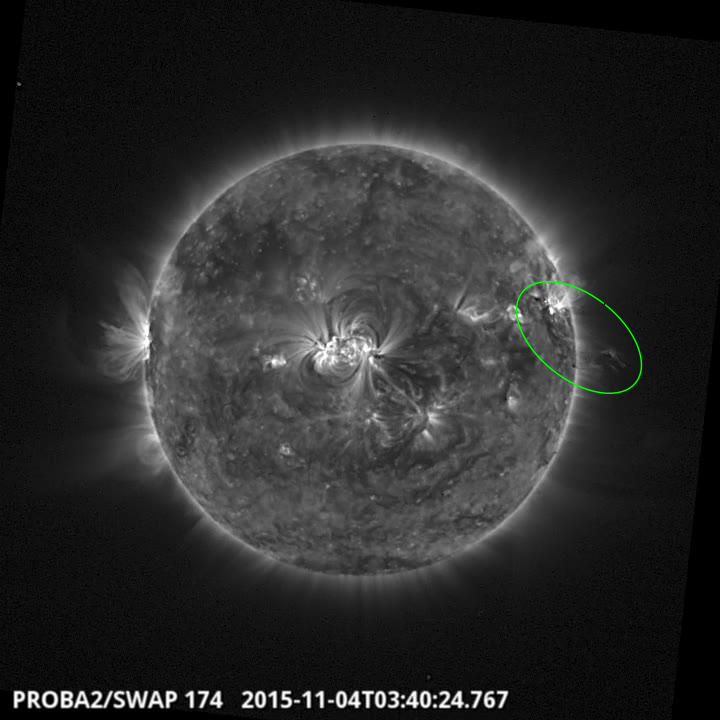
Eruption on the west limb @ 03:40 SWAP image
Find a movie of the event here (SWAP movie)
http://proba2.oma.be/swap/data/mpg/movies/20151104_swap_movie.mp4
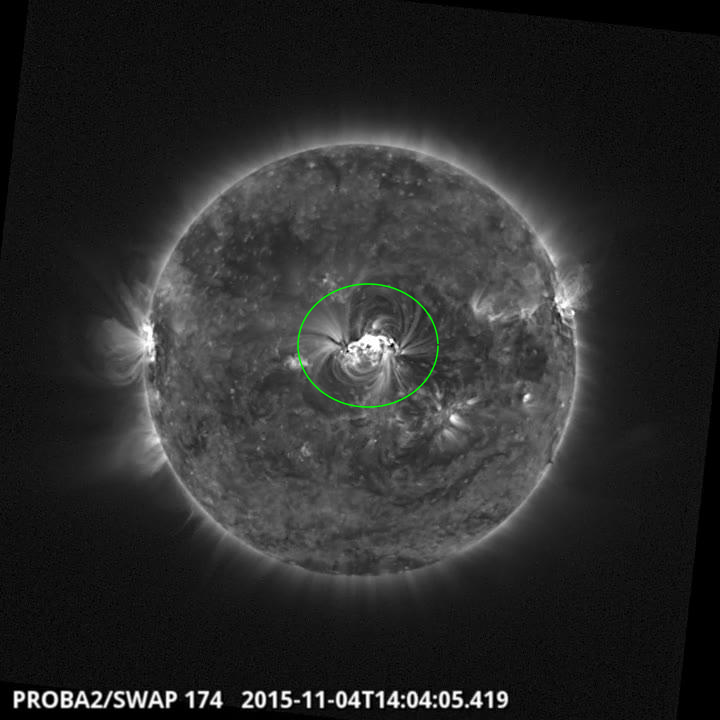
Mflare on the centre @ 14:04 SWAP image
Find a movie of the event here (SWAP movie)
http://proba2.oma.be/swap/data/mpg/movies/20151104_swap_movie.mp4
Saturday Nov 07
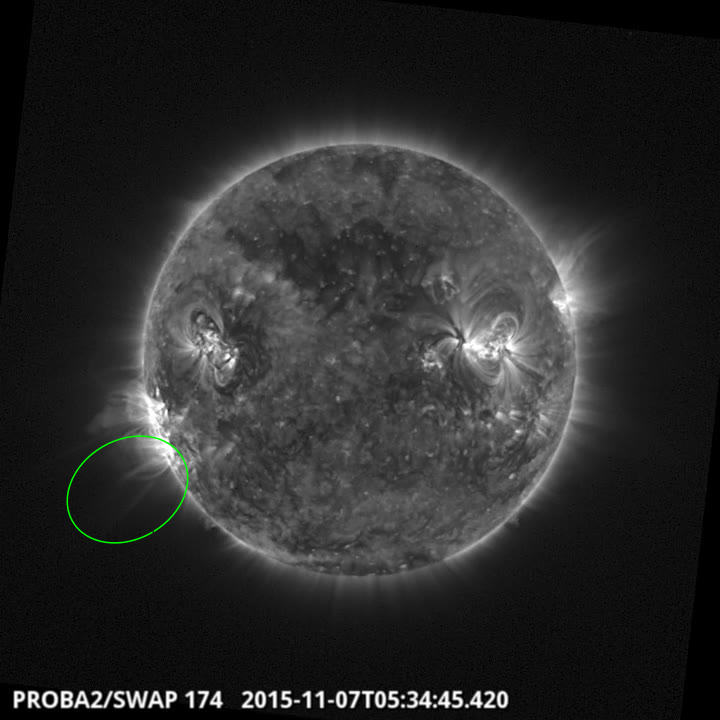
Eruption on the east limb @ 05:34 SWAP image
Find a movie of the event here (SWAP movie)
http://proba2.oma.be/swap/data/mpg/movies/20151107_swap_movie.mp4
Ionospheric event on Nov 3
On November 3rd, between 09:45 UTC and 16:00 the total electron of the ionosphere in the european region increased on average by 17 TECU following the high-speed stream of solar wind which generated geomagnetic activity.
Check http://gnss.be/Atmospheric_Maps/ionospheric_event.php?date=2015-11-03
Review of solar activity
Solar activity varied between very low to moderate during the week, with a total of 31 C- and 3 M-class flares recorded.
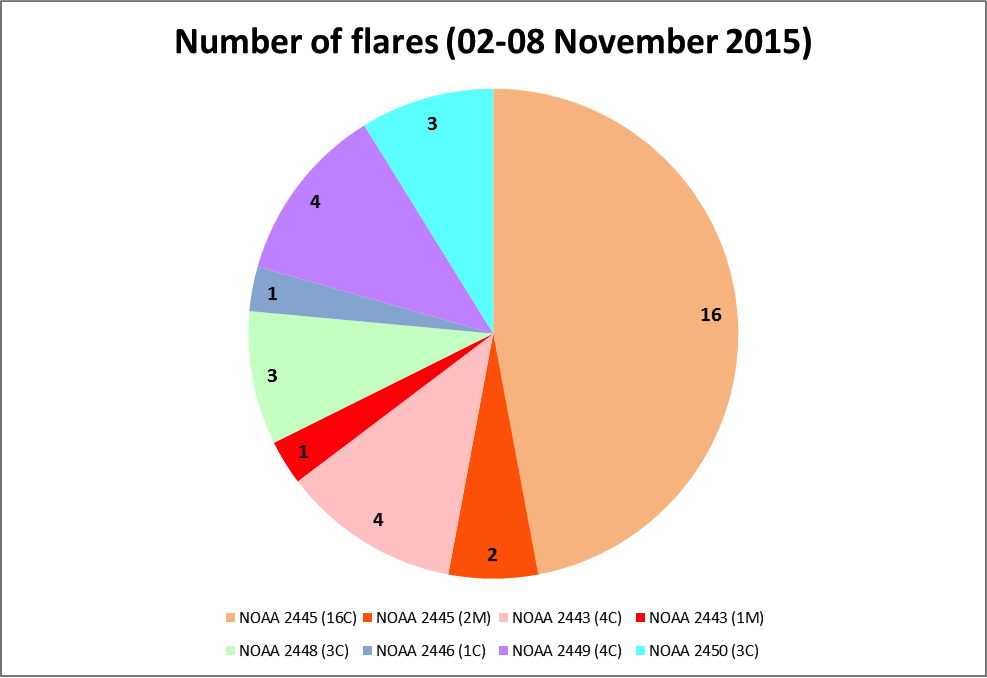
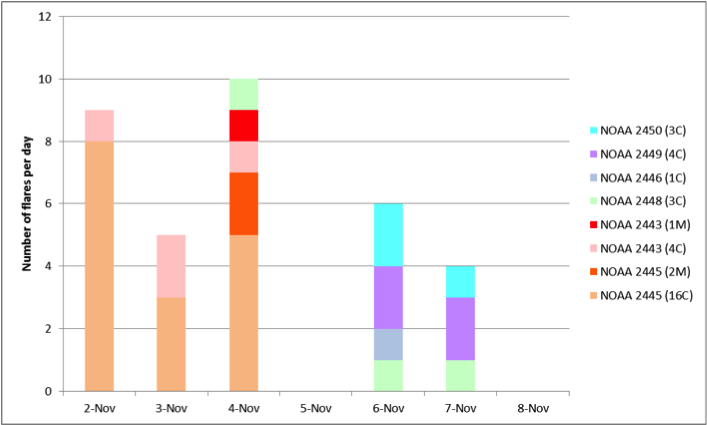
NOAA 2445 and NOAA 2443 dominated the first half of the period, both regions having delta structures and producing resp. 2 and 1 M-class flares on 04 November. The latter event, an M3.7 flare peaking at 13:52UT, was the strongest event of the week and was produced when source region NOAA 2443 was located very close to disk centre.
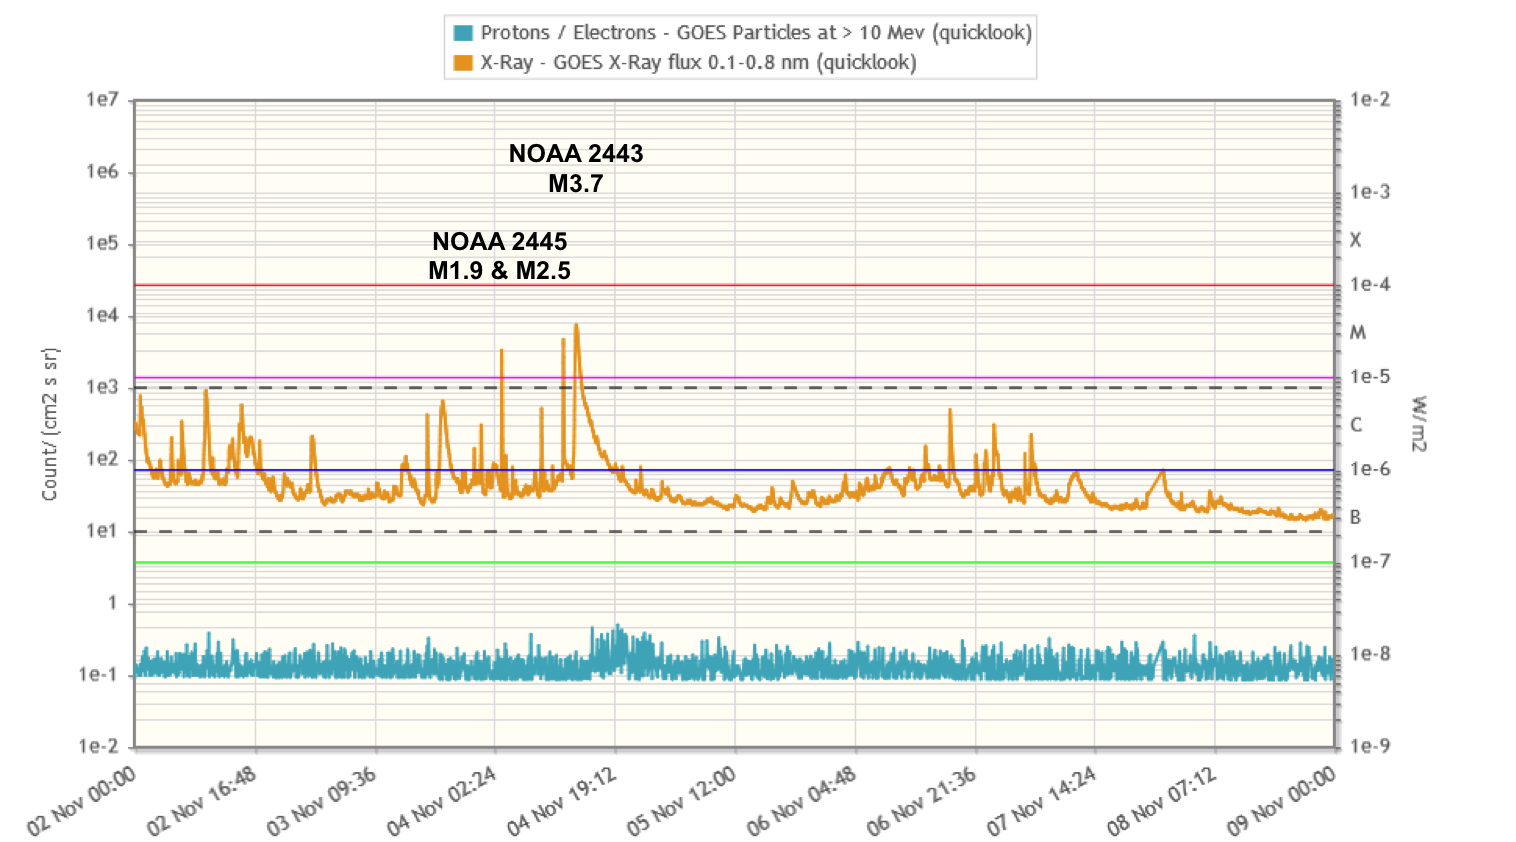
Strong radio bursts (type II and IV) were associated with this M3 flare, and a partial halo coronal mass ejection (CME) was first observed by CACTus in LASCO/C2 imagery at 14:36UT.
Flaring activity then stalled, with no C-class or higher flares observed on 05 November. On 06 and 07 November, a series of smaller sunspot groups near the Sun's east limb (especially NOAA 2449) and NOAA 2446 (northwest quadrant) took over and produced low-level C-class flares. No significant flares (C-class or higher) were observed on 08 November. Except for the M3 related partial halo CME, no other earth-directed CMEs were observed.
The International Sunspot Number
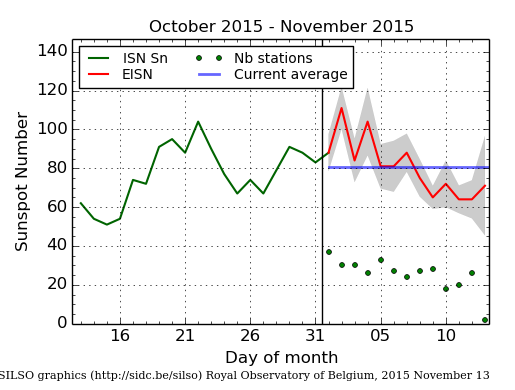
The daily Estimated International Sunspot Number (EISN, red curve with shaded error) derived by a simplified method from real-time data from the worldwide SILSO network. It extends the official Sunspot Number from the full processing of the preceding month (green line). The plot shows the last 30 days (~ one solar rotation). The horizontal blue line shows the current monthly average, while the green dots give the number of stations included in the calculation of the EISN for each day.
Noticeable Solar Events (2 Nov 2015 - 8 Nov 2015)
| DAY | BEGIN | MAX | END | LOC | XRAY | OP | 10CM | TYPE | Cat | NOAA |
| 04 | 0320 | 0326 | 0329 | N15W64 | M1.9 | 1N | 220 | II/2 | 63 | 2445 |
| 04 | 1155 | 1203 | 1206 | N12W73 | M2.5 | 1N | 28 | II/1 | 63 | 2445 |
| 04 | 1331 | 1352 | 1413 | N9W4 | M3.7 | 2B | 340 | II/2IV/1 | 62 | 2443 |
| LOC: approximate heliographic location | TYPE: radio burst type |
| XRAY: X-ray flare class | Cat: Catania sunspot group number |
| OP: optical flare class | NOAA: NOAA active region number |
| 10CM: peak 10 cm radio flux |
Review of geomagnetic activity (2 Nov 2015 - 8 Nov 2015)
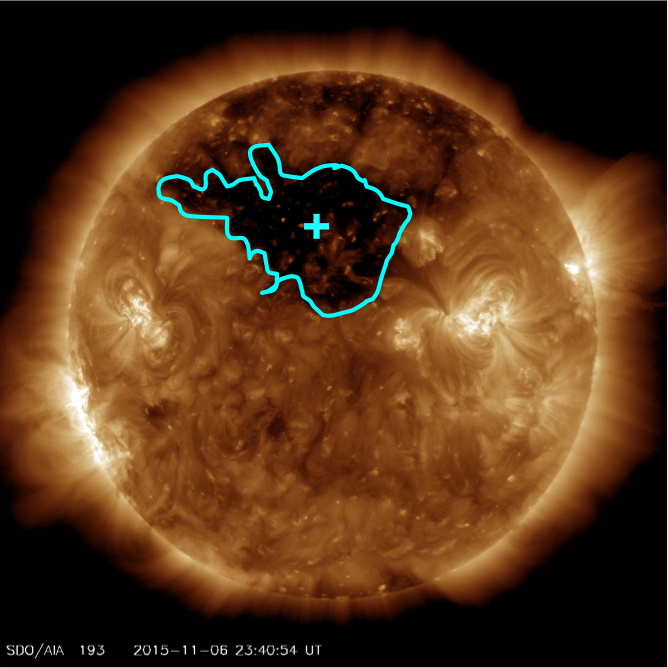
Late on 02 November, the co-rotating interaction region (CIR) followed by the high speed stream (HSS) from a positive equatorial coronal hole (CH - SDO/AIA just below) arrived at Earth.
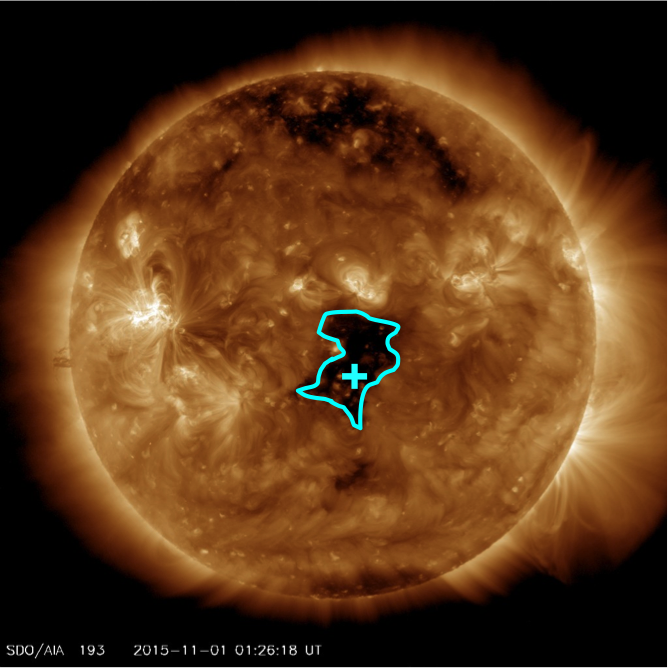
Solar wind speed reached maximum values near 770 km/s, which was a bit lower than during the previous rotation (810 km/s). Bz initially oscillated between -25 and +27 nT before settling between -10 and +10nT with sustained negative periods. As a result, minor storming was observed on 03 and 04 November.
A shock was observed by ACE on 06 November near 17:35UT, with wind speed jumping from about 440 km/s to 560 km/s, then gradually increasing until maximum speeds near 710 km/s were reached around 03:00UT (07 November). Bz was initially wildly oscillating between -16 and +18 nT before turning to more steady negative values between -11 and -5 nT on 07 November (02-12UT interval). Hence, minor (K Dourbes=5) to major (Kp=6) geomagnetic storming was observed during the first half of 07 November.
Late on 08 November, the HSS from a wide northern CH (SDO/AIA just below) arrived at Earth.
The still elevated wind speed displayed a gradual and relatively modest rise from about 460 to 550 km/s. Bz was mostly negative at -5 nT. Only active geomagnetic conditions have been observed so far as a result from this HSS.
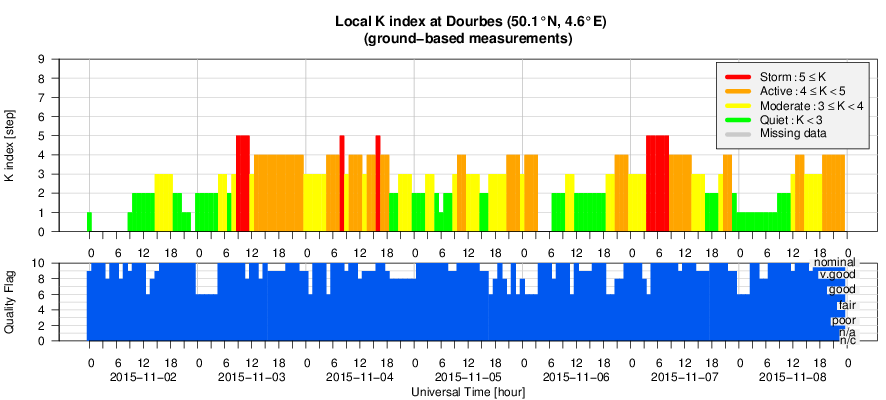
Geomagnetic Observations at Dourbes (2 Nov 2015 - 8 Nov 2015)
Review of ionospheric activity (2 Nov 2015 - 8 Nov 2015)
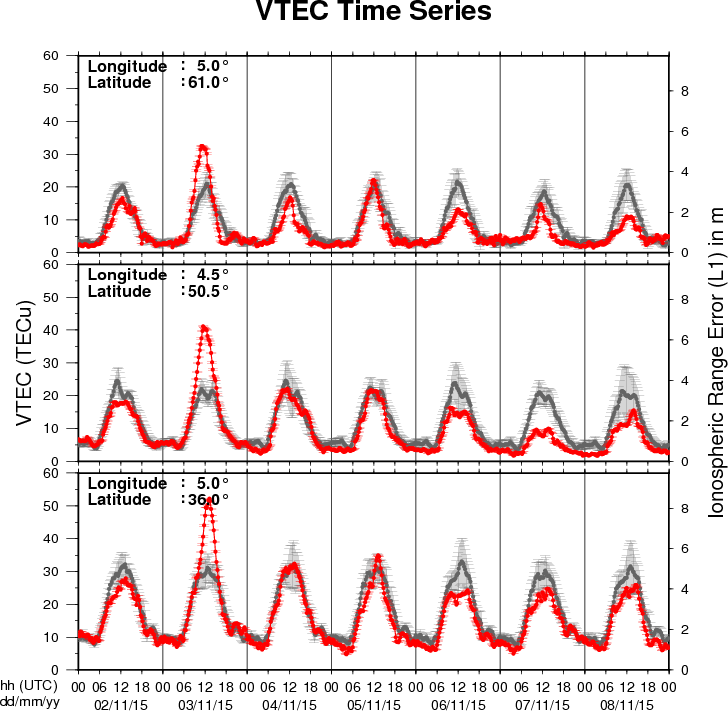
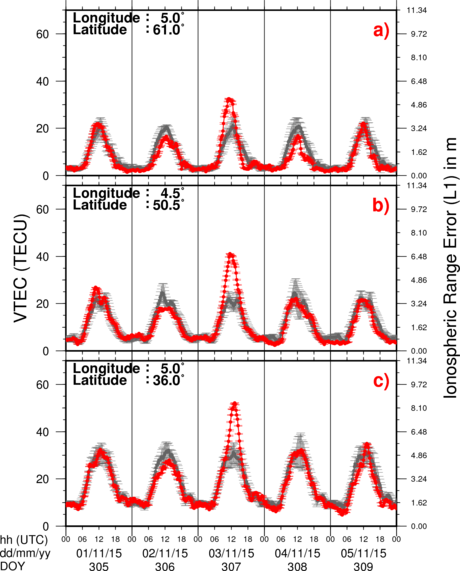
The figure shows the time evolution of the Vertical Total Electron Content (VTEC) (in red) during the last week at three locations:
a) in the northern part of Europe(N61°, 5°E)
b) above Brussels(N50.5°, 4.5°E)
c) in the southern part of Europe(N36°, 5°E)
This figure also shows (in grey) the normal ionospheric behaviour expected based on the median VTEC from the 15 previous days.
The VTEC is expressed in TECu (with TECu=10^16 electrons per square meter) and is directly related to the signal propagation delay due to the ionosphere (in figure: delay on GPS L1 frequency).
The Sun's radiation ionizes the Earth's upper atmosphere, the ionosphere, located from about 60km to 1000km above the Earth's surface.The ionization process in the ionosphere produces ions and free electrons. These electrons perturb the propagation of the GNSS (Global Navigation Satellite System) signals by inducing a so-called ionospheric delay.
See http://stce.be/newsletter/GNSS_final.pdf for some more explanations ; for detailed information, see http://gnss.be/ionosphere_tutorial.php
Future Events
For more details, see http://www.spaceweather.eu/en/event/future
COSPAR/ILWS workshop: science for space weather in Goa, India
Start : 2016-01-24 - End : 2016-01-29
Understanding and being able to forecast space weather is an
increasingly important aspect of our modern technology-reliant
society. This workshop will treat all aspects of space weather,
ranging from solar origins of transient events (CMEs, Flares, CIRs)
to their propagation through the heliosphere and effects on Earth
and planetary bodies, from particle energization to forecasting
particle environment and its effects on technological and
biological systems, as well as solar-cycle effects and coupling of
space weather to atmospheric response. Metrics to assess
predictions will also be discussed. The workshop is structured
along the lines of the COSPAR space weather pathways and will
include invited, contributed talks and posters, as well as panel
discussions and tutorials.
Website:
http://www.cessi.in/ssw/program.html
The Scientific Foundation of Space Weather
Start : 2016-06-27 - End : 2016-07-01
Website:
http://www.issibern.ch/program/workshops.html