- Table of Content
- 1.M-class brothe...
- 2.PROBA2 Observa...
- 3.Review of sola...
- 4.The Internatio...
- 5.Noticeable Sol...
- 6.Review of geom...
- 7.Geomagnetic Ob...
- 8.Review of iono...
- 9.Future Events
2. PROBA2 Observations (28 Dec 2015 - 3 Jan 2016)
3. Review of solar activity
4. The International Sunspot Number (28 Dec 2015 - 3 Jan 2016
5. Noticeable Solar Events (28 Dec 2015 - 3 Jan 2016)
6. Review of geomagnetic activity
7. Geomagnetic Observations at Dourbes (28 Dec 2015 - 3 Jan 2016)
8. Review of ionospheric activity (28 Dec 2015 - 3 Jan 2016)
9. Future Events
M-class brothers
The two strongest events that occurred during last week were two M-class flares. They were both born from active region (AR) NOAA 2473, which was also responsible for most of the M-class flaring the week before. This region was declining in sunspot area, but remained magnetically complex throughout its entire transit over the solar disk. So how do these two medium flares compare to each other?
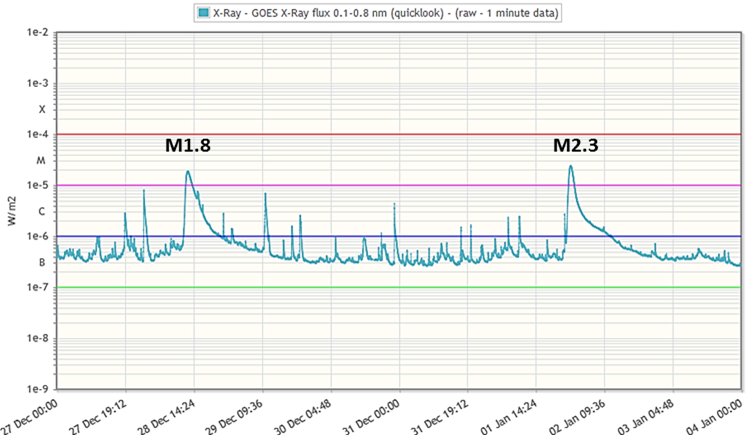
Aside having the same sunspot group as their "mother", the two events shared some other similarities. They were both of about equal strength, the M1.8 flare peaking on 28 December at 12:45UT and the M2.3 flare peaking on 02 January at 00:11UT. The difference in timing (noon vs. midnight) implies that any direct effect on communication or radar took place over nearly opposite parts of the Earth. Both flares were also long duration events, lasting respectively 169 and 111 minutes. Note that the end time is the time when the x-ray flux level decays to a point halfway between the maximum flux and the pre-flare background level. Hence, when there are no other actively flaring regions, one can follow the decline of the x-ray flux over a much longer timeframe than the timing of the flare's ending would suggest (see chart above). Another similarity was that the flares took place in about the same location of the AR, i.e. in the mid to trailing section. Both were also parallel ribbon flares, as can be seen in the extreme ultraviolet (EUV) images underneath taken by SDO (AIA 1600 filter - see http://sdo.gsfc.nasa.gov/ ).
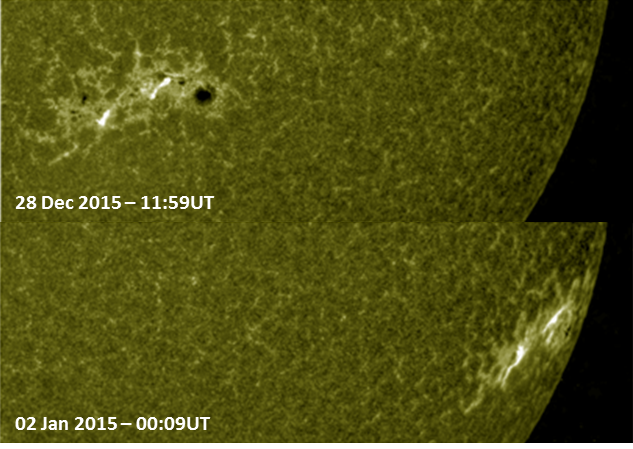
The main differences between the flares arose mainly from the different location on the solar disk when the flares were produced, as can be readily seen in the SDO/AIA131 images taken at the timing of the maximum x-ray flux. The M1 flare took place near disk centre slightly west of the central meridian (S19W09, i.e. 19 degrees south of the solar equator, 9 degrees west of the central meridian), whereas the M2 flare occurred much closer to the west limb (S21W69).
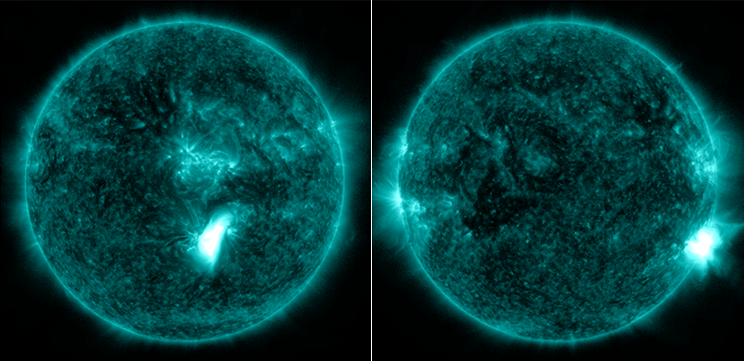
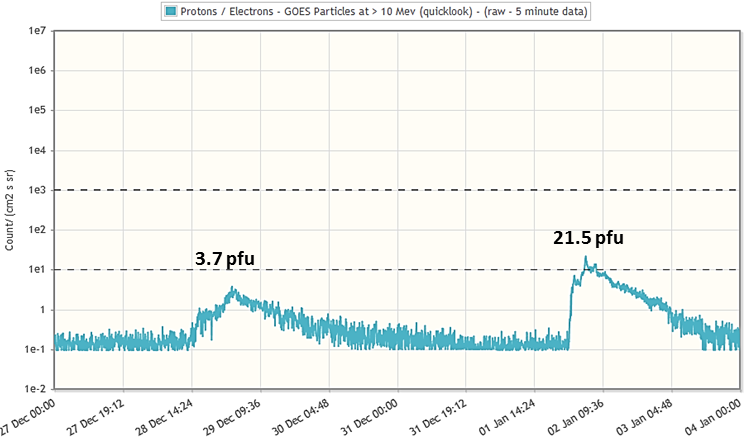
The different location influenced the observed increase in proton flux significantly. Because of its much more western position, the M2 flare was magnetically a lot better connected to Earth than the M1 flare. As a result (see graph underneath), the proton flux of the latter increased only very slowly, and reached its maximum only 9 hours after the x-ray peak, remaining well below the proton event threshold. Following the M2 flare, the proton flux increased very quickly and reached its maximum of 21 pfu (proton flux unit - see http://www.stce.be/news/325/welcome.html for more info) already on 02 January at 04:50UT. A genuine, albeit minor, proton event!
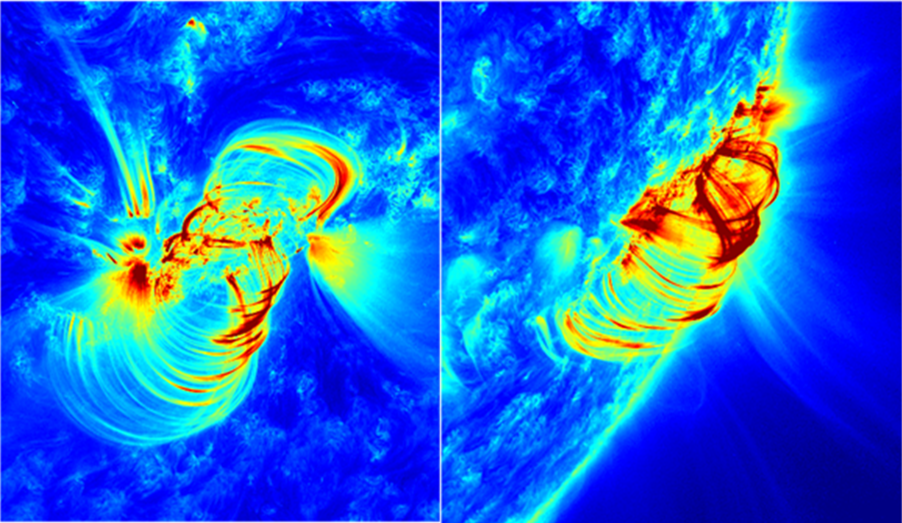
Both flares were accompanied by impressive and complex series of post-flare coronal loops (a so-called "arcade"). Figure underneath provides a snapshot of the loops respectively 5 and 2 hours after the maximum x-ray flux was reached. The images are false colored SDO/AIA 171, to bring out the subtle details of these delicate arches.
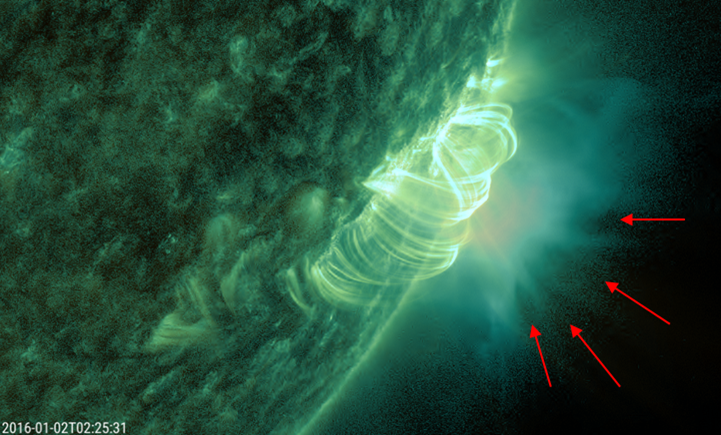
The aftermath of the flares was also characterized by different features. For example, during the declining phase of the M1 flare there were a number of impressive jets visible emanating from the main leading sunspot (see http://www.stce.be/news/293/welcome.html for more on jets). This can be seen in the movie at https://youtu.be/g1wLejwLKX4 in the false colored SDO/AIA 171 clip. On the other hand, the position of the M2 flare offered a good view on the supra-arcade downflows. These are the dark streaks ("tadpoles") that can be seen moving sunward to the top of the developing post-flare loops. The movie contains a clip combining SDO/AIA 171 (yellow; moderate temperatures; loops) with SDO/AIA 131 (bluish; high temperatures; downflows) imagery. See also the annotated image underneath. The origin of these downflows is not well understood yet. One of the theories supports the idea that these are plasma voids following in the wake of shrinking magnetic flux tubes.
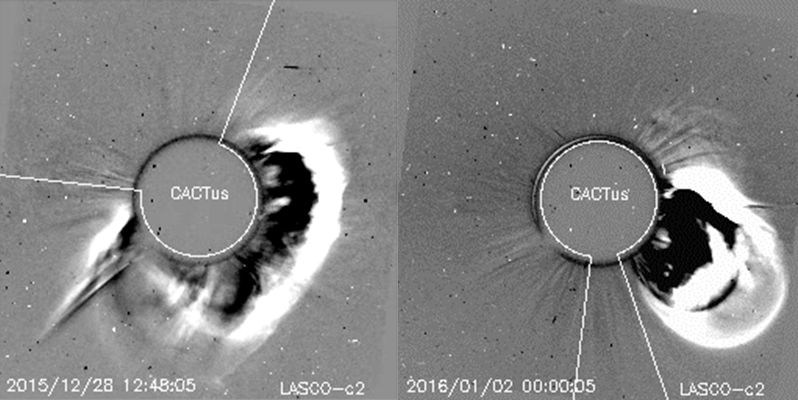
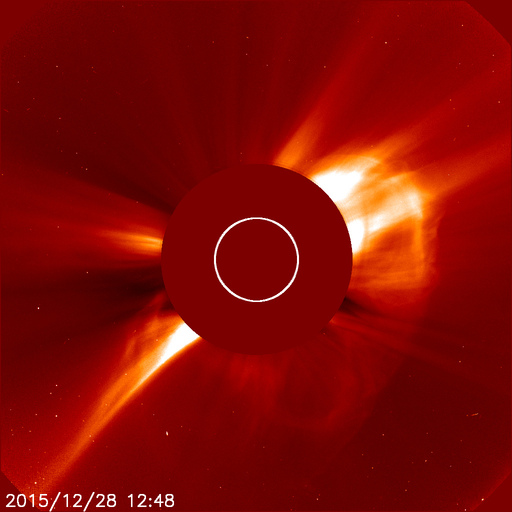
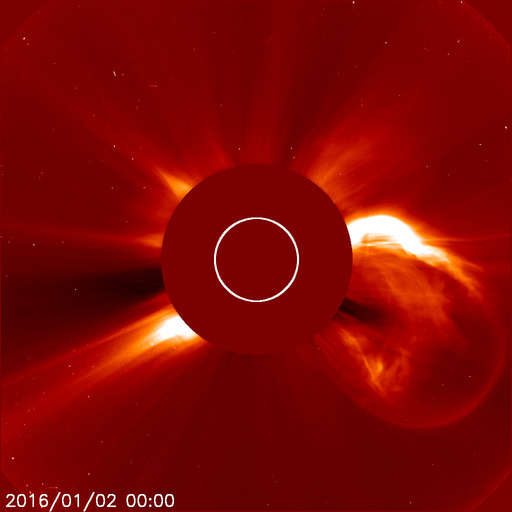
Finally, the difference in location of the flares obviously had its effect on the direction of the associated coronal mass ejection (CME). As can be seen in these coronagraphic images (CACTus - see http://www.sidc.oma.be/cactus/ ), the CME associated with the M1 flare was a partial halo CME, indicating that it had an Earth directed component. The CME associated with the M2 flare was much more solid and faster, but also not as wide and its bulk clearly directed away from the Sun-Earth line. In the end, the first CME caused a moderate geomagnetic storm a few days later, whereas the second CME apparently missed Earth and certainly did not leave an obvious signature in the solar wind parameters.
PROBA2 Observations (28 Dec 2015 - 3 Jan 2016)
Solar Activity
Solar flare activity fluctuated between very low and moderate during the week.
In order to view the activity of this week in more detail, we suggest to go to the following website from which all the daily (normal and difference) movies can be accessed:
http://proba2.oma.be/ssa
This page also lists the recorded flaring events.
A weekly overview movie can be found here (SWAP week 301).
http://proba2.oma.be/swap/data/mpg/movies/weekly_movies/weekly_movie_2015_12_28.mp4
Details about some of this week’s events, can be found further below.
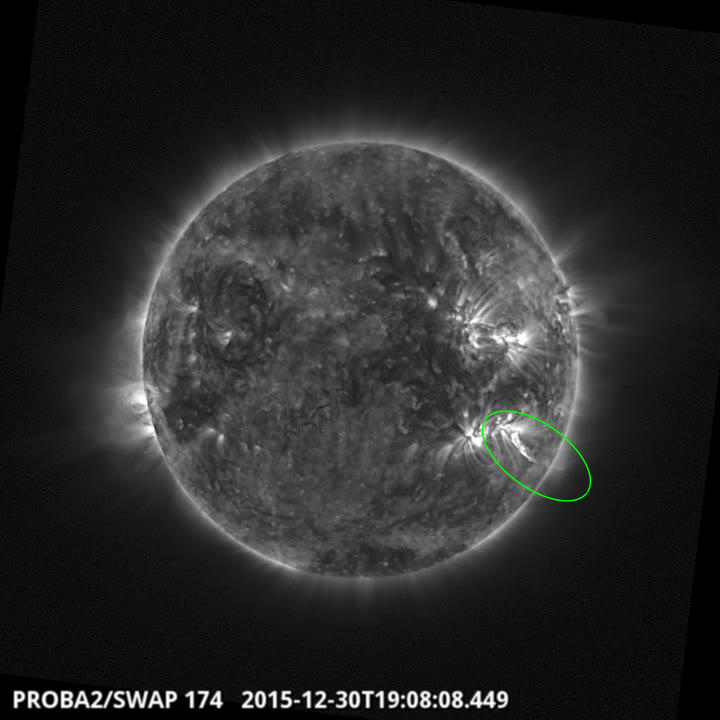
Monday Dec 28
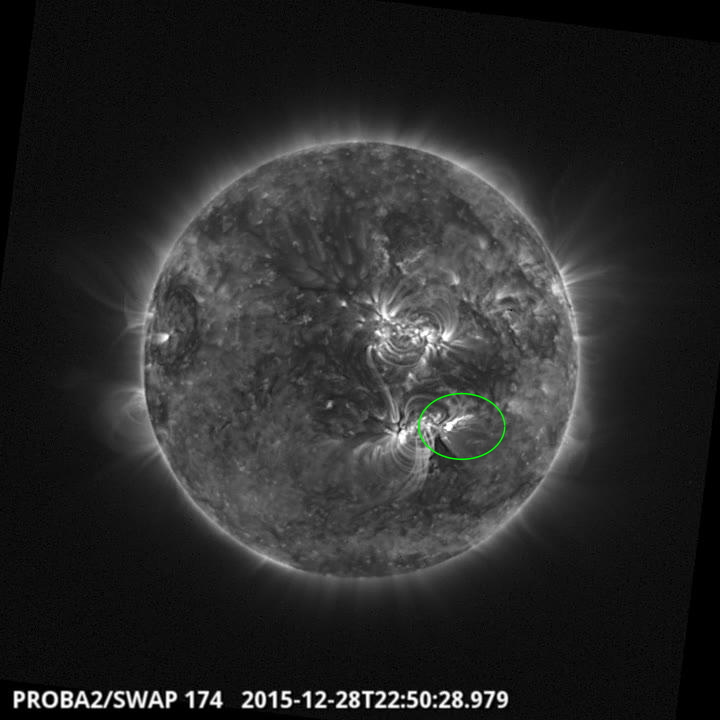
A small eruption was observed in SWAP from AR 2473 in the south west quadrant at 22:50 UT
on 2015Dec28 see above SWAP image
Find a movie of the events here (SWAP movie)
http://proba2.oma.be/swap/data/mpg/movies/20151228_swap_movie.mp4
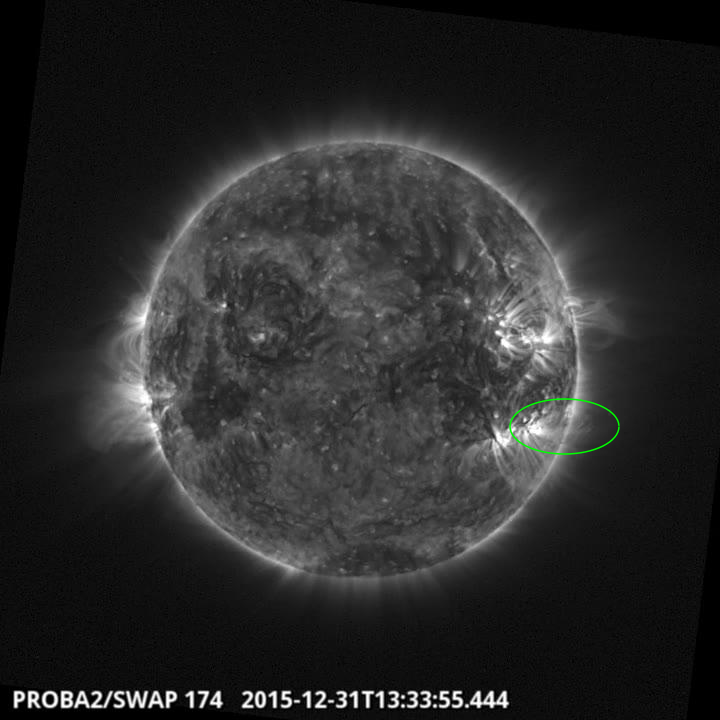
Wednesday Dec 30
A small eruption was observed in SWAP observations on 2015Dec30 at 19:08 UT from AR 2473
in the south west quadrant See the above SWAP image
Find a movie of the event here (SWAP movie)
http://proba2.oma.be/swap/data/mpg/movies/20151230_swap_movie.mp4
Thursday Dec 31
A failed eruption was observed in SWAP on 2015Dec31 at 13:33 UT from AR 2473 from the
south west quadrant See the above SWAP image
Find a movie of the event here (SWAP movie)
http://proba2.oma.be/swap/data/mpg/movies/20151231_swap_movie.mp4
Friday Jan 01
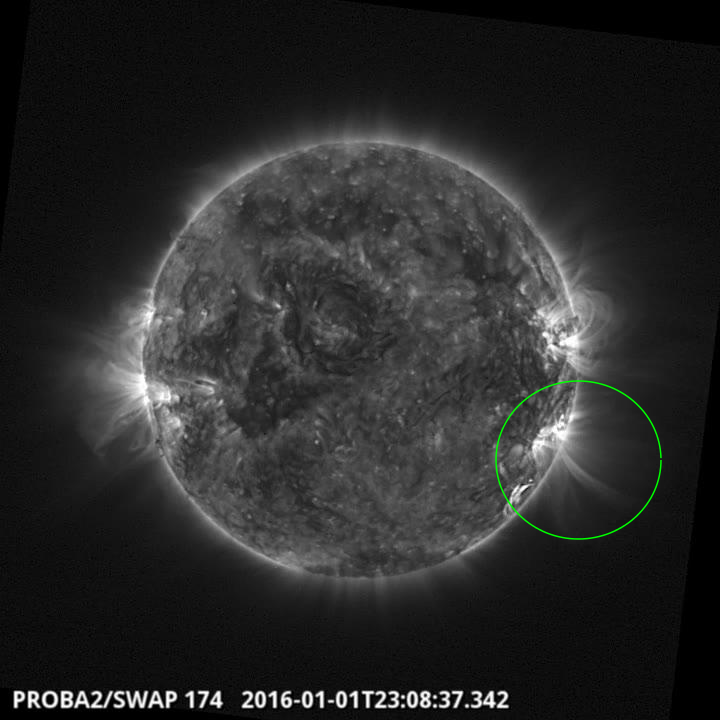
A large eruption was seen in SWAP observations off of west limb at 23:08 UT on 2016Jan01
See the above SWAP image for context
Find a movie of the event here (SWAP movie)
http://proba2.oma.be/swap/data/mpg/movies/20160101_swap_movie.mp4
Review of solar activity
While the only other region on disk, AR 2472, decayed during the week, solar activity was dominated by the active region 2473 which produced several C flares and two long duration (LD) M flares. Both of the M flares were associated with coronal mass ejections and increases in the >10MeV proton fluxes.
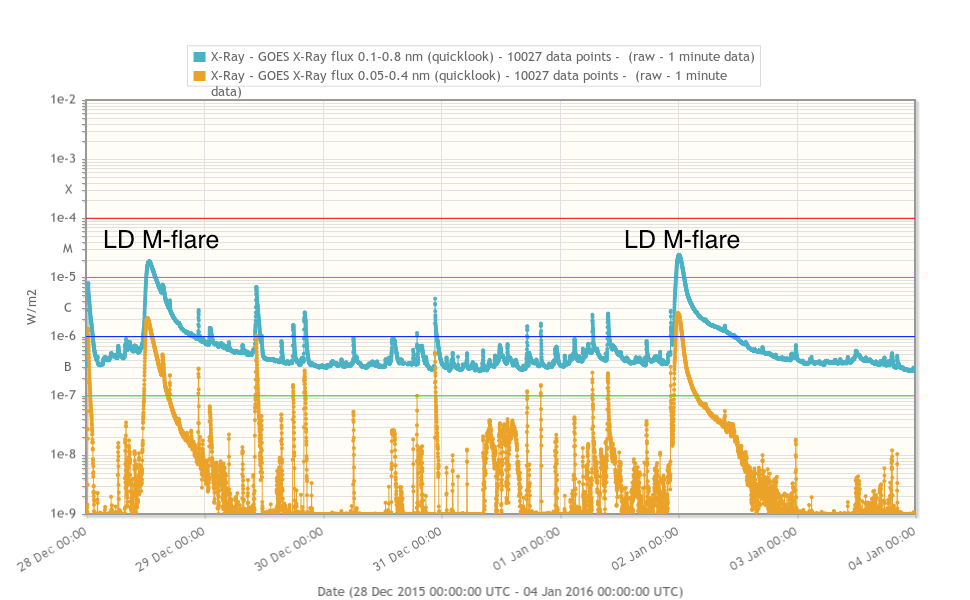
The first long duration M1.8 flare peaked at 12:45UT December 28 and was associated with a partial halo CME first visible in SoHO/LASCO C2 field of view at 12:12UT.
watch the movie: http://www.stce.be/newsletter/movies/CME20151228.mov
watch the LASCO/C2 and difference movie: http://www.stce.be/newsletter/movies/20151230_c2_combo.mp4
It had an angular width of close to 250 degrees with primary angle to the South-West off the Sun-Earth line. Projected speeds were in the order of 600 km/s with a slightly faster component towards the South-East. An impact at Earth was expected in the afternoon of December 30 (around 21:00 UT) and was recorded around midnight December 30/31. This CME initiation also caused a slight and gradual increase of the >10MeV proton flux. It reached a peak just below 4 pfu after midnight December 28/29 before subsiding.
The second long duration M2.3 flare peaked around midnight January 1/2 at 00:11UT. It was associated with a dimming and radio sweeps and was responsible for an increase in the >10 MeV protons and an associated CME was detected in coronagraph data.
watch the cactus- movie: http://www.stce.be/newsletter/movies/CME20160102.mov
watch the LASCO/C2 and difference movie: http://www.stce.be/newsletter/movies/20160103_c2_combo.mp4
The >10 MeV proton flux values passed the event threshold of 10 pfu around 4:30UT, peaked at 21.5 pfu at 4:50UT before subsiding.
SoHO/LASCO C2 coronagraph data show a partial halo CME directed towards the South-West from 23:24UT January 1 onwards. The angular extent of the core is rather limited but counting the angular extent of the shock extensions it may be interpreted as about 200 degrees (CACTUS misinterpreted and overestimated the angular extent). Measured projected speeds are up to 1600 km/s.
The International Sunspot Number (28 Dec 2015 - 3 Jan 2016
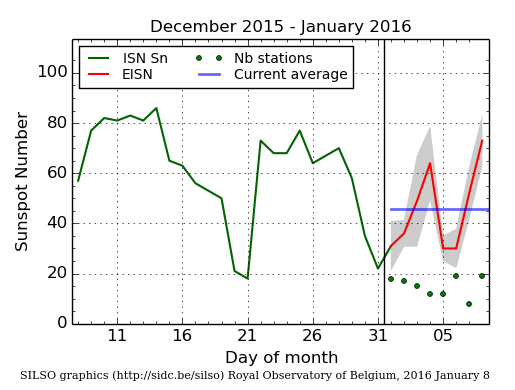
The daily Estimated International Sunspot Number (EISN, red curve with shaded error) derived by a simplified method from real-time data from the worldwide SILSO network. It extends the official Sunspot Number from the full processing of the preceding month (green line). The plot shows the last 30 days (~ one solar rotation). The horizontal blue line shows the current monthly average, while the green dots give the number of stations included in the calculation of the EISN for each day.
Noticeable Solar Events (28 Dec 2015 - 3 Jan 2016)
| DAY | BEGIN | MAX | END | LOC | XRAY | OP | 10CM | TYPE | Cat | NOAA |
| 28 | 1120 | 1245 | 1409 | M1.8 | 370 | CTM/1IV/1 | 5 | 2473 | ||
| 01 | 2310 | 0011 | 0101 | M2.3 | II/1 | 2473 |
| LOC: approximate heliographic location | TYPE: radio burst type |
| XRAY: X-ray flare class | Cat: Catania sunspot group number |
| OP: optical flare class | NOAA: NOAA active region number |
| 10CM: peak 10 cm radio flux |
Review of geomagnetic activity
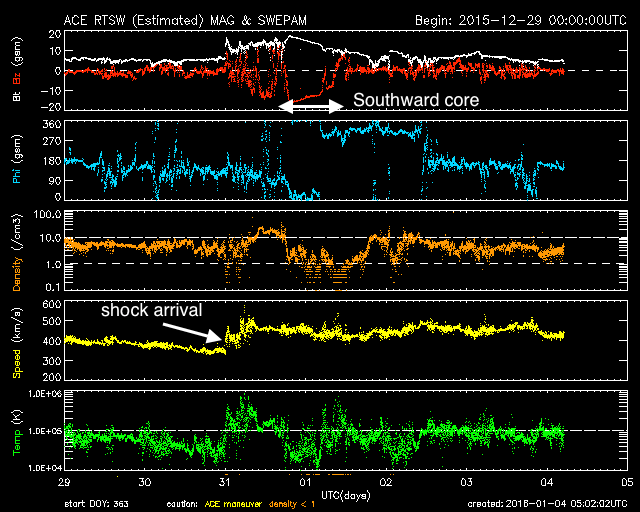
Solar wind conditions started the week near nominal until the arrival of the shock from the December 28 CME around midnight December 30/31 at 00:02UT. As measured by ACE, total interplanetary magnetic field jumped from 6nT to 13nT while the solar wind speed jumped from 340km/s to 400 km/s. Solar wind speed kept increasing to a peak of around 500 km/s. Total magnetic field was in the 9-17nT range but within the sheet Bz was initially variable and remained above -10nT. With the passage of the core, later on December 31 and January 1, the magnetic field was oriented almost directly Southward with a peak value of Bz of -16nT and slowly decreasing in magnitude.
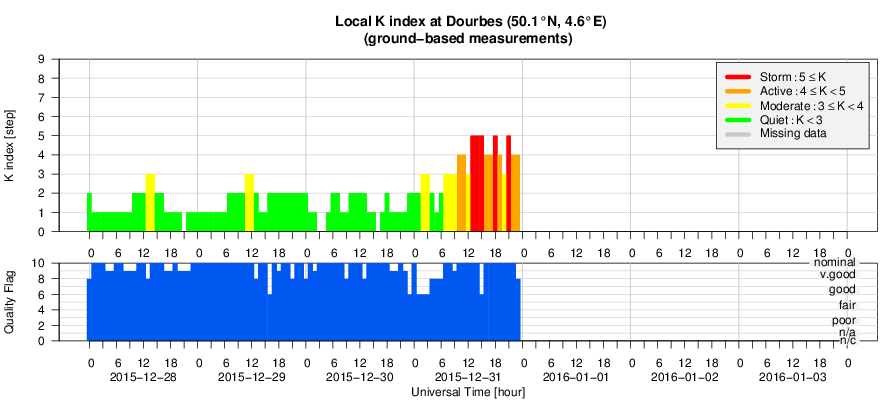
In response, geomagnetic conditions reached minor storm levels locally (K Dourbes 5) and moderate geomagnetic storm levels globally (NOAA Kp 6). Solar wind conditions remained slightly elevated throughout the remainder of the week with quiet to unsettled geomagnetic conditions.
Geomagnetic Observations at Dourbes (28 Dec 2015 - 3 Jan 2016)
Review of ionospheric activity (28 Dec 2015 - 3 Jan 2016)
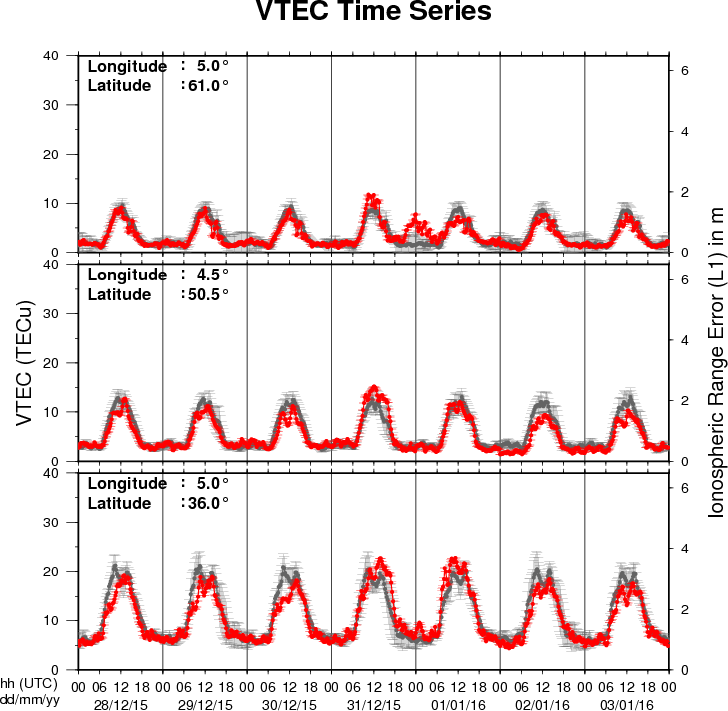
The figure shows the time evolution of the Vertical Total Electron Content (VTEC) (in red) during the last week at three locations:
a) in the northern part of Europe(N61°, 5°E)
b) above Brussels(N50.5°, 4.5°E)
c) in the southern part of Europe(N36°, 5°E)
This figure also shows (in grey) the normal ionospheric behaviour expected based on the median VTEC from the 15 previous days.
The VTEC is expressed in TECu (with TECu=10^16 electrons per square meter) and is directly related to the signal propagation delay due to the ionosphere (in figure: delay on GPS L1 frequency).
The Sun's radiation ionizes the Earth's upper atmosphere, the ionosphere, located from about 60km to 1000km above the Earth's surface.The ionization process in the ionosphere produces ions and free electrons. These electrons perturb the propagation of the GNSS (Global Navigation Satellite System) signals by inducing a so-called ionospheric delay.
See http://stce.be/newsletter/GNSS_final.pdf for some more explanations ; for detailed information, see http://gnss.be/ionosphere_tutorial.php
Future Events
For more details, see http://www.spaceweather.eu/en/event/future
COSPAR/ILWS workshop: science for space weather in Goa, India
Start : 2016-01-24 - End : 2016-01-29
Understanding and being able to forecast space weather is an
increasingly important aspect of our modern technology-reliant
society. This workshop will treat all aspects of space weather,
ranging from solar origins of transient events (CMEs, Flares, CIRs)
to their propagation through the heliosphere and effects on Earth
and planetary bodies, from particle energization to forecasting
particle environment and its effects on technological and
biological systems, as well as solar-cycle effects and coupling of
space weather to atmospheric response. Metrics to assess
predictions will also be discussed. The workshop is structured
along the lines of the COSPAR space weather pathways and will
include invited, contributed talks and posters, as well as panel
discussions and tutorials.
Website:
http://www.cessi.in/ssw/program.html
The Scientific Foundation of Space Weather
Start : 2016-06-27 - End : 2016-07-01
Website:
http://www.issibern.ch/program/workshops.html