- Table of Content
- 1.The duration o...
- 2.Space Technolo...
- 3.PROBA2 Observa...
- 4.Review of sola...
- 5.The Internatio...
- 6.Review of geom...
- 7.Geomagnetic Ob...
- 8.Review of iono...
- 9.Future Events
2. Space Technology and Calibration Laboratories (STCL) Support for space and ground-based instruments
3. PROBA2 Observations (4 Jan 2016 - 10 Jan 2016)
4. Review of solar activity
5. The International Sunspot Number
6. Review of geomagnetic activity
7. Geomagnetic Observations at Dourbes (4 Jan 2016 - 10 Jan 2016)
8. Review of ionospheric activity (4 Jan 2016 - 10 Jan 2016)
9. Future Events
The duration of solar flares
In several previous news items, solar flares are often marked as impulsive or long duration events, meaning they last resp. only a few minutes or more than one hour. This news item will focus on the typical duration of a solar flare, thus providing a reference to appreciate the extreme duration of some solar flares.
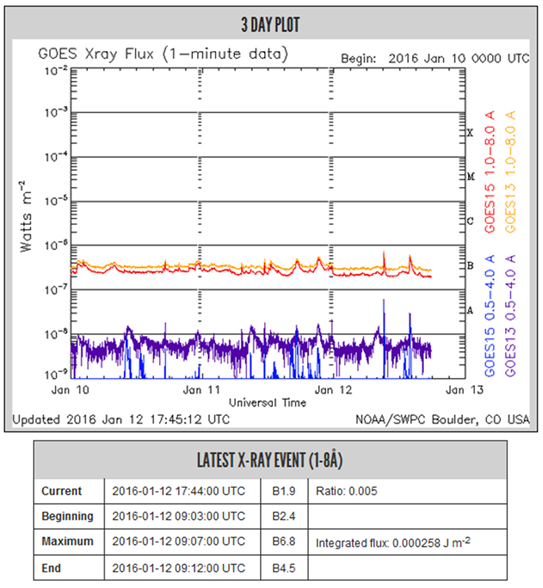
The x-ray signatures of solar flares are observed by the GOES series of satellites (http://www.swpc.noaa.gov/products/goes-x-ray-flux ) since 1976, and are published by NOAA (http://www.swpc.noaa.gov/products/solar-and-geophysical-event-reports ) and archived at NGDC (ftp://ftp.ngdc.noaa.gov/STP/space-weather/ ). The begin time of an x-ray event is defined as the first minute, in a sequence of 4 minutes, of steep monotonic increase in the 0.1-0.8 nm x-ray flux. The x-ray event maximum is taken as the minute of the peak x-ray flux. The end time is the time when the flux level decays to a point halfway between the maximum flux and the pre-flare background level, as illustrated underneath. Note also the logarithmic scale of the vertical axis (x-ray flux), with each x-ray class (B, C, M, X) 10 times stronger than the foregoing and the X-class ("eXtreme") being the strongest.
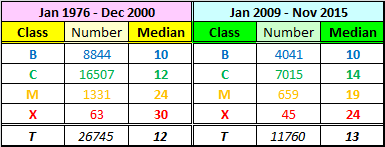
The duration for all flares that have occurred between January 2009 and November 2015 (solar cycle 24) was determined. For each x-ray class, the median duration (minutes) was calculated. The median is that number separating the higher half of a data sample from the lower half. The results can be found in the table underneath, and was compared to a result from Veronig et al. (2002; Table 3) that concerned the period January 1976 to December 2000. A more detailed, technical result can be found at http://sidc.oma.be/news/332/Picture3.png . The table shows that, based on 11.760 flaring events with valid timings, a B-class flare lasts about 10 minutes, a C-class flare 14 minutes, an M-class flare has a duration of about 19 minutes, and X-class flares usually last about 24 minutes. These results indicate indeed that stronger flares last longer. The duration of M- and X-class flares seem to be a bit shorter than in the Veronig et al. research, which may be due to the smaller number of flares, as well as the fact that only part of the relatively weak SC24 has elapsed so far.
The reason why the median was used for this investigation, and not the average, has all to do with the frequency distribution of solar flares. Indeed, if one bins the number of flares per 5 minutes of duration (e.g. 5-9 minutes, 10-14 minutes, and so on up to 2 hours), one can clearly see that this distribution is skewed. This is demonstrated by the figure underneath, showing the flare distribution for the 4 x-ray classes (same color code as table above). It shows a concentration of flares towards the short duration, followed by a long tail towards ever increasing durations. Simply taking the "average" of the durations would then give a too high value for the "mean" duration of most flares within that class. The graphs also show how the peak number of the distribution moves towards longer durations as the strength of the x-ray class increases. Another conclusion is that the wording "impulsive" (events lasting less than 10 minutes) should not be used for B- and C-class flares, as 25-45% of these flares fall in this duration bin.
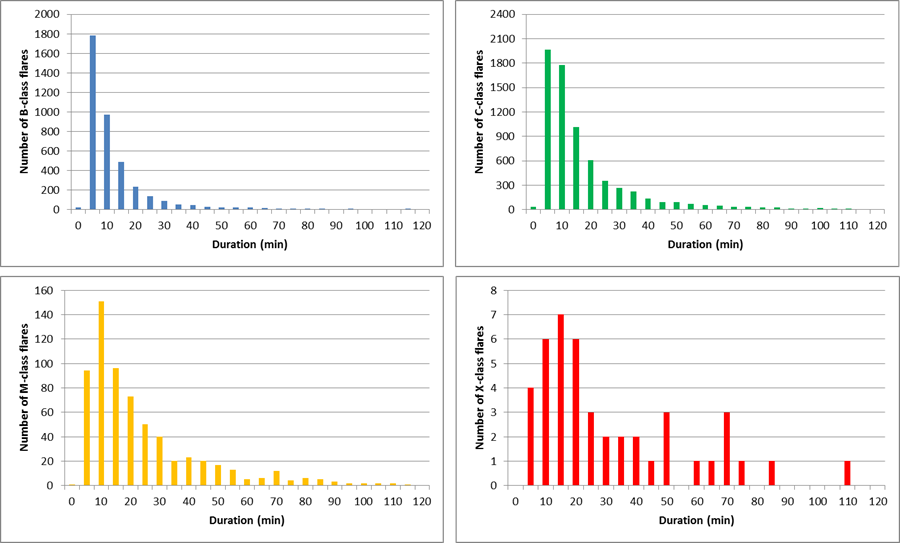
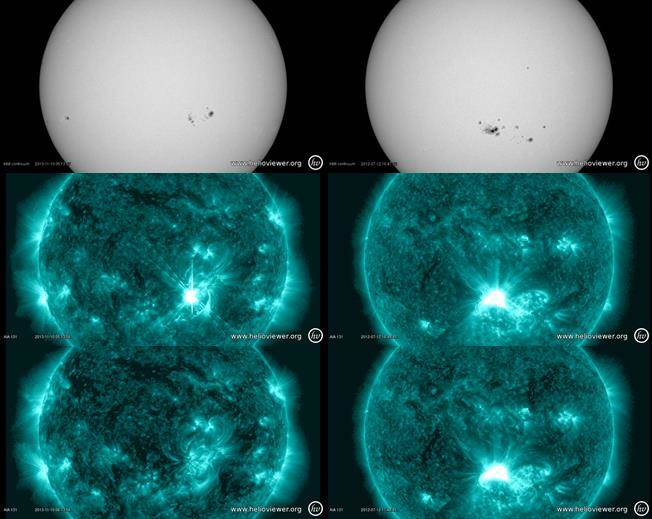
The above histograms suggest a wide range of durations within a single x-ray class. This is true, and applies even to the peak flux within a class. As an example, there are M1 flares that last barely 5 or 6 minutes, but there are also M1 flares with a duration of several hours, such as the one on 17 July 2012 in sunspot group NOAA 11520 lasting a whopping 7 hours and 1 minute! Another example illustrates the different outlook these impulsive and long duration flaring events have in extreme ultraviolet (EUV) imagery. The figure underneath shows a white light image (SDO/HMI) of the active regions responsible for a short and a long duration X1 flaring event. These took place resp. in NOAA 11890 on 10 November 2013 (duration: 10 minutes) and in NOAA 11520 on 12 July 2012 (duration: 113 minutes or nearly 2 hours). The EUV images (SDO/AIA 131) show the outlook during the timing of the x-ray peak, and just 1 hour later. The difference is remarkable to say the least.
Studies of frequency distributions of solar flares are useful for the physics behind solar flares, for any evolution over multiple solar cycles, as well as for providing a first idea in space weather forecasts and on potential space weather effects. As an example, long duration events (LDE; duration greater than 60 minutes; other possible definition by NOAA at http://www.swpc.noaa.gov/content/space-weather-glossary#longduration) are usually associated with coronal mass ejections (CME), whereas impulsive flares are not. Of course there are notorious exceptions such as the long duration flares produced by NOAA 12192 in October 2014, which had no associated CME at all.
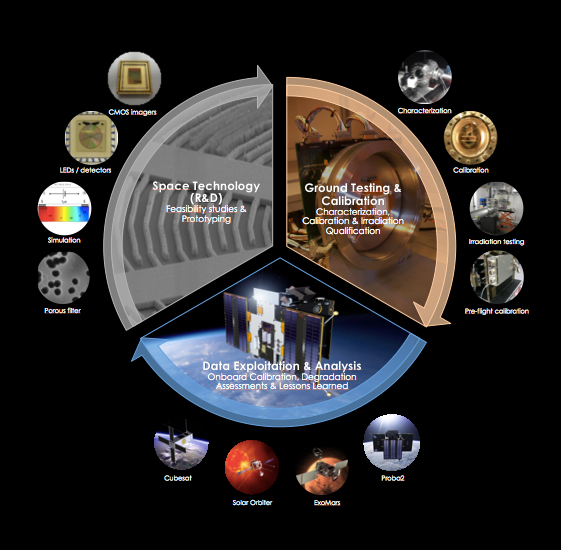
Space Technology and Calibration Laboratories (STCL) Support for space and ground-based instruments
Space, solar and atmospheric radiation is a key factor in the sun-space-earth research and the high-technology that has to deal with or rely on it. Think of communication and navigation high-tech systems. This explains why there is a large interest in ground- and space based instruments measuring the electromagnetic radiation.
However, a production line for scientific and technical instruments doesn't exist. Science and technological projects spanning several years are set up to develop a tailored instrument. Moreover, inventing an instrument from scratch is sort of hard and it is silly that each instrument is doomed to go through the same children-diseases and ageing illness dealing with stubborn hard- and software problems. But, the Space Technology and Calibration Laboratories (STCL) comes at its rescue!
STCL bundles the expertise and laboratory facilities present in the Solar-Terrestrial Centre of Excellence such that adequate support to a team developing an instrument can be given. The STCL knows how to fully characterise an instrument and has an idea on how its performance and ageing is influenced while flying through a hostile environment like space. The STCL is familiar with the synchrotron facilities in Berlin and the cyclotron in Louvain-la-Neuve where an instrument is checked to be launch and space proof, resistant to harmful particle impacts and where the measured spectrum is mapped. The laboratories help to understand how an instrument compares with other instruments and references such that the data can be completely understood and fully exploited. The path towards the instrument calibration!
The offered support will even improve in the future as experiences are being collected and form the basis for new technologies supporting the next generation of scientific instruments.
At your service!
PROBA2 Observations (4 Jan 2016 - 10 Jan 2016)
Solar Activity
Solar flare activity fluctuated between very low and low during the week.
In order to view the activity of this week in more detail, we suggest to go to the following website from which all the daily (normal and difference) movies can be accessed:
http://proba2.oma.be/ssa
This page also lists the recorded flaring events.
A weekly overview movie can be found here (SWAP week 302).
http://proba2.oma.be/swap/data/mpg/movies/weekly_movies/weekly_movie_2016_01_04.mp4
Details about some of this week’s events, can be found further below.
Tuesday Jan 05
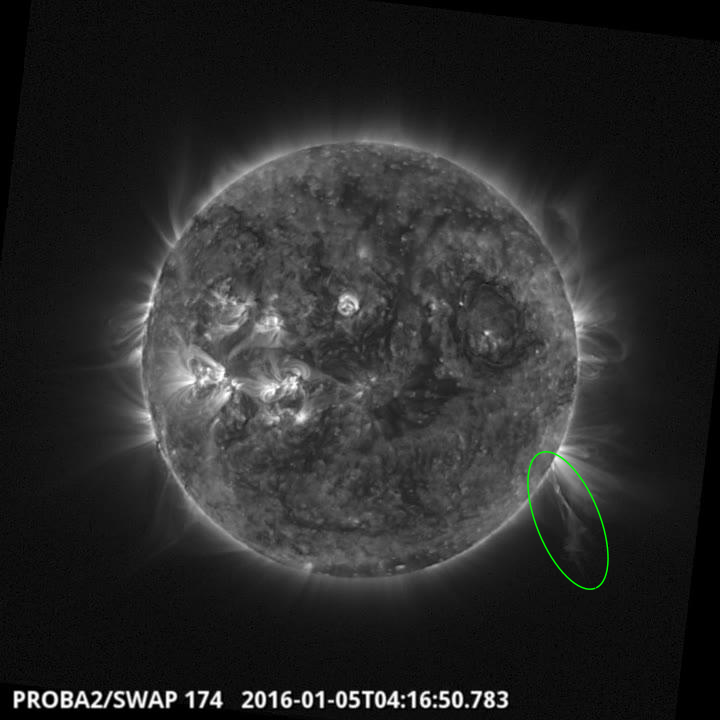
On 2016Jan05 at 04:16 UT SWAP observed an eruption on the west limb as shown in the above
SWAP image
Find a movie of the events here (SWAP movie)
http://proba2.oma.be/swap/data/mpg/movies/20160105_swap_movie.mp4
Wednesday Jan 06
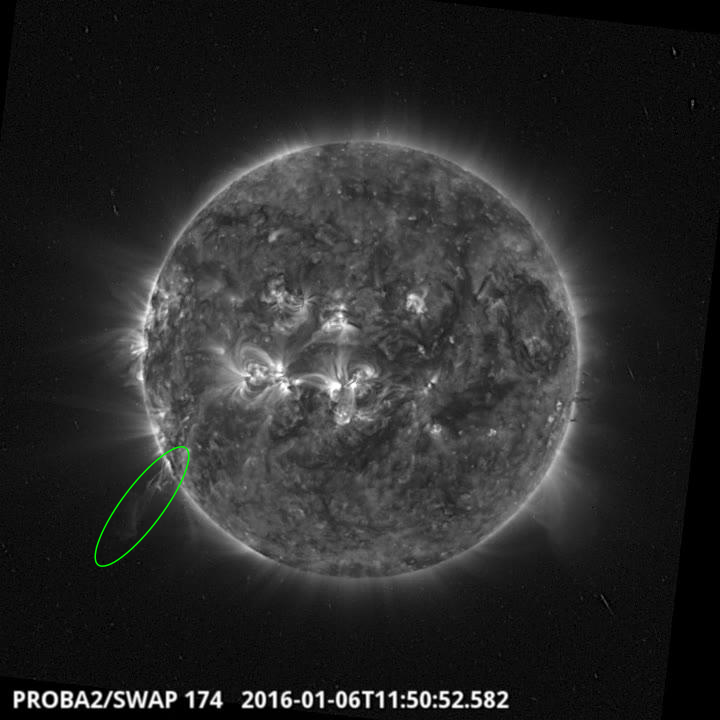
On 2016Jan06 at 11:50 UT SWAP observed an eruption on the east limb as shown in the above
SWAP image
Find a movie of the event here (SWAP movie)
http://proba2.oma.be/swap/data/mpg/movies/20160106_swap_movie.mp4
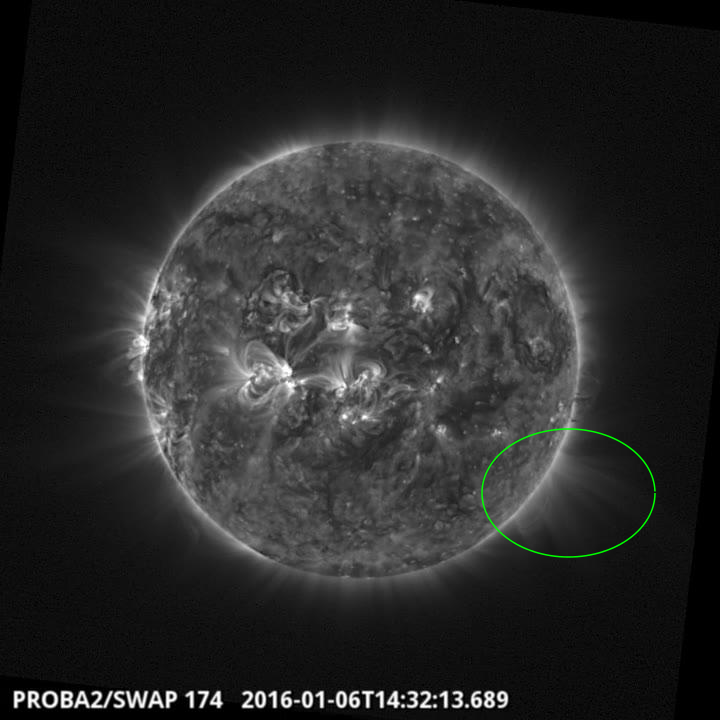
On 2016Jan06 at 14:32 UT SWAP observed an eruption on the west limb as shown in the above
SWAP image
Find a movie of the event here (SWAP movie)
http://proba2.oma.be/swap/data/mpg/movies/20160106_swap_movie.mp4
Review of solar activity
Flares
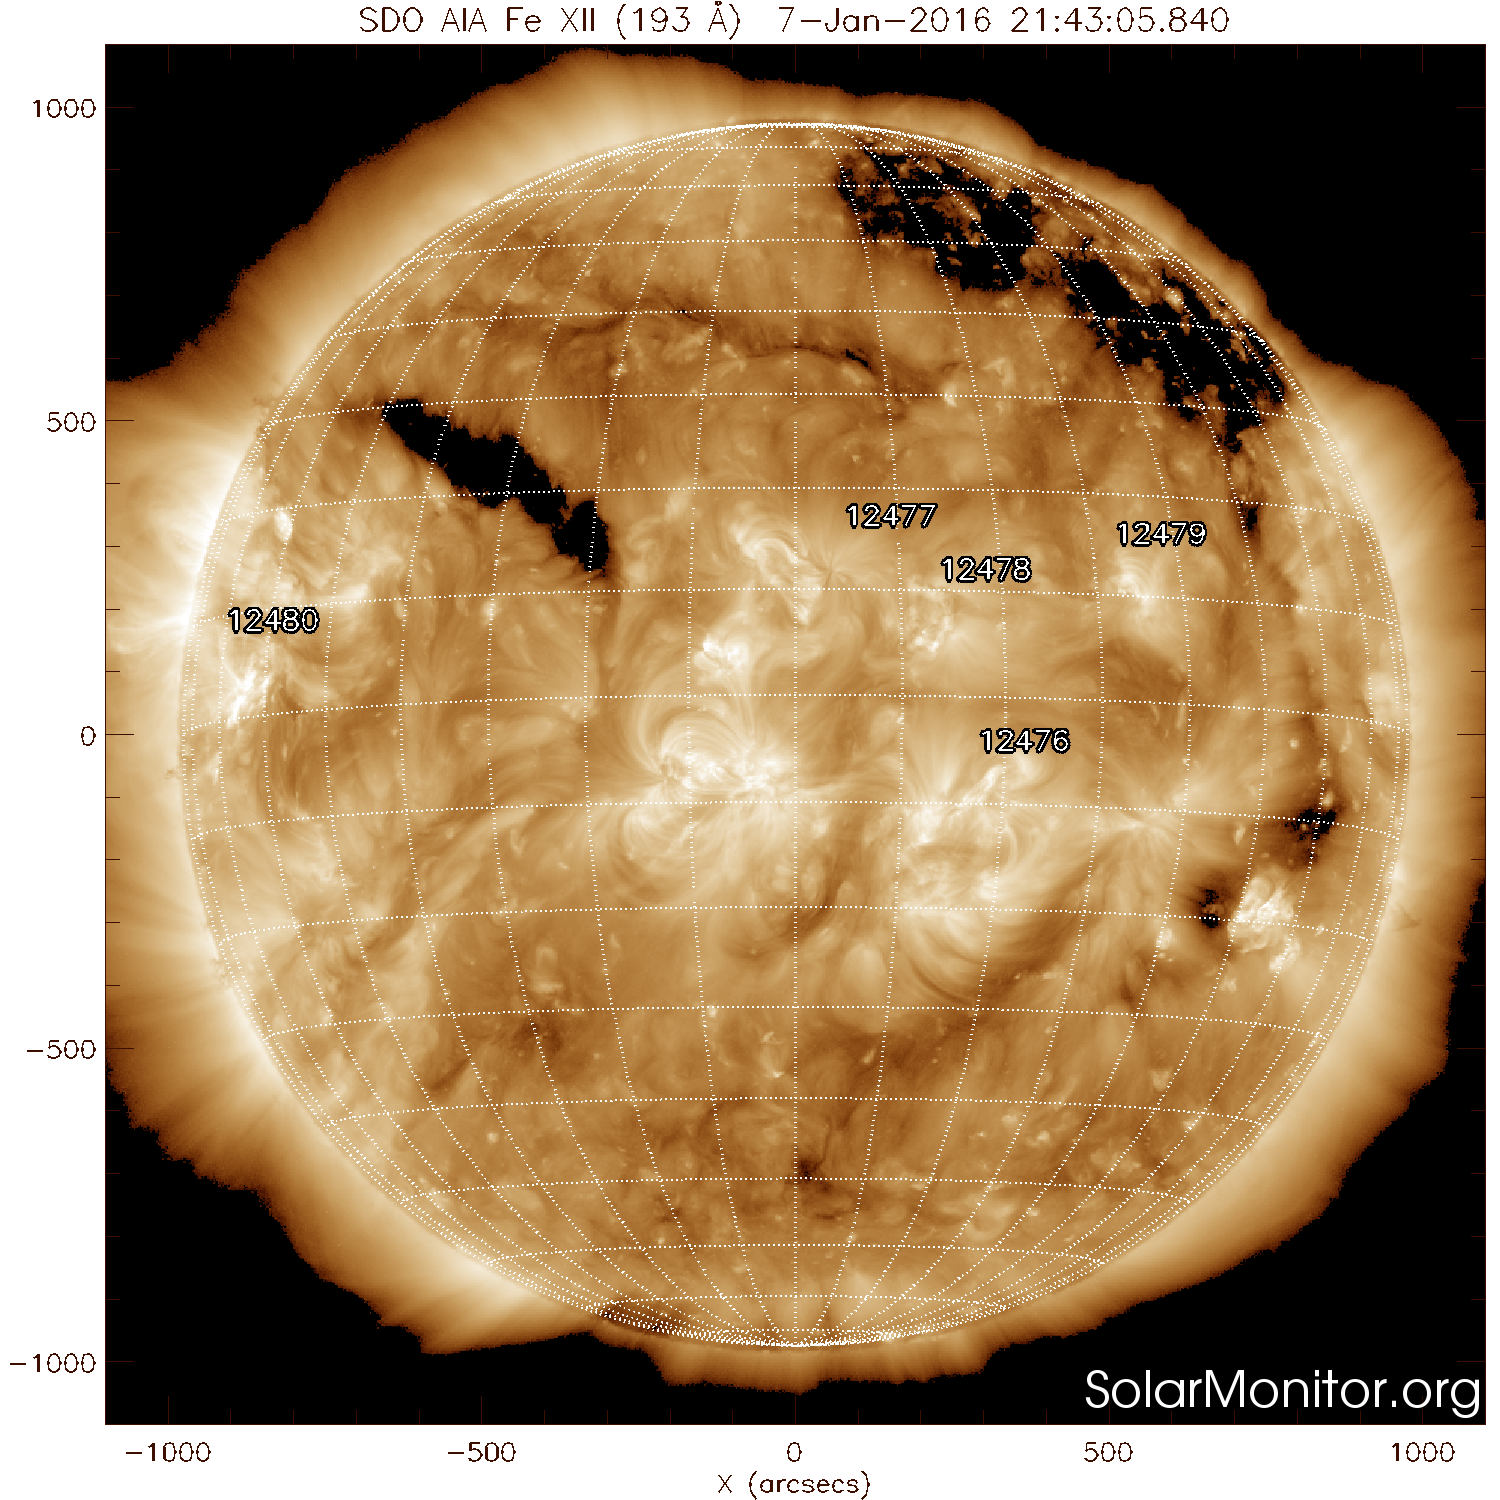
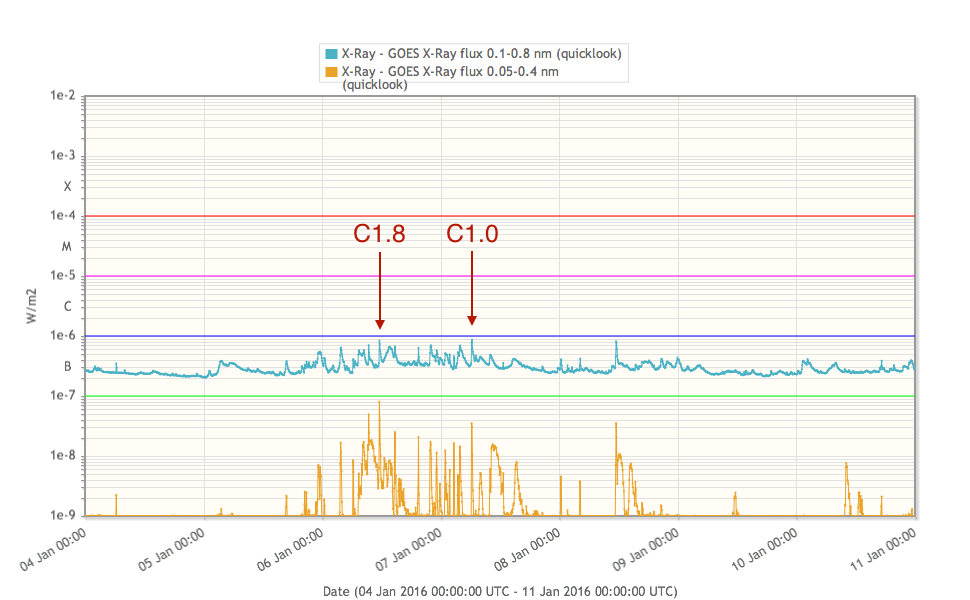
Solar activity was very low throughout the week. Only 2 C-class flares were recorded: a C1.8 peaking at 11:37 UT on January 6, and a C1.0 flare peaking at 06:17 UT on January 7, both from NOAA AR 2480, at that moment in the north-east part of the heliosphere.
Coronal Mass Ejections
A halo CME occurred on January 6 at 14:12 (LASCO-C2). This event was backsided and not expected to arrive to the Earth. A previous slow CME (12:00 UT, 250 km/s) was in the field of view of LASCO-C2 when the second one started, CACTus merged these two events and emitted an alert as a full halo CME. The slow CME had an angular width of 100 degrees, originated from a filament eruption close to the eastern limb and was mostly directed to the south-east.
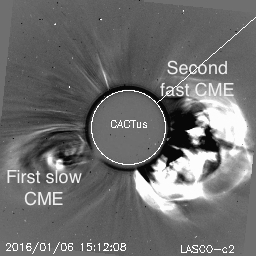
The second CME (intense feature on the right in the image above) left the Sun at a later time than the first CME (more faint feature on the left), but around 15UT, both reached the same radial distance from the solar surface.
The International Sunspot Number
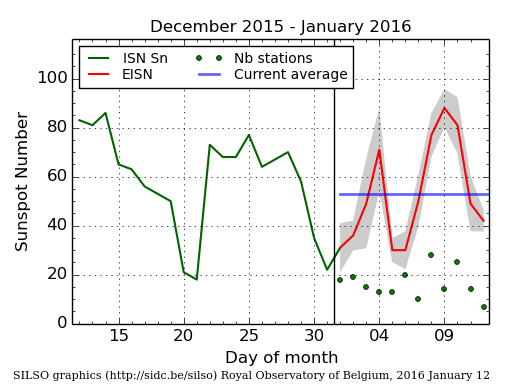
The daily Estimated International Sunspot Number (EISN, red curve with shaded error) derived by a simplified method from real-time data from the worldwide SILSO network. It extends the official Sunspot Number from the full processing of the preceding month (green line). The plot shows the last 30 days (~ one solar rotation). The horizontal blue line shows the current monthly average, while the green dots give the number of stations included in the calculation of the EISN for each day.
Review of geomagnetic activity
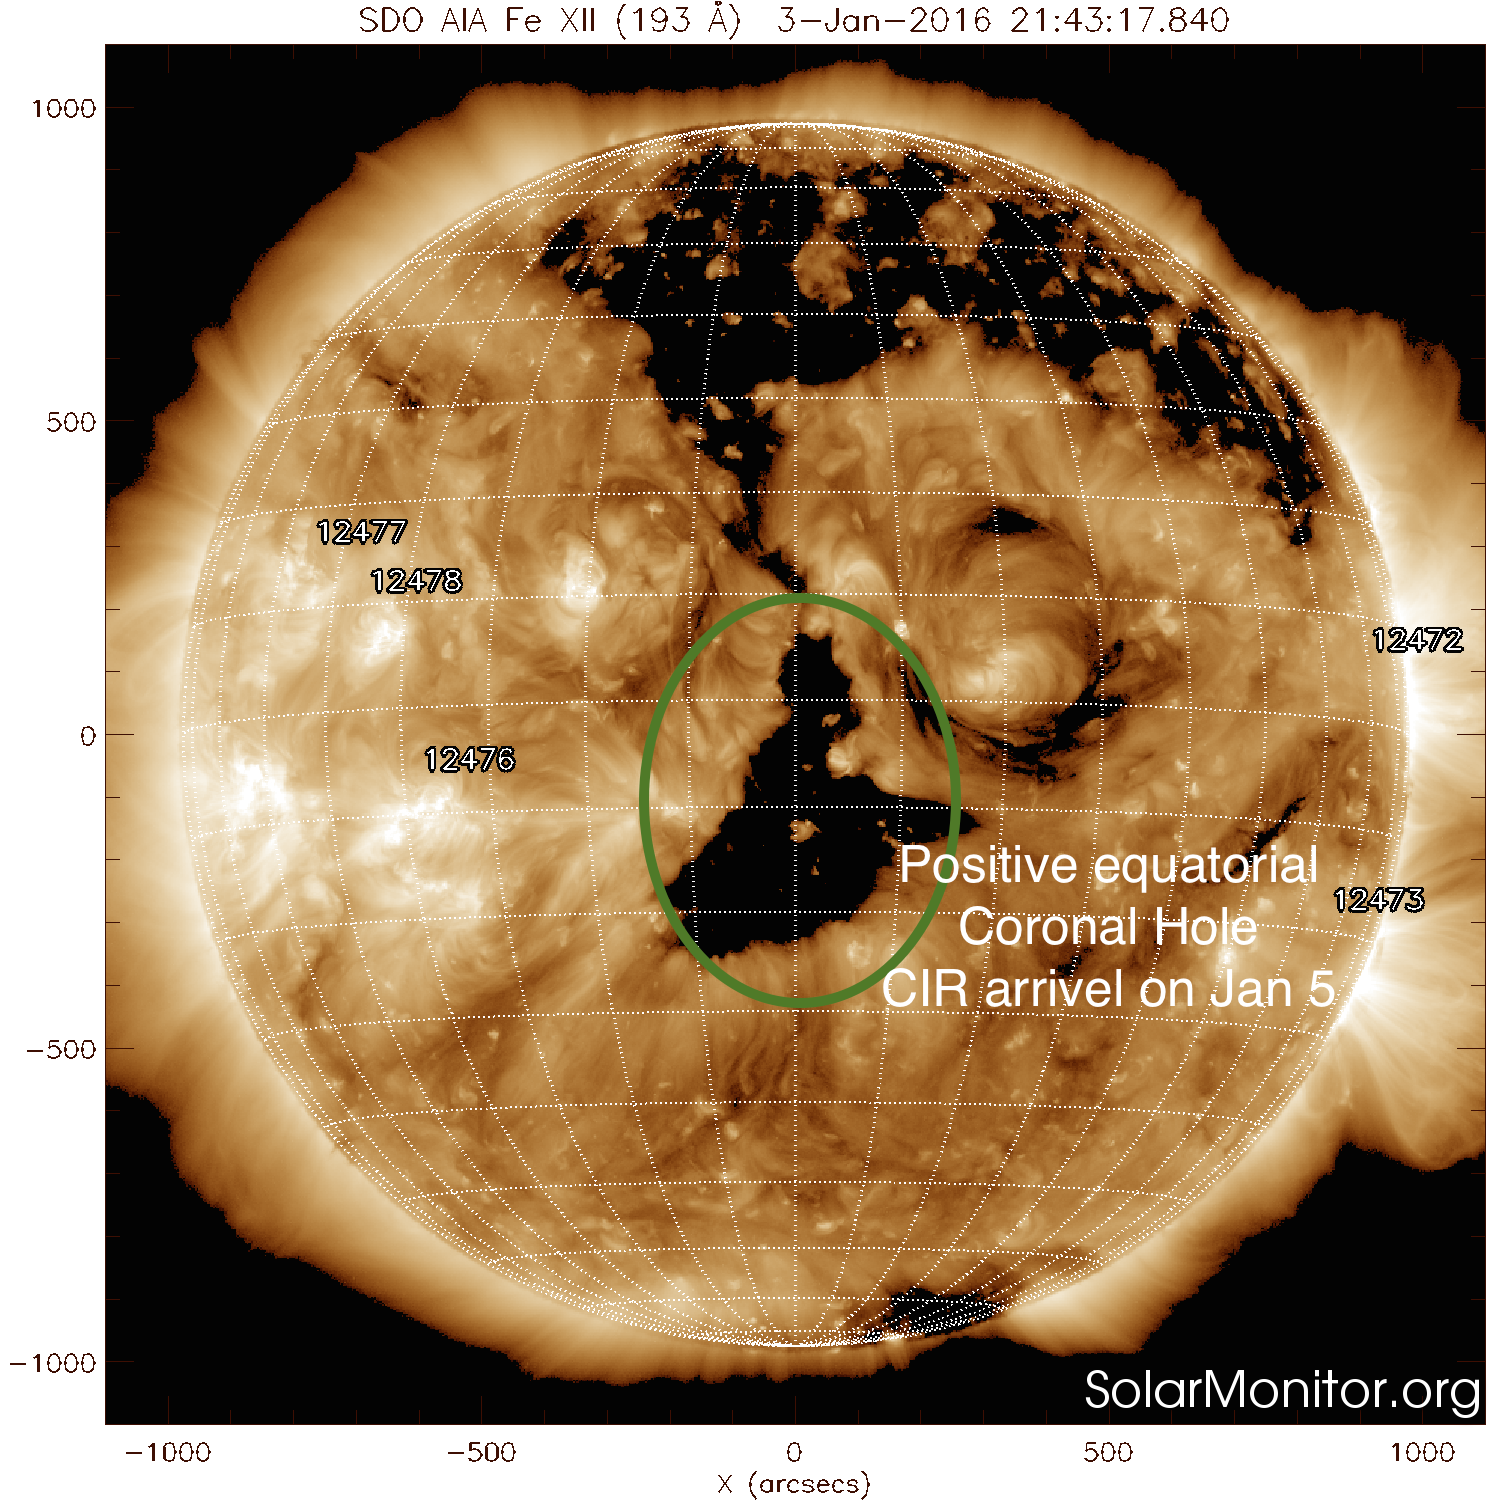
On January 6, a fast solar wind stream from a coronal hole (SDO/AIA picture) arrived to the Earth and created minor storm conditions at planetary levels after midnight on January 6 (K = 5) and active conditions locally (KDourbes = 4) on January 6 and 7. The in situ plasma measurements at L1 showed the CIR arrival (increase in the magnetic field strength and the plasma density) on January 5 (graph below).

The rest of the week levels were quiet to unsettled.
Geomagnetic Observations at Dourbes (4 Jan 2016 - 10 Jan 2016)

Review of ionospheric activity (4 Jan 2016 - 10 Jan 2016)

The figure shows the time evolution of the Vertical Total Electron Content (VTEC) (in red) during the last week at three locations:
a) in the northern part of Europe(N61°, 5°E)
b) above Brussels(N50.5°, 4.5°E)
c) in the southern part of Europe(N36°, 5°E)
This figure also shows (in grey) the normal ionospheric behaviour expected based on the median VTEC from the 15 previous days.
The VTEC is expressed in TECu (with TECu=10^16 electrons per square meter) and is directly related to the signal propagation delay due to the ionosphere (in figure: delay on GPS L1 frequency).
The Sun's radiation ionizes the Earth's upper atmosphere, the ionosphere, located from about 60km to 1000km above the Earth's surface.The ionization process in the ionosphere produces ions and free electrons. These electrons perturb the propagation of the GNSS (Global Navigation Satellite System) signals by inducing a so-called ionospheric delay.
See http://stce.be/newsletter/GNSS_final.pdf for some more explanations ; for detailed information, see http://gnss.be/ionosphere_tutorial.php
Future Events
For more details, see http://www.spaceweather.eu/en/event/future
COSPAR/ILWS workshop: science for space weather in Goa, India
Start : 2016-01-24 - End : 2016-01-29
Understanding and being able to forecast space weather is an
increasingly important aspect of our modern technology-reliant
society. This workshop will treat all aspects of space weather,
ranging from solar origins of transient events (CMEs, Flares, CIRs)
to their propagation through the heliosphere and effects on Earth
and planetary bodies, from particle energization to forecasting
particle environment and its effects on technological and
biological systems, as well as solar-cycle effects and coupling of
space weather to atmospheric response. Metrics to assess
predictions will also be discussed. The workshop is structured
along the lines of the COSPAR space weather pathways and will
include invited, contributed talks and posters, as well as panel
discussions and tutorials.
Website:
http://www.cessi.in/ssw/program.html
The Scientific Foundation of Space Weather
Start : 2016-06-27 - End : 2016-07-01
Website:
http://www.issibern.ch/program/workshops.html