- Table of Content
- 1.The Polar Facu...
- 2.ESWW13 - Call ...
- 3.PROBA2 Observa...
- 4.Review of sola...
- 5.The Daily Inte...
- 6.Review of geom...
- 7.Geomagnetic Ob...
- 8.Review of iono...
- 9.Future Events
2. ESWW13 - Call for sessions
3. PROBA2 Observations (11 Jan 2016 - 17 Jan 2016)
4. Review of solar activity
5. The Daily International Sunspot Number
6. Review of geomagnetic activity
7. Geomagnetic Observations at Dourbes (11 Jan 2016 - 17 Jan 2016)
8. Review of ionospheric activity (11 Jan 2016 - 17 Jan 2016)
9. Future Events
The Polar Faculae are back!
The STCE Newsitem of 9 September 2015 (http://www.stce.be/news/318/welcome.html ) discussed some peculiarities of polar faculae, the relatively bright points that sometimes can be seen near the solar poles. On the highly contrasted SDO/HMI image from 11 January 2016 underneath, two red arrows point out some of these polar faculae. There is a significant difference in outlook between these puny dots and the much brighter main zone faculae (dashed blue), as well as the much bigger and darker sunspots (green).
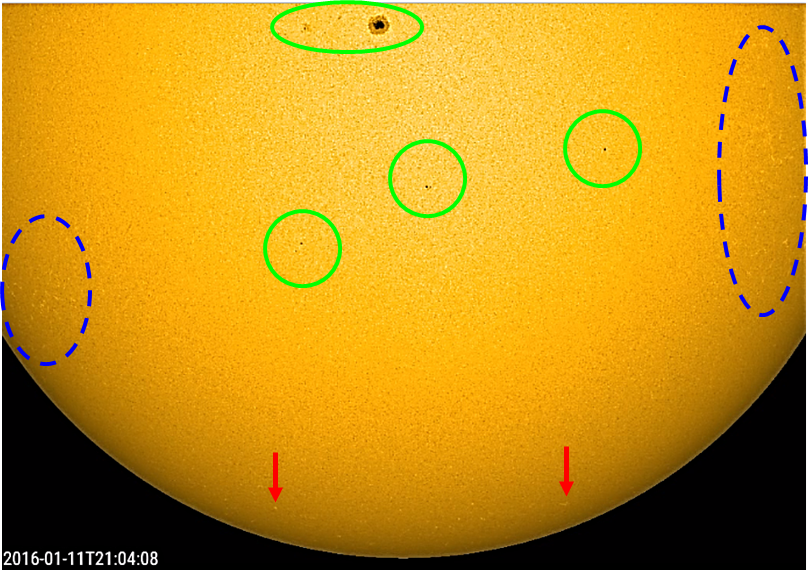
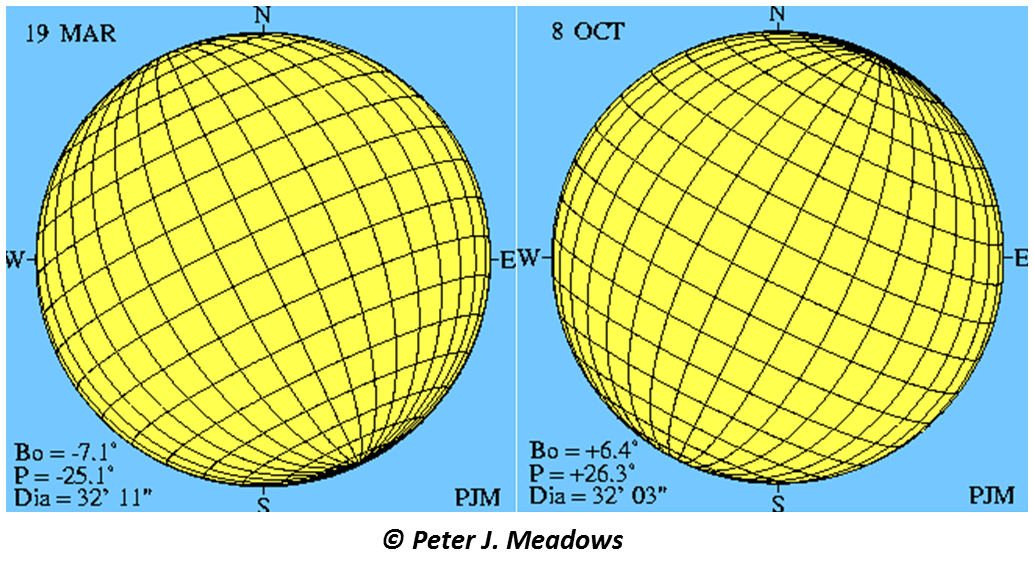
The number of polar faculae near the Sun's south pole had risen sharply during the first half of 2015. However, the further evolution was more difficult to follow, because from mid-July till mid-November, observers on Earth do not have a good view on the Sun's southern pole. This is because the solar axis is inclined by about 7 degrees with respect to the ecliptic (the plane described by the Earth as it orbits the Sun). Hence during autumn, solar observers on Earth have a better view on the solar north pole, whereas about 6 months later, the Sun's south pole is favored. This is illustrated in the graphs (coordination grids) underneath created by Peter J. Meadows. The related animation can be found at http://www.petermeadows.com/html/sunfromearth.html , and the daily numbers for this year can be found in the Yearbook of the Royal Observatory of Belgium at http://www.astro.oma.be/common/pdf/ybook/yearbook_2016.pdf
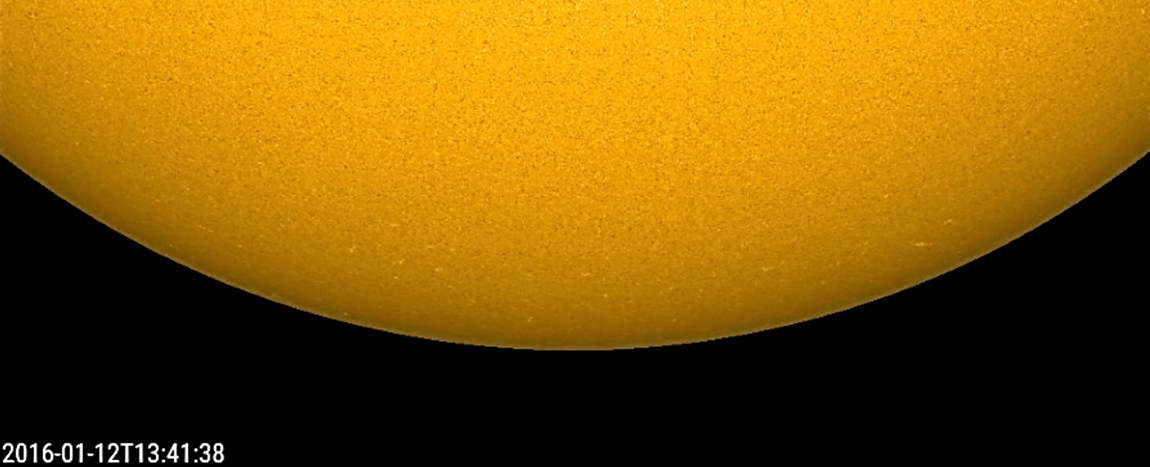
So, as solar observers were gradually getting a better view on the Sun's south pole in January, the expectations were rising. They were not disappointed. There are still relatively large numbers of polar faculae visible near the Sun's south pole, with 5 to 10 "dots" not being an exception. The SDO/HMI image even shows more than a dozen polar faculae, but of course these images are enhanced for contrast and brightness. Moreover, satellites do not suffer from the Earth's atmosphere (clouds, seeing) which is a continuous burden for most observers here on Earth. The movie clip at https://youtu.be/AwUz-m3AUV4 contains a zoom of the relevant area on 11-12 January, with numerous polar faculae visible and lasting long enough to see them actually move with the solar rotation. Most of these polar faculae have latitudes between -60 and -80 degrees, which is far away from sunspot latitudes (0-35 degrees). If you haven't seen the polar faculae thru a telescope yet, no worries. The coming months will provide even better views on the Sun's south pole. The observers on the northern hemisphere are also hoping for some better weather conditions.
ESWW13 - Call for sessions
European Space Weather Week 13
Belgium, November 2016
**** Call for Sessions *****
Dear colleagues,
Each year, during the European Space Weather Week conference, people from all over the world gather to discuss the newest insights in space weather and try to find appropriate answers to the challenges and threats that space weather imposes. Science, data exploitation, observations, service development, operational models, engineering, industrial challenges, etc. are all relevant aspects of space weather.
The strength of the conference is that the participants can contribute largely to its content leading to a rich and varied programme. We therefore invite and encourage you and your colleagues to submit proposals for sessions.
Session proposals can be submitted from January 15, 2016 onwards at http://www.stce.be/esww13/
The deadline for submission is February 5, 2016, included.
Happy submission!
Mauro Messerotti and Petra Vanlommel, on behalf of the ESWW Programme Committee
PROBA2 Observations (11 Jan 2016 - 17 Jan 2016)
Solar Activity
Solar flare activity fluctuated between very low and low during the week.
In order to view the activity of this week in more detail, we suggest to go to the following website from which all the daily (normal and difference) movies can be accessed:
http://proba2.oma.be/ssa
This page also lists the recorded flaring events.
A weekly overview movie can be found here (SWAP week 303).
http://proba2.oma.be/swap/data/mpg/movies/weekly_movies/weekly_movie_2016_01_11.mp4
Details about some of this week’s events, can be found further below.
Tuesday Jan 12
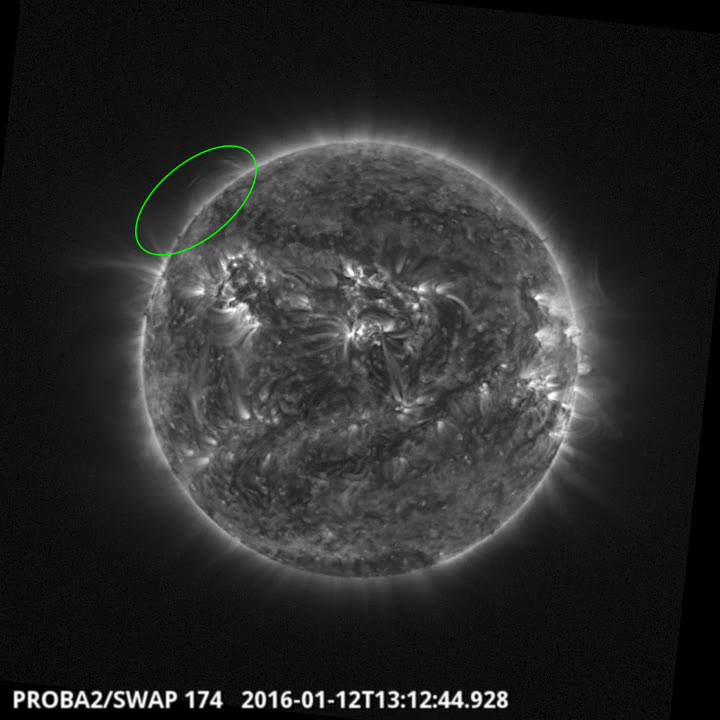
A series of flows and brightennings were seen on the east solar limb in SWAP images on
2016Jan12 at 13:12 UT
Find a movie of the event here (SWAP movie)
http://proba2.oma.be/swap/data/mpg/movies/20160112_swap_movie.mp4
Review of solar activity
During this week solar activity was very low with only 4 C-class flares observed by GOES, and all of them originating from the Catania sunspot group 7 (NOAA AR 2480). The strongest reported flare was the C2.8 flare which peaked at 02:39 UT on January 15.
Only one wide CME was observed this week. A large filament in the southern solar hemisphere erupted at about 22:15 UT on January 14. In the H-alpha images below, the filament is visible on January 13, while is has disappeared on January 15.
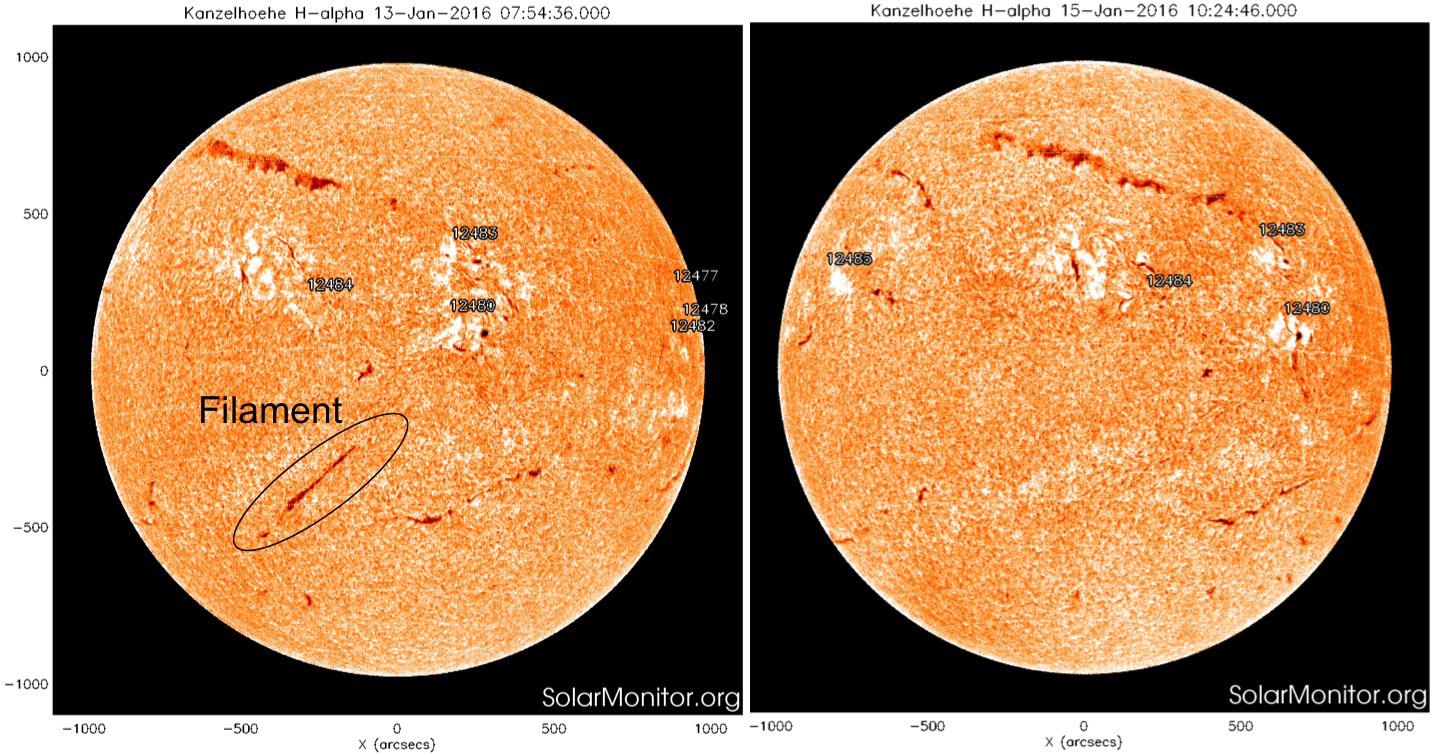
The filament eruption was associated with coronal dimming and halo CME. The CME was first seen in the SOHO LASCO C2 field of view at about 23:36 UT, had angular width of at least 280 degrees and projected plane of the sky speed of about 250 km/s (as reported by CACTUS software). This CME probably arrived at the Earth late on January 18 at 20:55 UT.
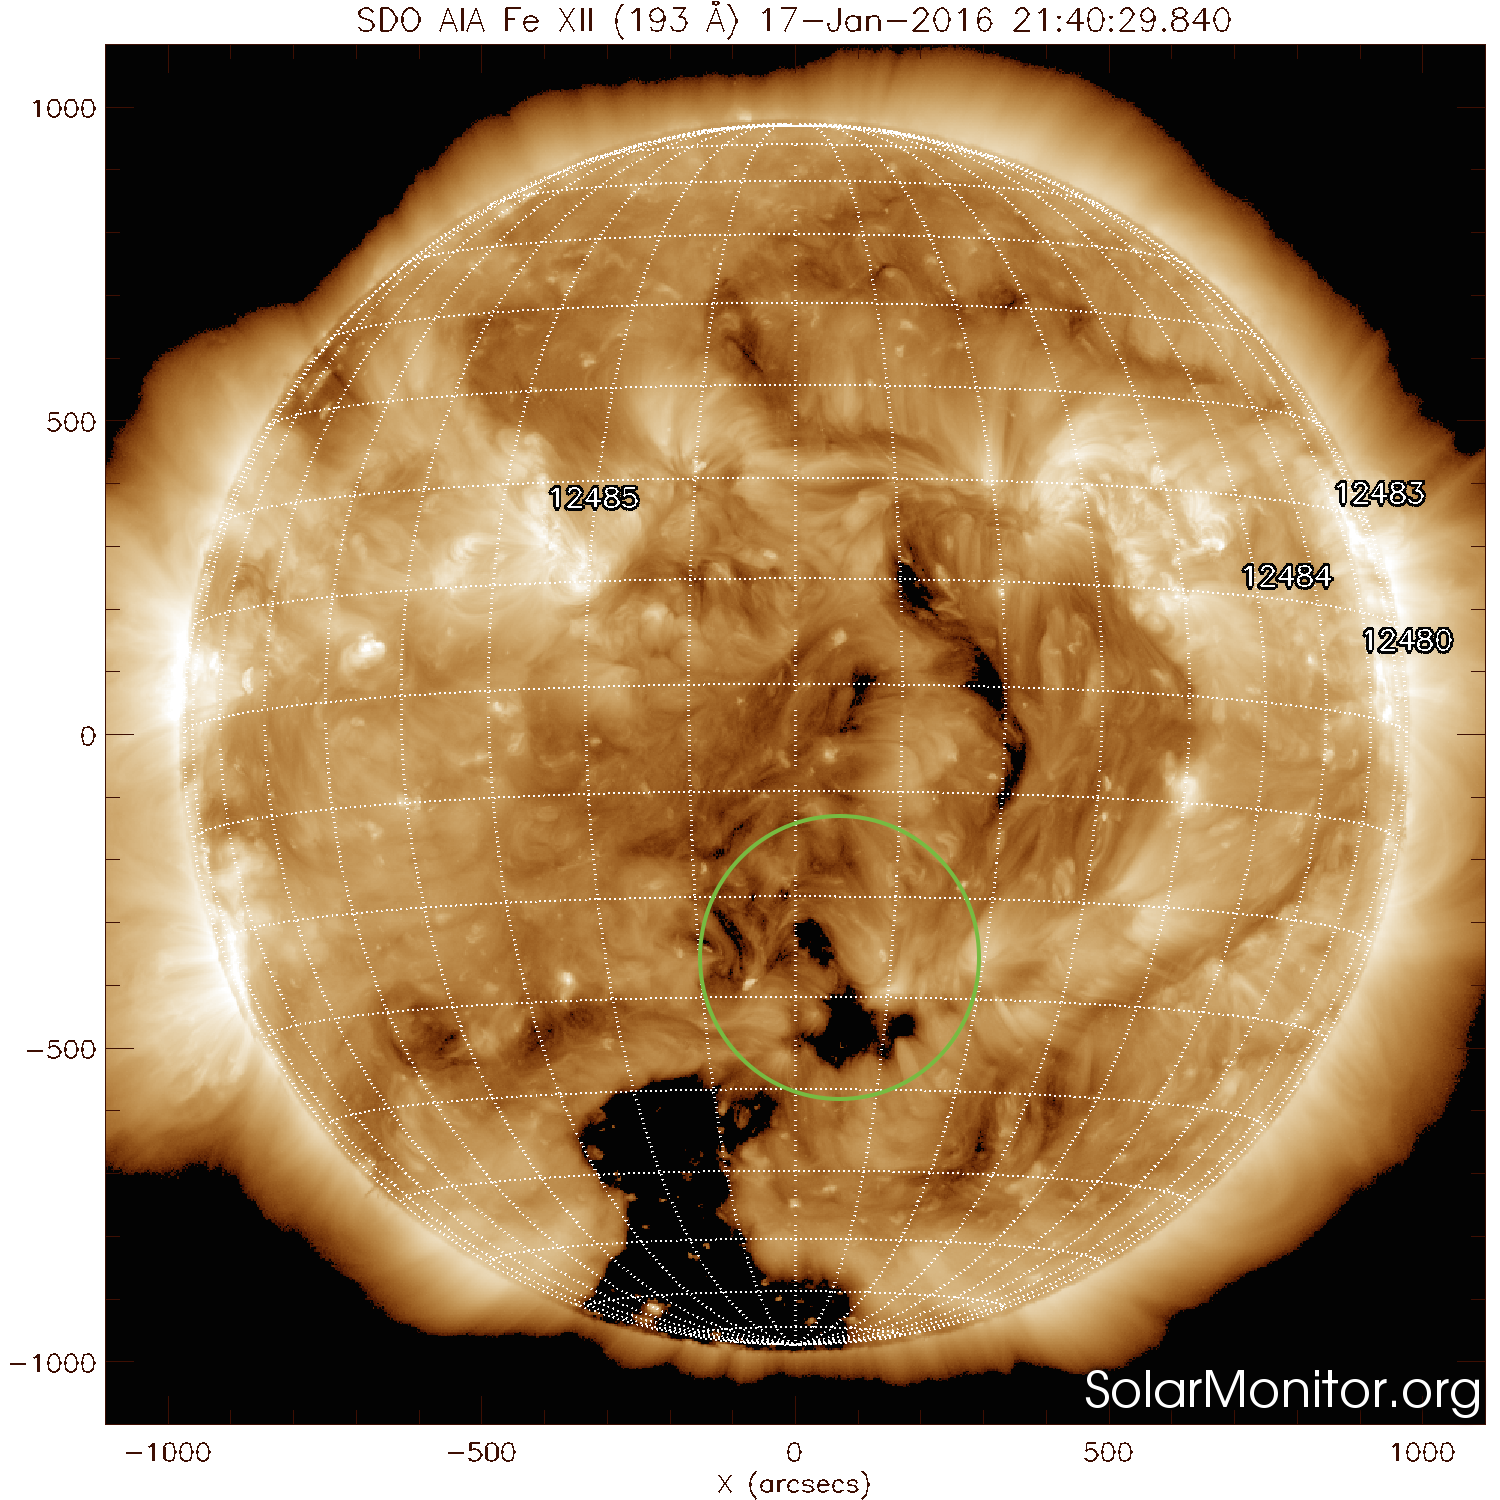
A small low latitude coronal hole in the southern hemisphere, seemingly to be an extension of the southern polar coronal hole, reached the central meridian on January 17.
The Daily International Sunspot Number
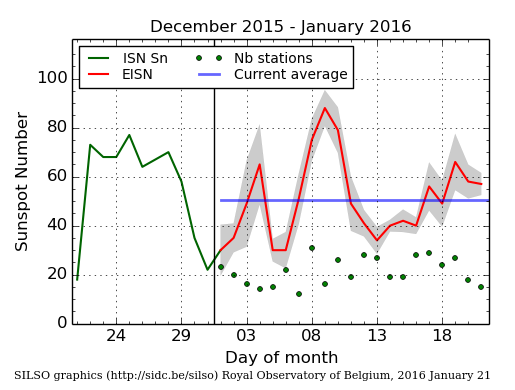
The daily Estimated International Sunspot Number (EISN, red curve with shaded error) derived by a simplified method from real-time data from the worldwide SILSO network. It extends the official Sunspot Number from the full processing of the preceding month (green line). The plot shows the last 30 days (~ one solar rotation). The horizontal blue line shows the current monthly average, while the green dots give the number of stations included in the calculation of the EISN for each day.
Review of geomagnetic activity
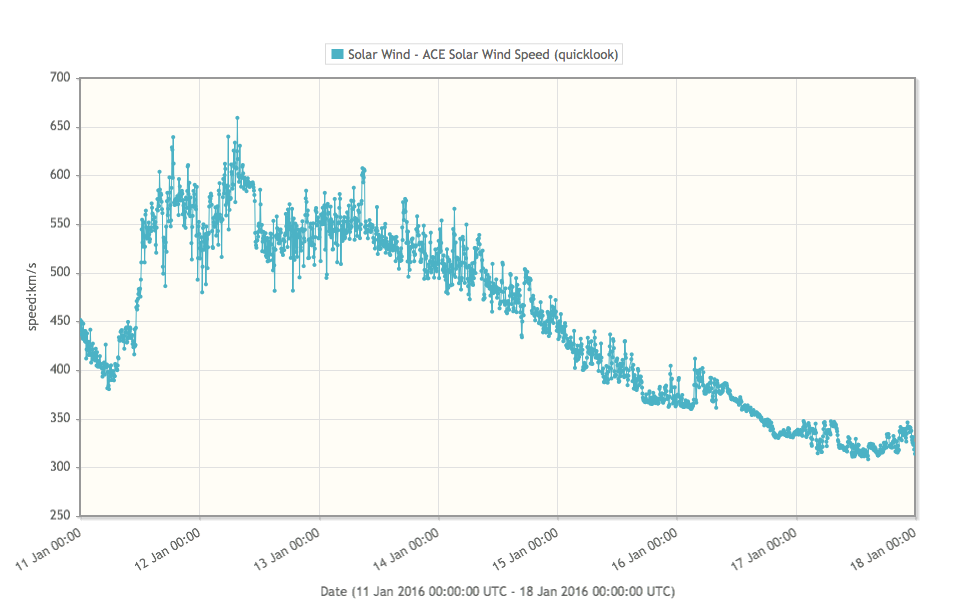
The fast solar wind from the narrow and elongated low latitude coronal hole (between N12 and N34) which reached the central meridian in the early morning of January 09, arrived at the Earth at about 12:30 UT on January 11. The solar wind speed was enhanced (with the maximum value of about 600 km/s) for more than 72 hours. The total interplanetary magnetic field peaked at 10nT on January 11.
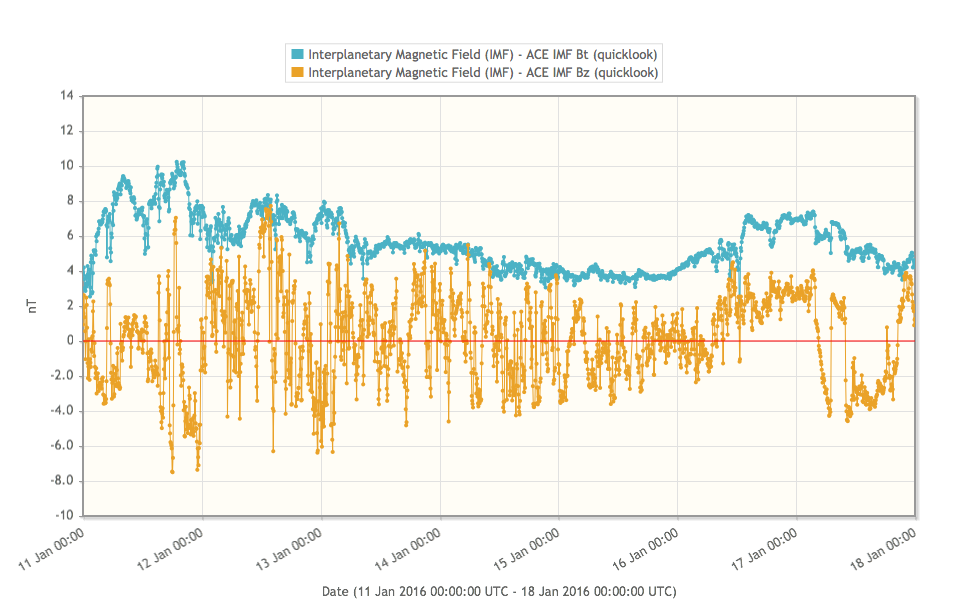
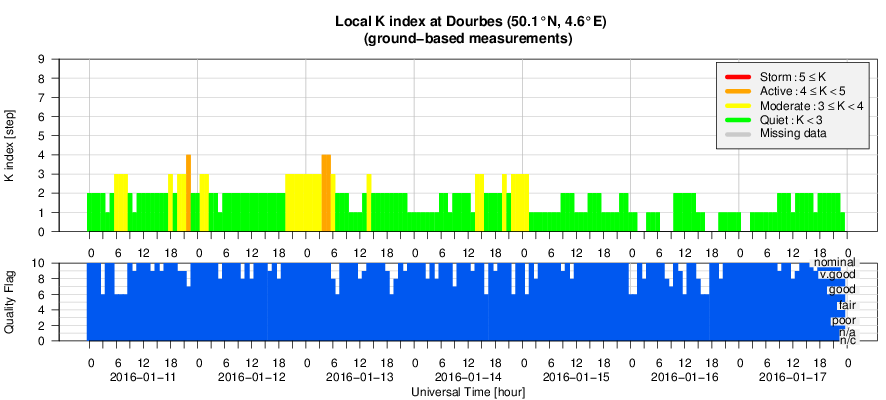
Two intervals of the negative value of the Bz component of the interplanetary magnetic field, in the evening of January 11 and early morning of January 14, induced unsettled to active geomagnetic conditions (NOAA reported a Kp =4 and Dourbes reported K=4). During the rest of the week geomagnetic conditions were quiet to unsettled.
Geomagnetic Observations at Dourbes (11 Jan 2016 - 17 Jan 2016)
Review of ionospheric activity (11 Jan 2016 - 17 Jan 2016)
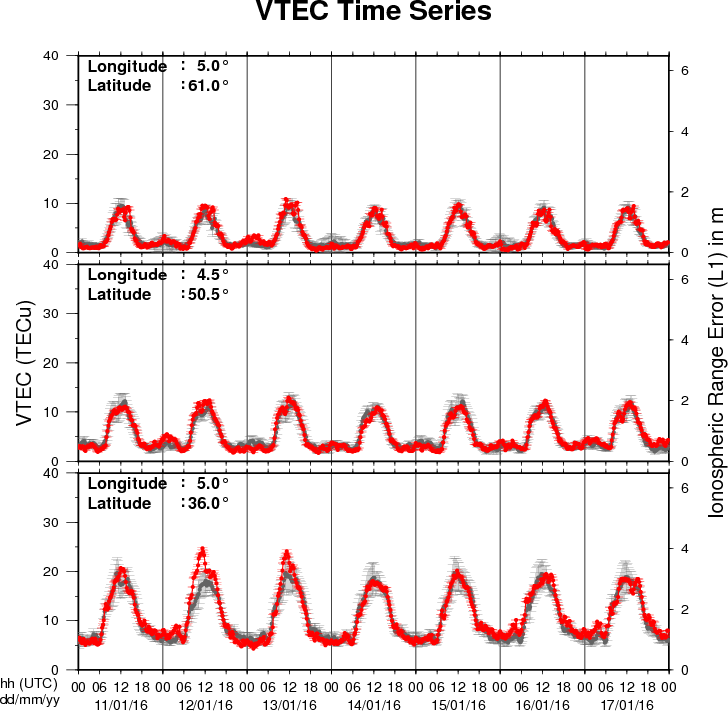
The figure shows the time evolution of the Vertical Total Electron Content (VTEC) (in red) during the last week at three locations:
a) in the northern part of Europe(N61°, 5°E)
b) above Brussels(N50.5°, 4.5°E)
c) in the southern part of Europe(N36°, 5°E)
This figure also shows (in grey) the normal ionospheric behaviour expected based on the median VTEC from the 15 previous days.
The VTEC is expressed in TECu (with TECu=10^16 electrons per square meter) and is directly related to the signal propagation delay due to the ionosphere (in figure: delay on GPS L1 frequency).
The Sun's radiation ionizes the Earth's upper atmosphere, the ionosphere, located from about 60km to 1000km above the Earth's surface.The ionization process in the ionosphere produces ions and free electrons. These electrons perturb the propagation of the GNSS (Global Navigation Satellite System) signals by inducing a so-called ionospheric delay.
See http://stce.be/newsletter/GNSS_final.pdf for some more explanations ; for detailed information, see http://gnss.be/ionosphere_tutorial.php
Future Events
For more details, see http://www.spaceweather.eu/en/event/future
COSPAR/ILWS workshop: science for space weather in Goa, India
Start : 2016-01-24 - End : 2016-01-29
Understanding and being able to forecast space weather is an
increasingly important aspect of our modern technology-reliant
society. This workshop will treat all aspects of space weather,
ranging from solar origins of transient events (CMEs, Flares, CIRs)
to their propagation through the heliosphere and effects on Earth
and planetary bodies, from particle energization to forecasting
particle environment and its effects on technological and
biological systems, as well as solar-cycle effects and coupling of
space weather to atmospheric response. Metrics to assess
predictions will also be discussed. The workshop is structured
along the lines of the COSPAR space weather pathways and will
include invited, contributed talks and posters, as well as panel
discussions and tutorials.
Website:
http://www.cessi.in/ssw/program.html
The Scientific Foundation of Space Weather
Start : 2016-06-27 - End : 2016-07-01
Website:
http://www.issibern.ch/program/workshops.html