- Table of Content
- 1.Phoenix
- 2.PROBA2 Observa...
- 3.Review of sola...
- 4.The Internatio...
- 5.Review of geom...
- 6.Geomagnetic Ob...
- 7.Review of iono...
- 8.Future Events
- 9.New documents ...
2. PROBA2 Observations (18 Jan 2016 - 24 Jan 2016)
3. Review of solar activity
4. The International Sunspot Number
5. Review of geomagnetic activity
6. Geomagnetic Observations at Dourbes (18 Jan 2016 - 24 Jan 2016)
7. Review of ionospheric activity (18 Jan 2016 - 24 Jan 2016)
8. Future Events
9. New documents in the European Space Weather Portal Repository
Phoenix
The phoenix is a large mythological bird with red and gold plumage, which has the most startling ability to regenerate itself. Indeed, when its body becomes old, it disintegrates in a fiery flash, soon to rise from its ashes as a newborn chick. Recently, it was most impressively featured in the Harry Potter movies as Professor Dumbledore's pet.
On 10 January, a small sunspot group appeared near the northeast limb at about 10 degrees in latitude and about 30 degrees to the west of two mature sunspot groups NOAA 2483 and NOAA 2480. This tiny region was numbered NOAA 2484 and, as small sunspot groups often do, it quickly faded out of view. The SDO/HMI images (http://sdo.gsfc.nasa.gov/data/ ) underneath show a full disk view of the Sun (left) and a zoom (right) late on 10 January resp. at 21:22UT and 20:39UT, and again on 15 January around 20:00UT. NOAA 2484 consists really only of those two puny dots 45 to 60 degrees to the west of the central meridian (top images), whereas it is spotless on the bottom images.
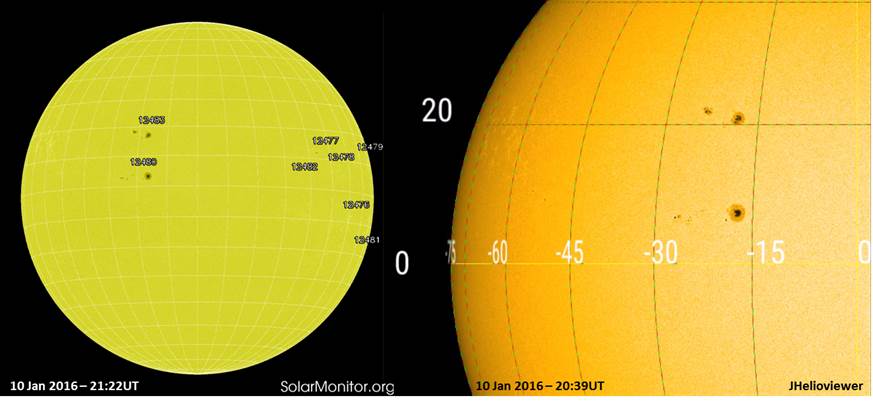
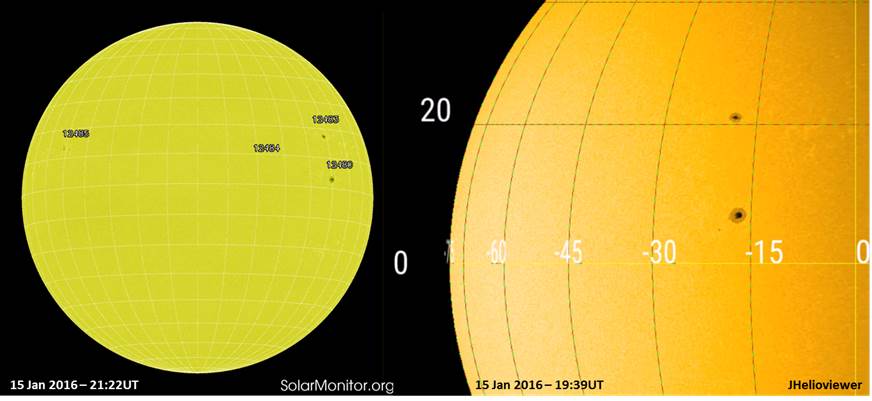
The images on the right are not only close-ups of the area around NOAA 2484, they actually are "fixed" over the location of the active region. This can be done with the remarkable "Track" feature of the JHelioviewer software (http://www.jhelioviewer.org/) . Simply put the feature of interest in the middle of the field of view, and the software then recalculates the position of the entire solar surface of the other images to fit in the original frame. It's a bit comparable to geostationary satellites that hover over a fixed point on Earth by moving with the Earth's rotation. In JHelioviewer, one can create the same impression by recalculating the position from the other images. One can see this tracking feature in action in the images above where the sunspot groups NOAA 2480 and NOAA 2483 stay at their fixed location in the right images, even though 5 days have elapsed and the "normal" images show how they have moved over the solar disk (left images).
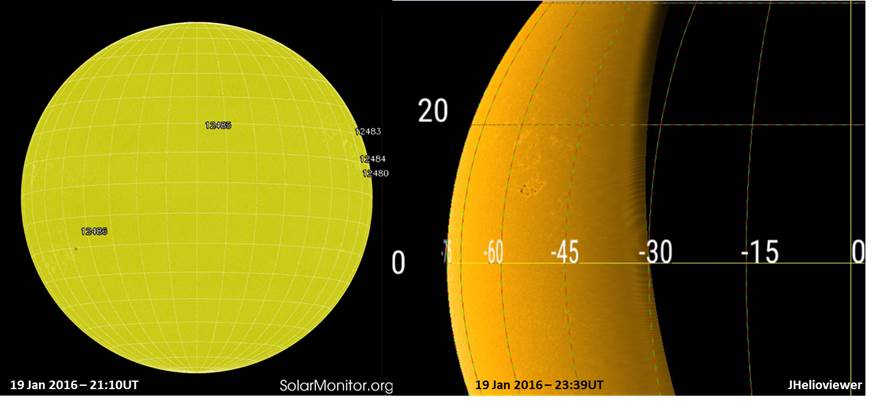
This feature is obviously of great help in our story. Indeed, after the area was spotless for nearly 9 days, it started to show some small sunspots on 19 January that grew into a compact and dynamic sunspot region the next day. Was this emerging magnetic flux a regeneration of the old, disintegrated ashes from active region NOAA 2484, or was it a genuine new sunspot group at another location? JHelioviewer leaves no doubt as far as the location of the new group concerns: It emerged right at the same location as the puny sunspots that appeared on 10 January. This can be seen in the image above right, with the spots at 10 degrees latitude and 45 to 60 degrees to the west of the "10 January" central meridian. The strange, inward curve on the right is nothing else but the projected solar west limb. NOAA 2480 and 2483 have already rounded that limb, and obviously do not show anymore in this image. An annotated movie can be found at https://youtu.be/JR5UgVxyt3c NOAA 2484 would go on to produce a C1 flare on 20 January and another one on 21 January. As Professor Dumbledore might have said: "Fascinating features, those sunspot groups!"
PROBA2 Observations (18 Jan 2016 - 24 Jan 2016)
Solar Activity
Solar flare activity fluctuated between very low and low during the week.
In order to view the activity of this week in more detail, we suggest to go to the following website from which all the daily (normal and difference) movies can be accessed:
http://proba2.oma.be/ssa
This page also lists the recorded flaring events.
A weekly overview movie can be found here (SWAP week 304).
http://proba2.oma.be/swap/data/mpg/movies/weekly_movies/weekly_movie_2016_01_18.mp4
Details about some of this week’s events, can be found further below.
Sunday Jan 24
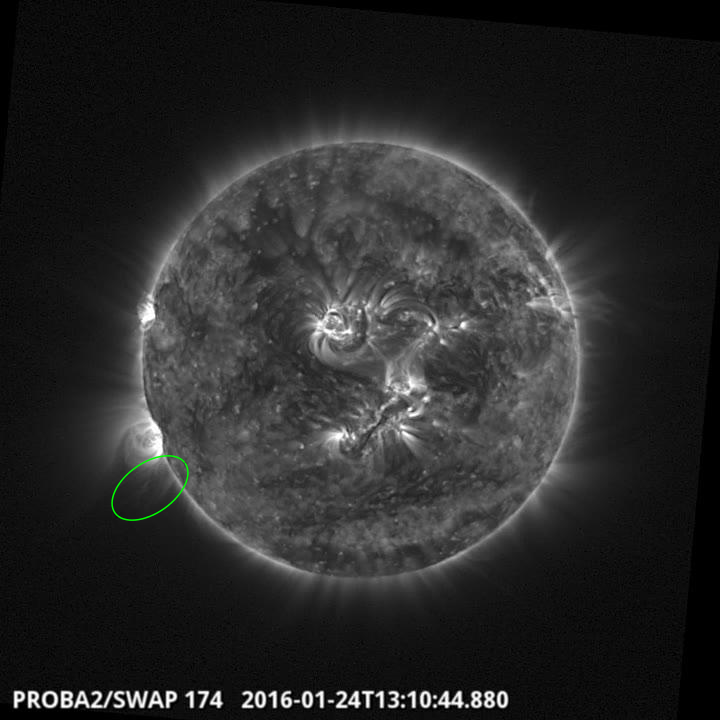
SWAP observed an eruption on 2014Jan24 at 13:10 UT off of the East solar limb
Find a movie of the event here (SWAP movie)
http://proba2.oma.be/swap/data/mpg/movies/20160124_swap_movie.mp4
Review of solar activity
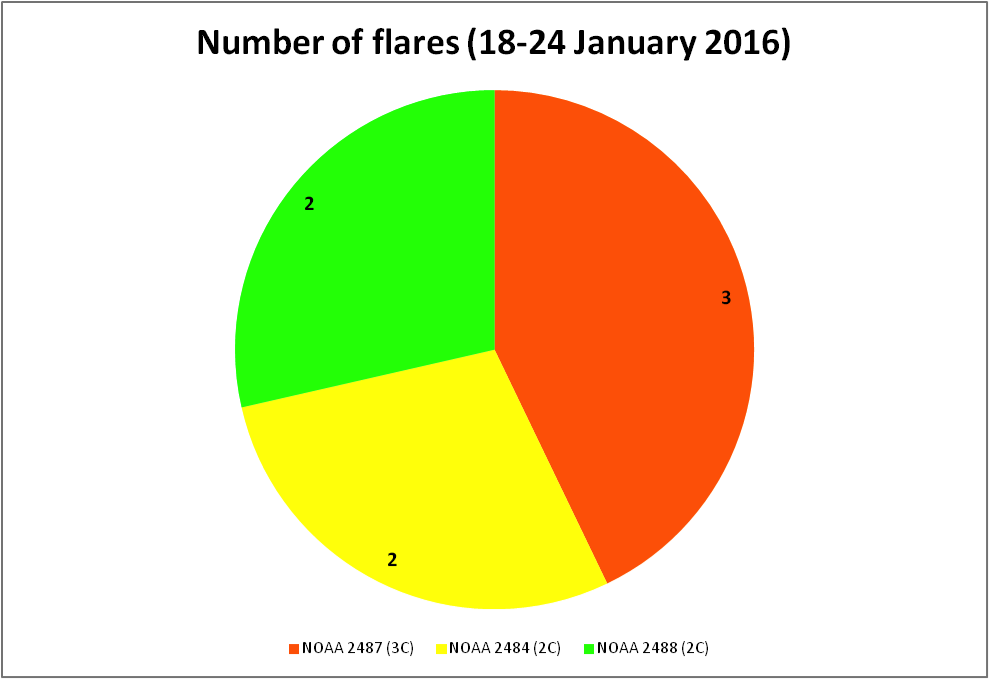
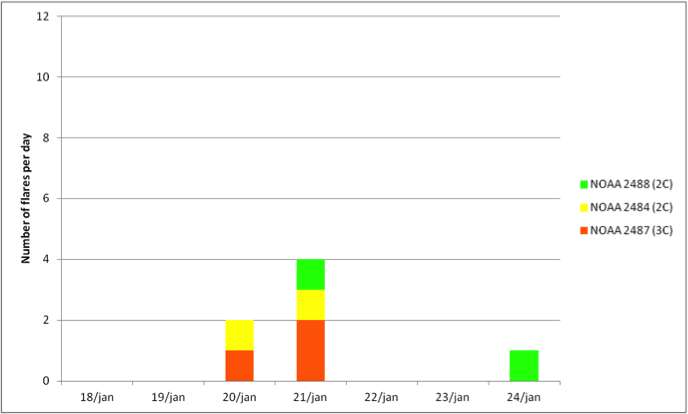
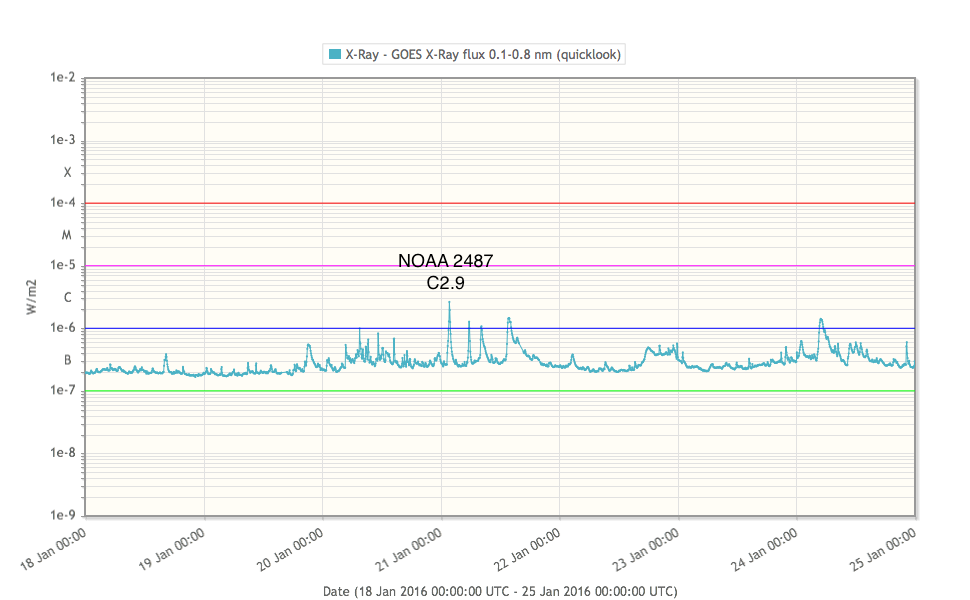
Solar activity was low to very low during the entire week. The sunspot groups were few and magnetically simple. Only 7 low-level C-class flares were produced, the strongest being a C2.9 flare by NOAA 2487 on 21 January.
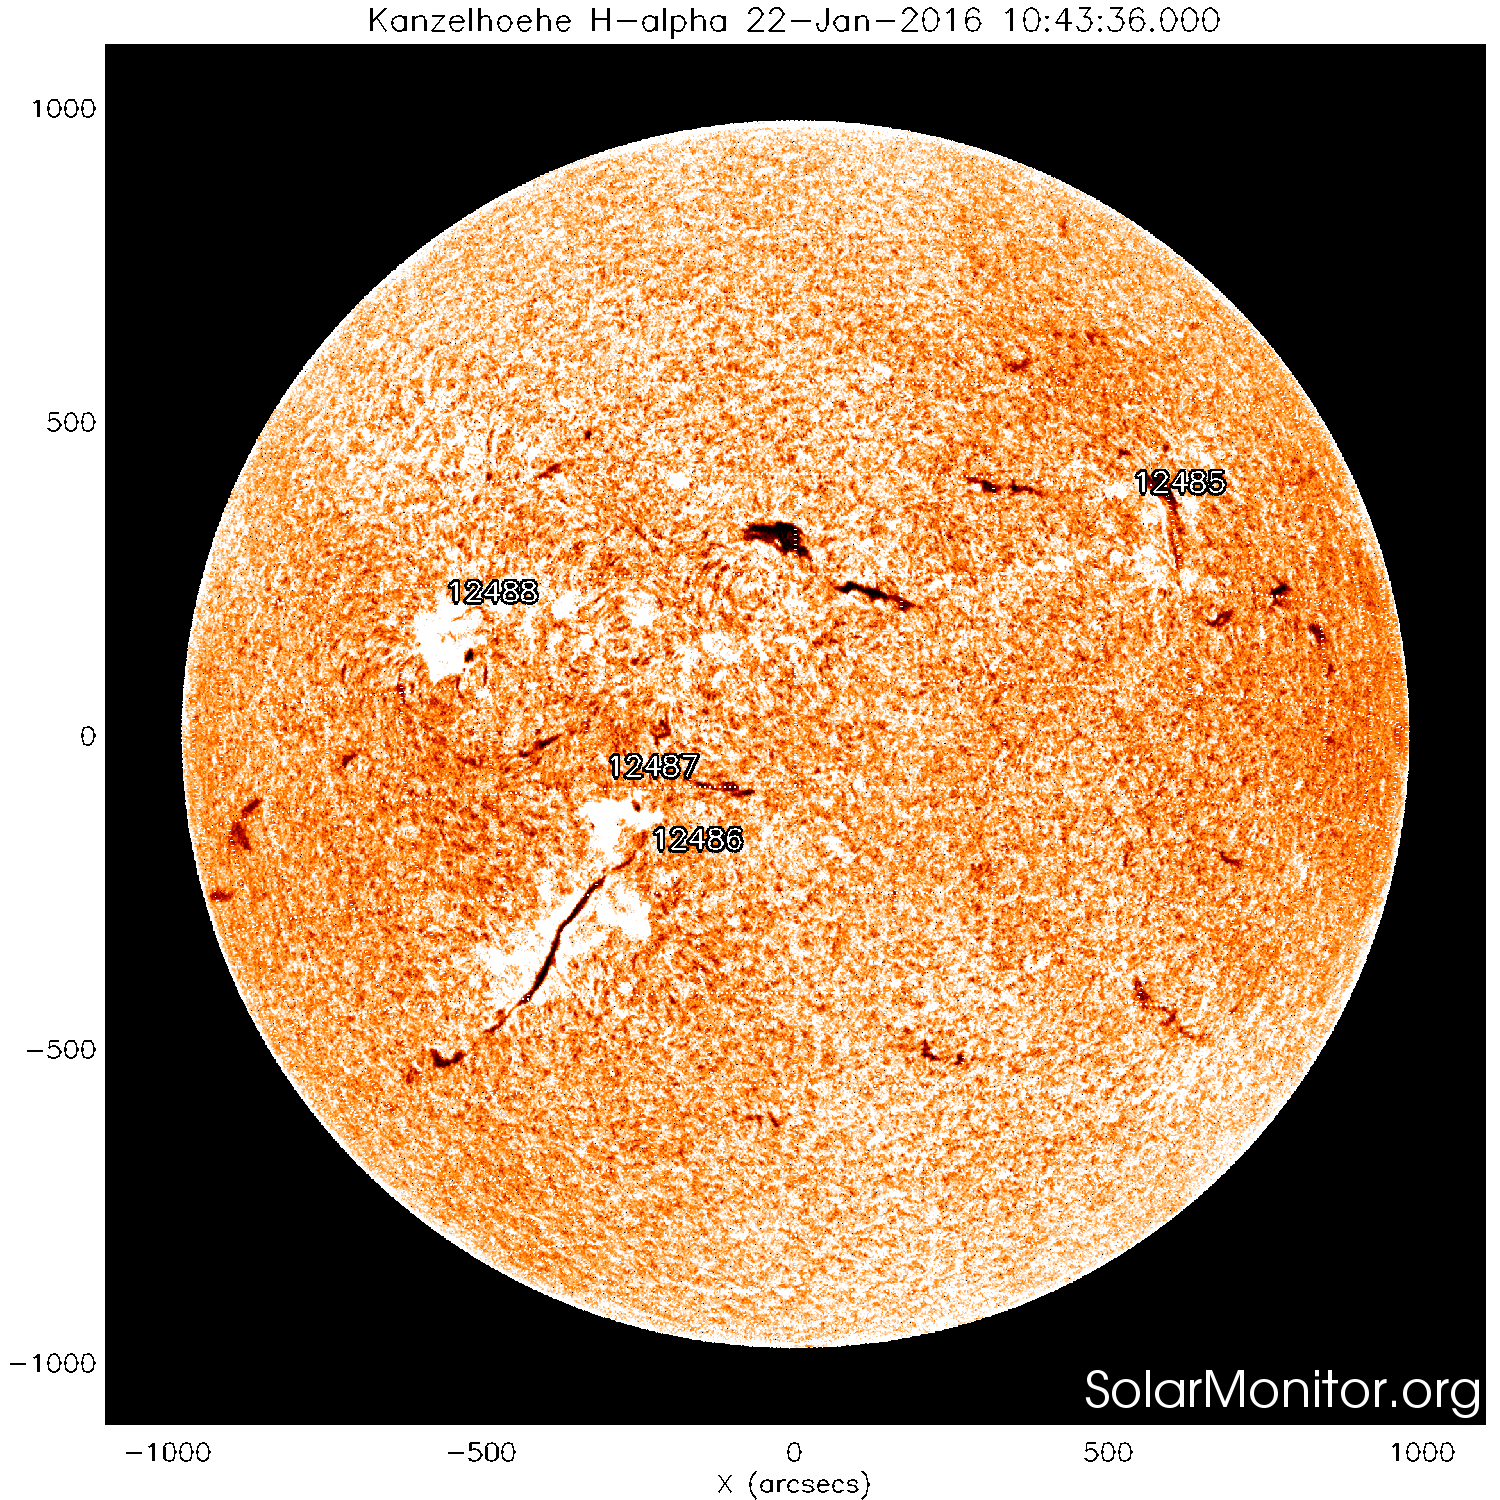
This region was close to the top end of a 40 degrees long solar filament that remained stable throughout the week and entered the southwest solar quadrant. The H-alpha image below is taken from Kanzelhoehe, Austria. The NOAA active region numbers are indicated. A quick preview on the next review of solar activity: the filament erupted on January 26.
No particularly strong or earth-directed coronal mass ejections (CMEs) were observed. A number of the CMEs were associated with flares originating from old active region NOAA 2481 on the solar backside. This region rounded the solar east limb at the end of the period and became visible as a small sunspot group.
The International Sunspot Number
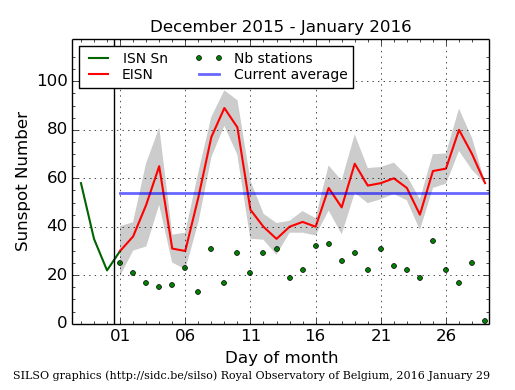
The daily Estimated International Sunspot Number (EISN, red curve with shaded error) derived by a simplified method from real-time data from the worldwide SILSO network. It extends the official Sunspot Number from the full processing of the preceding month (green line). The plot shows the last 30 days (~ one solar rotation). The horizontal blue line shows the current monthly average, while the green dots give the number of stations included in the calculation of the EISN for each day.
Review of geomagnetic activity
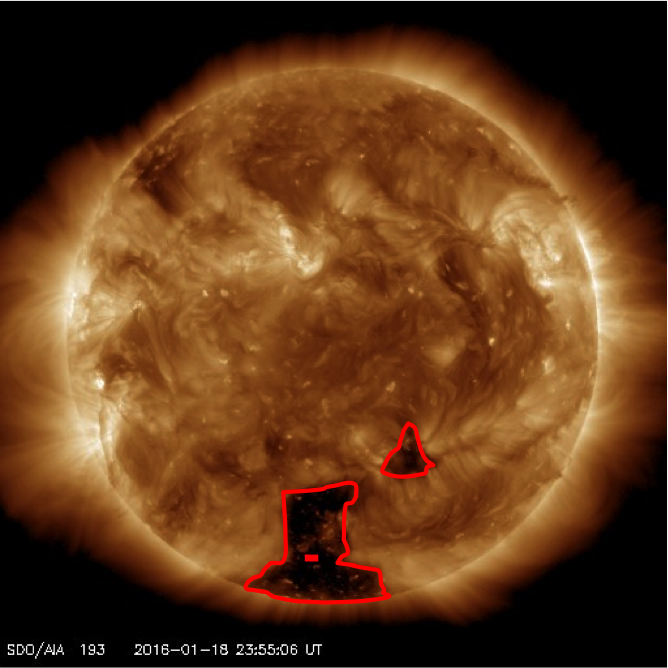
The geomagnetic environment was influenced by the arrival of a halo coronal mass ejection (CME) that had left the Sun late on 14 January, and by the high speed stream (HSS) of a negative southern polar coronal hole (CH) - see SDO/AIA image just below.
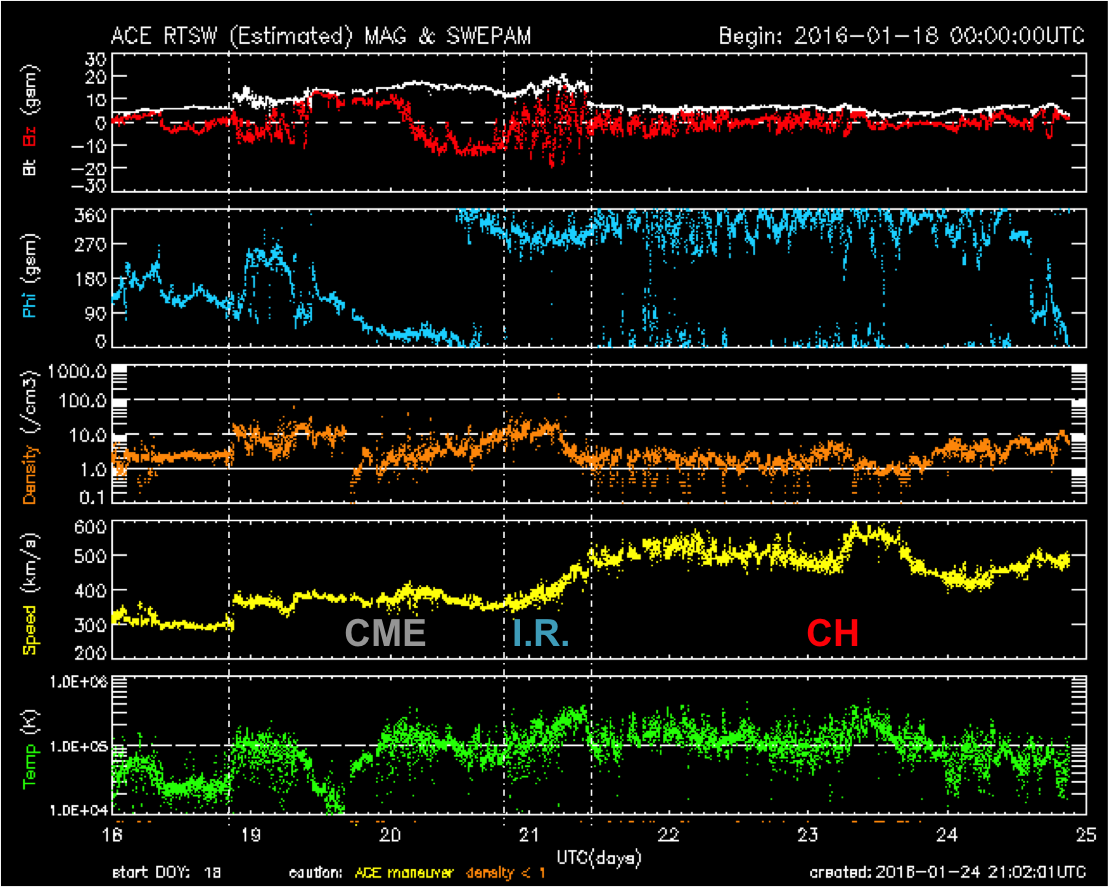
On 18 January at 20:56UT, ACE observed a shock in the solar wind (see graph above). Solar wind speed jumped from about 300 to 370 km/s, with a maximum near 410 km/s early on 20 January. Bz initially varied between mostly -9 and +10 nT as the sheath region of the CME passed by. On 19 January around 10:30UT, Bz turned to steady positive values between +13 and +9 nT until about 03:00UT, when it smoothly changed into steady negative values (-14 nT) that lasted until about 18:00UT. This period was accompanied by a change in the phi angle, with the direction of the interplanetary magnetic field (IMF) changing from away to towards the Sun. These variations in magnetic parameters are typical for the smooth magnetic rotation as the magnetic cloud passed by.
The trailing part of the CME was then followed by an interaction region (IR) with the high speed stream of the extension of a southern polar coronal hole. This IR was characterized by wildly fluctuating Bz between -20 and + 16 nT that lasted until 21 January around 10:00UT, when the earth environment entered the proper HSS of the southern CH. Wind speed gradually rose from values near 350 km/s to a maximum of 600 km/s on 23 January. Bz varied between -7 and +6 nT for the remainder of the period, and the IMF was mostly directed towards the Sun. Solar wind speed was declining and around 470 km/s by the end of the period.
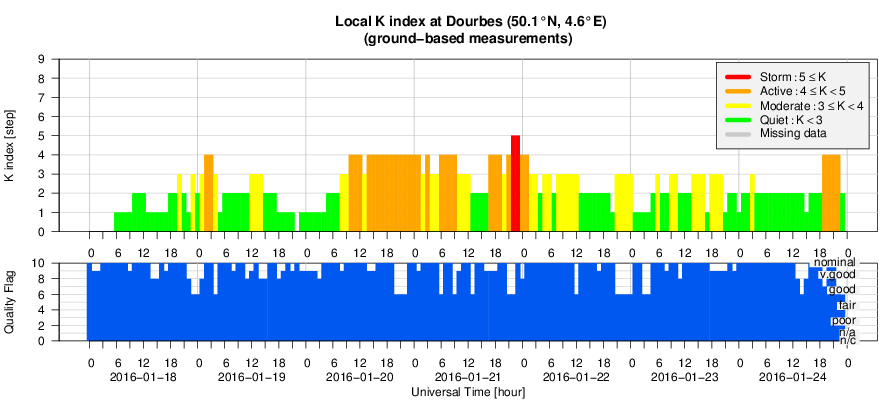
Mostly unsettled to active geomagnetic conditions were recorded in response to the aforementioned solar wind disturbances. On planetary level, minor storming (Kp=5) was observed during the passing of the CME (steady negative Bz phase) on 20 January. Major storming (Kp=6) was observed early on 21 January during the wild fluctuations of Bz. Locally, minor storming (K=5) was only observed late on 21 January when Earth was already fully immersed in the CH's HSS. Dst dipped just below -100 nT on 20 January around 17:00-18:00UT, coinciding with the steady negative Bz of the passing CME.
Geomagnetic Observations at Dourbes (18 Jan 2016 - 24 Jan 2016)
Review of ionospheric activity (18 Jan 2016 - 24 Jan 2016)

The figure shows the time evolution of the Vertical Total Electron Content (VTEC) (in red) during the last week at three locations:
a) in the northern part of Europe(N61°, 5°E)
b) above Brussels(N50.5°, 4.5°E)
c) in the southern part of Europe(N36°, 5°E)
This figure also shows (in grey) the normal ionospheric behaviour expected based on the median VTEC from the 15 previous days.
The VTEC is expressed in TECu (with TECu=10^16 electrons per square meter) and is directly related to the signal propagation delay due to the ionosphere (in figure: delay on GPS L1 frequency).
The Sun's radiation ionizes the Earth's upper atmosphere, the ionosphere, located from about 60km to 1000km above the Earth's surface.The ionization process in the ionosphere produces ions and free electrons. These electrons perturb the propagation of the GNSS (Global Navigation Satellite System) signals by inducing a so-called ionospheric delay.
See http://stce.be/newsletter/GNSS_final.pdf for some more explanations ; for detailed information, see http://gnss.be/ionosphere_tutorial.php
Future Events
For more details, see http://www.spaceweather.eu/en/event/future
The Scientific Foundation of Space Weather
Start : 2016-06-27 - End : 2016-07-01
Website:
http://www.issibern.ch/program/workshops.html
New documents in the European Space Weather Portal Repository
See http://www.spaceweather.eu/en/repository
eHEROES - Final Report
The final report of the FP7 project eHEROES, Environment for Human Exploration and RObotic Experimentation in Space.
http://www.spaceweather.eu/en/repository/show?id=598