- Table of Content
- 1.STCE 10 years,...
- 2.Learn about GI...
- 3.PROBA2 Observa...
- 4.Review of sola...
- 5.The Internatio...
- 6.Review of geom...
- 7.Geomagnetic Ob...
- 8.Review of iono...
2. Learn about GIC and their effects on power-grids and pipelines
3. PROBA2 Observations (14 Mar 2016 - 20 Mar 2016)
4. Review of solar activity
5. The International Sunspot Number
6. Review of geomagnetic activity
7. Geomagnetic Observations at Dourbes (14 Mar 2016 - 20 Mar 2016)
8. Review of ionospheric activity (14 Mar 2016 - 20 Mar 2016)
STCE 10 years, Happy Birthday!
On 22 March 2006, exactly 10 years ago, the Minister of Science Policy announced in a press release the foundation of the Solar-Terrestrial Centre of Excellence. The STCE would lift the Sun-Space-Earth research to a higher level by uniting experts in the field.
And the STCE would become an effective service centre for the government, citizens and industries vulnerable for the impact of the physical processes triggered by solar activity. Ten years later, the STCE has indeed a leading role in this very specific knowledge-based economy, space technology and services. The STCE continues therefore to invest in people and national and international collaborations.
We owe you a cake! At the annual STCE meeting on June 9, 2016
Learn about GIC and their effects on power-grids and pipelines
Space Weather for Engineers organises a course on the impact of geometrically induced currents have on power-grids and pipelines from October 18-20, 2016 in Leuven, Belgium. Registration is open.
This course is aimed to make people, and engineers in particular, aware of the solar or spatial origin of the disturbances and disruptions that are witnessed in many ground based and spatial technological systems, and to explain the physical mechanisms behind them, to indicate where to find the relevant predictive data and to train how to interpret them in order to lower the risk of damage to technical equipment and economic losses. As a matter of fact, Space Weather predictions are readily available nowadays and the Space Weather community has been working hard to make them widely accessible through disseminating forecast bulletins, alerts, etc.
Against this background, the School is targeted at training engineering personnel so that they are capable of taking protective measures when Space Weather alerts are issued, to the benefit of their companies.
http://www.stce.be/sw4e/index.php

PROBA2 Observations (14 Mar 2016 - 20 Mar 2016)
Solar Activity
Solar flare activity fluctuated between very low and low during the week.
In order to view the activity of this week in more detail, we suggest to go to the following website from which all the daily (normal and difference) movies can be accessed: http://proba2.oma.be/ssa
This page also lists the recorded flaring events.
A weekly overview movie can be found here: http://proba2.sidc.be/swap/data/mpg/movies/weekly_movies/weekly_movie_2016_03_14.mp4 (SWAP week 312).
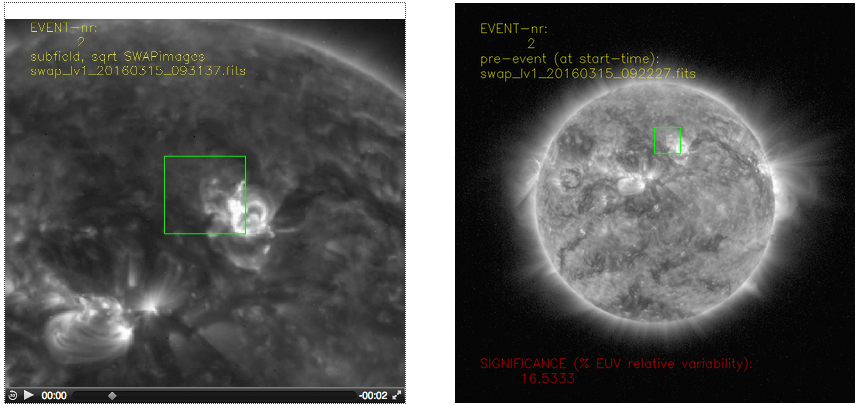
We did not observe any M or X-class flares this week, only a few C-class flares. Below we provide SWAP images showing an example flare, a C1.2 flare produced by NOAA Active Region (AR) 2521 on 2016-Mar-15, peaking at 09:34 UT. On 2016-Mar-14, a filament eruption was also observed.
The annotated snapshots of the flare are produced by the Solar Feature Automated Search Tool (SoFAST). This tool detects dynamic solar events in EUV images from SWAP in near real-time. The snapshots illustrate the location of the flare on the solar disk (right) and a zoomed image (left).
The complete SoFAST online event list and additional plots are available at: http://www.sidc.be/sofast.
2016-Mar-15, AR 2521:
C1.2 peaking around 09:34 UT
A movie of the event can be found here: http://proba2.sidc.be/swap/data/mpg/movies/20160315_swap_movie.mp4 (SWAP daily movie)
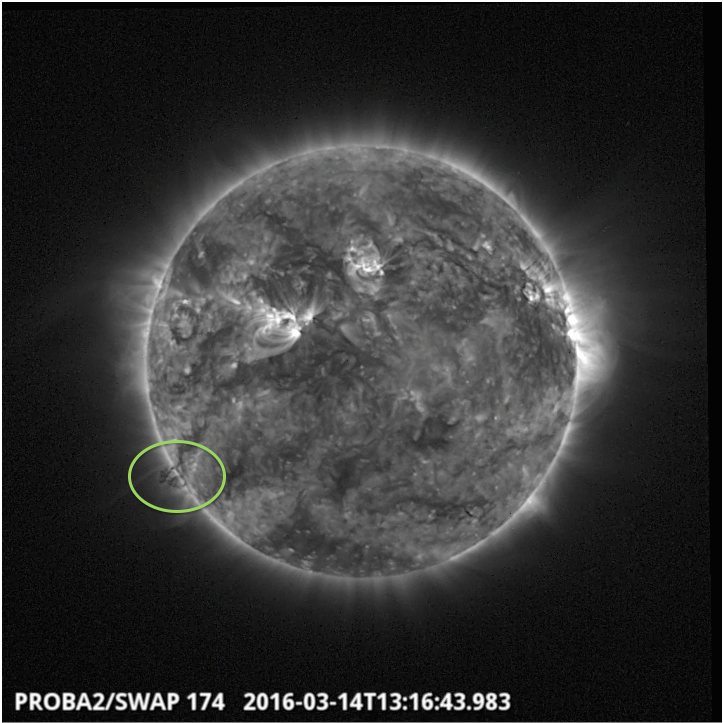
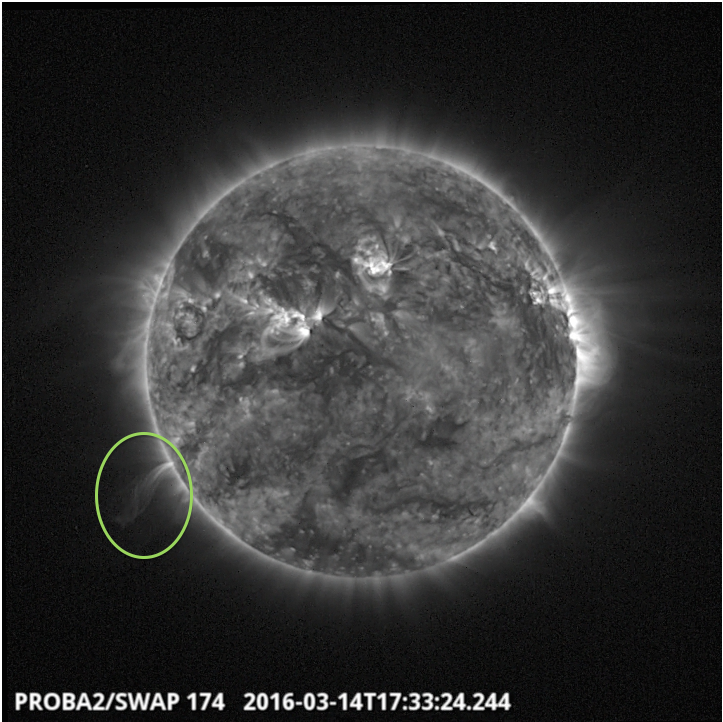
2016-Mar-14:
Filament eruption in the South-East quadrant, around 15:30 UT.
Below we provide annotated SWAP images before and after the event.
A movie of the event can be found here: http://proba2.sidc.be/swap/data/mpg/movies/20160314_swap_movie.mp4 (SWAP daily movie)
Review of solar activity
Solar flaring activity was very low, with only five C-class flares (C3.7 as maximum) on the Earth-facing side of the Sun. NOAA 2521 and 2522 (see SDO HMI images below) were responsible for the flaring activity.
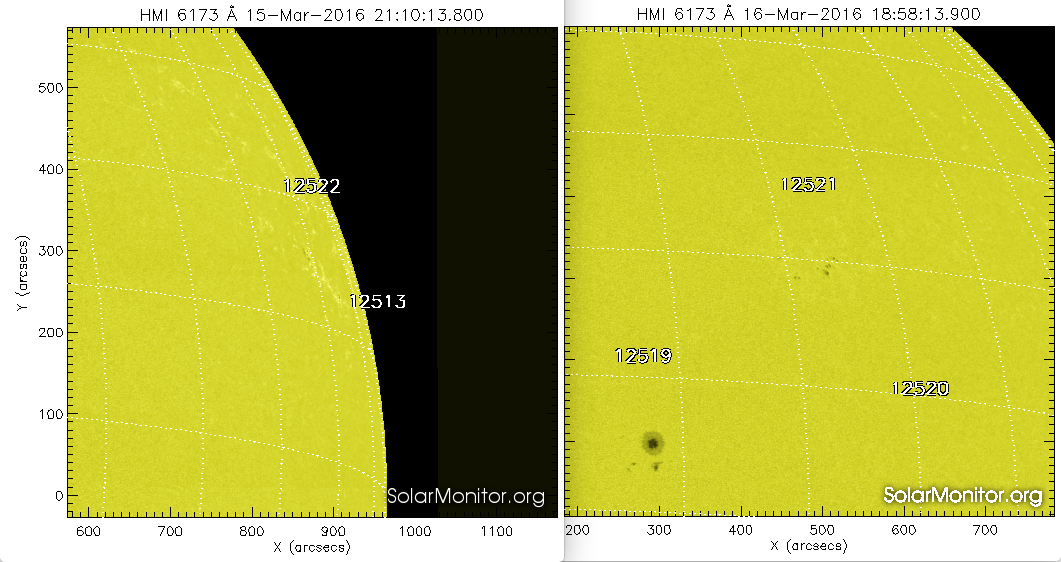
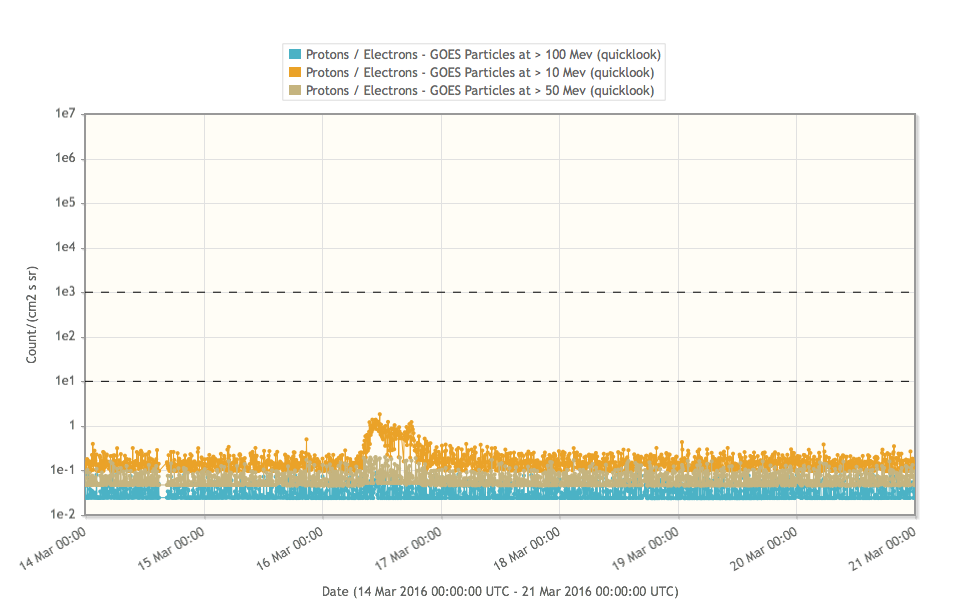
Several regions only lasted for a few days. The C-class flare on March 16, originating from NOAA 2522, was associated with a narrow CME (viewed from Earth) without any Earth-directed component. At that time, NOAA 2522 was located at the West limb and the activity resulted in a slight proton enhancement at >10MeV, without passing the event threshold (see GOES particle flux graph below).
A few small filament eruptions were observed on disk, but without any related coronagraphic signatures.
The International Sunspot Number
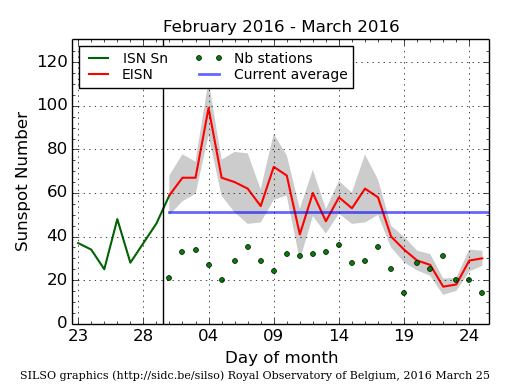
The daily Estimated International Sunspot Number (EISN, red curve with shaded error) derived by a simplified method from real-time data from the worldwide SILSO network. It extends the official Sunspot Number from the full processing of the preceding month (green line). The plot shows the last 30 days (about one solar rotation). The horizontal blue line shows the current monthly average, while the green dots give the number of stations included in the calculation of the EISN for each day.
Review of geomagnetic activity
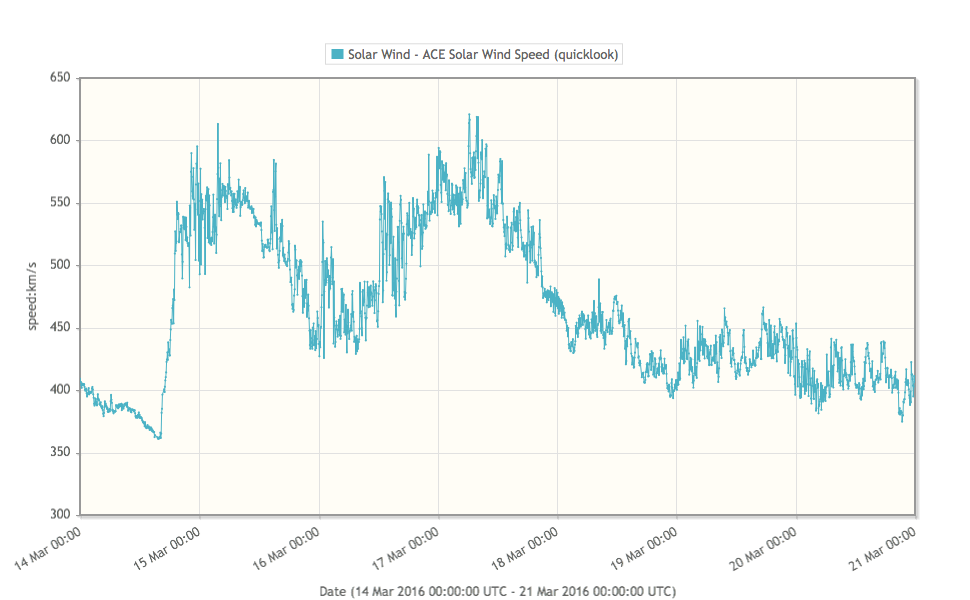
The solar wind was disturbed by a high speed stream emanating from a negative polarity coronal hole (located in the southern hemisphere).
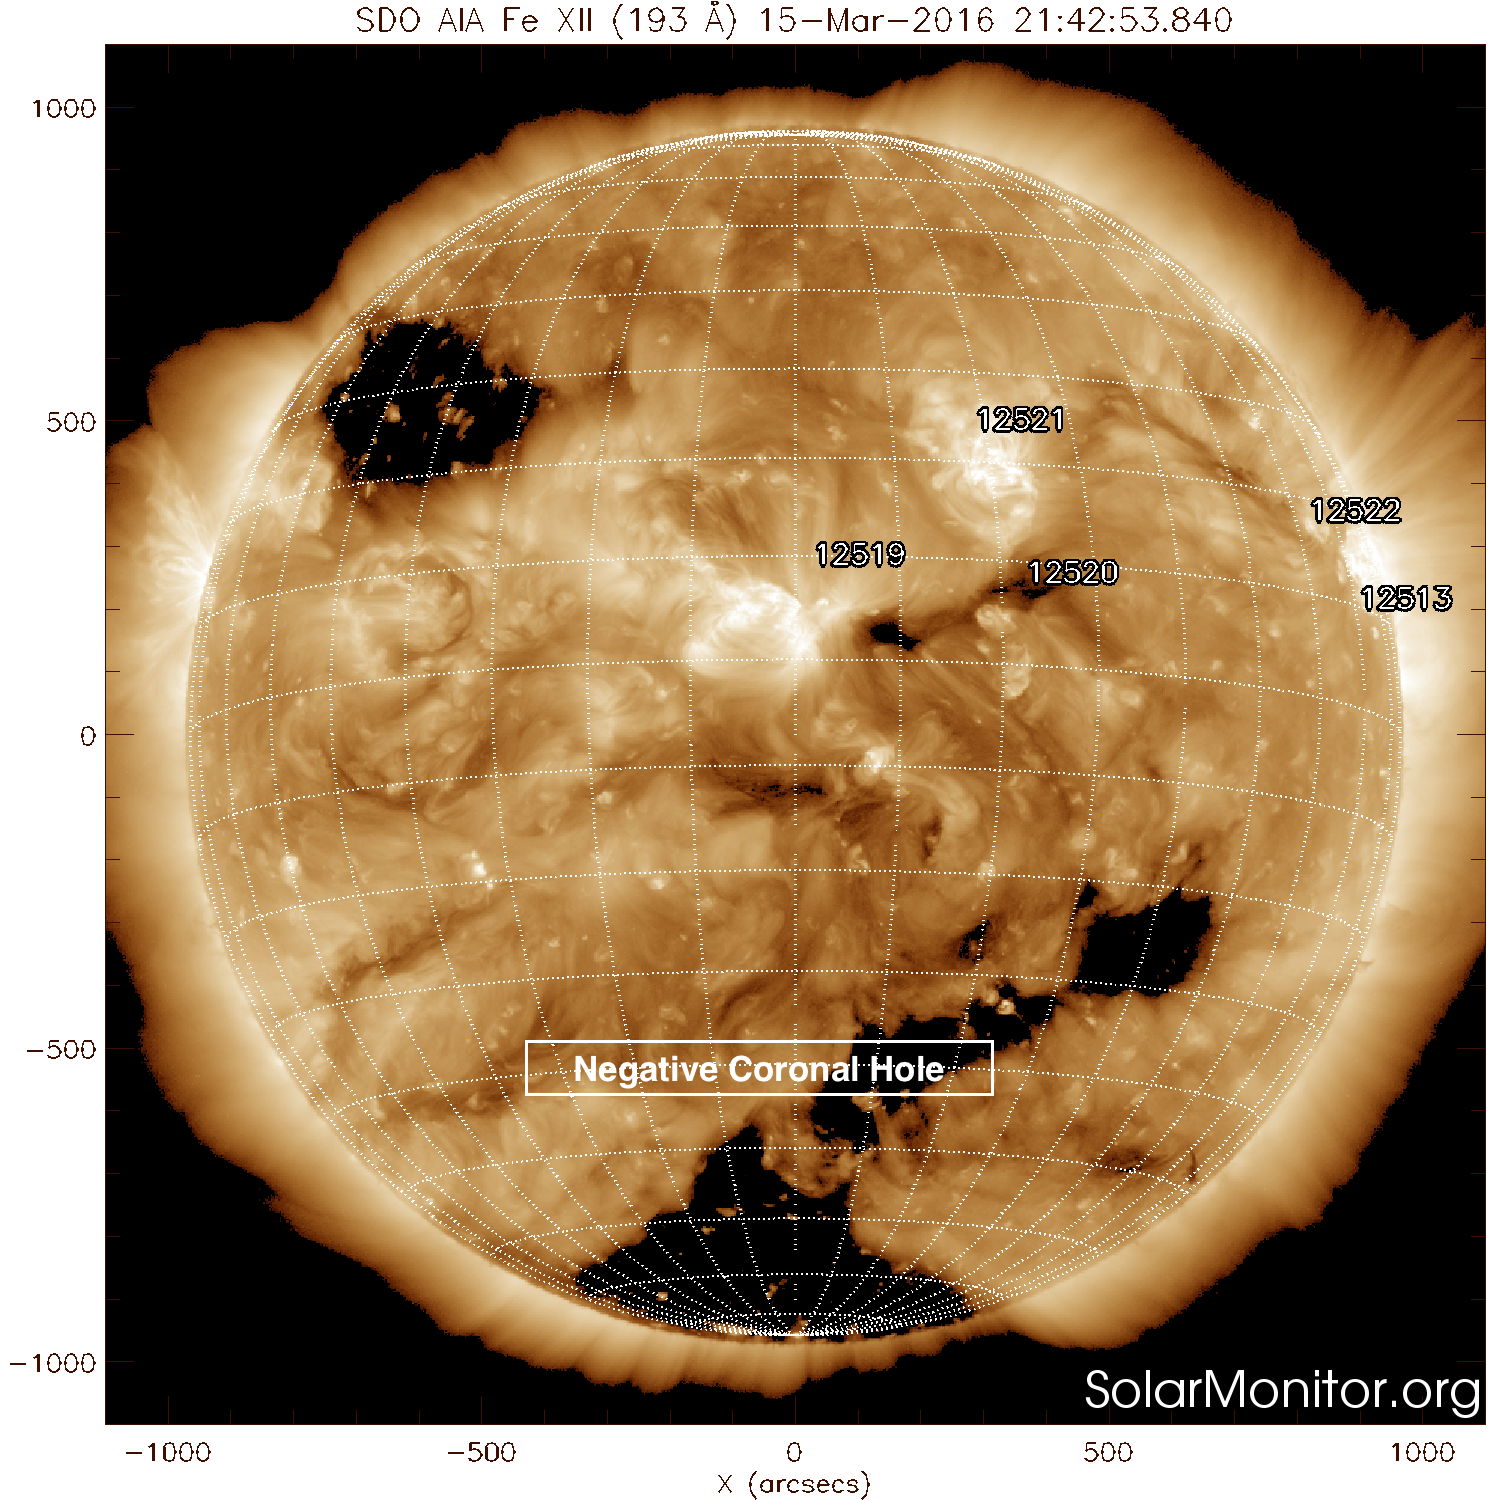
The disturbance started near 16h UT on March 14 and lasted at least three days. The solar wind speed profile showed two bumps, with a maximum value over 600 km/s and speed slowly declined from March 17 on.
The field magnitude peaked late March 14. From March 15, the magnetic field magnitude remained near or lower than 10 nT, but with a negative north-south component (Bz) for several periods.
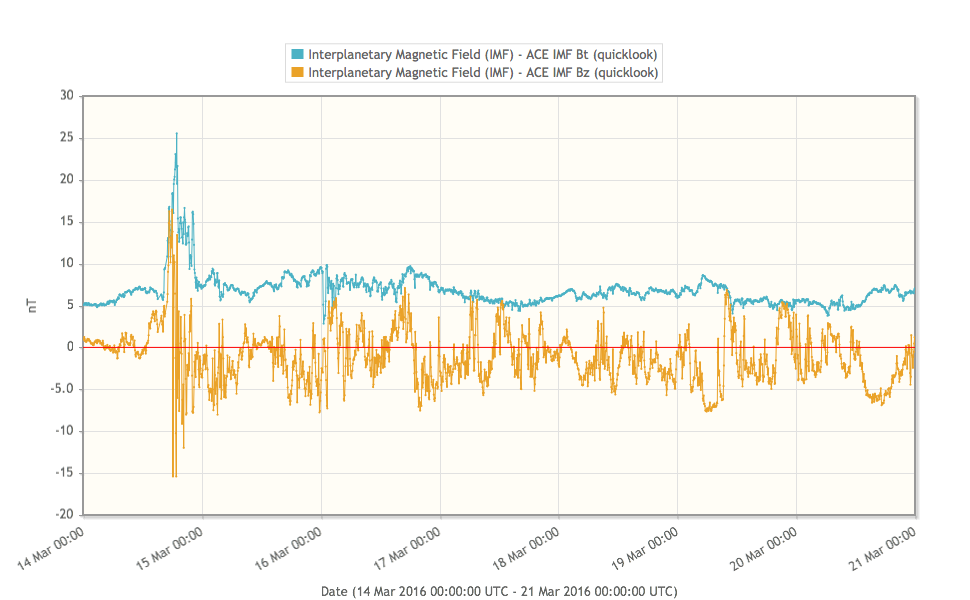
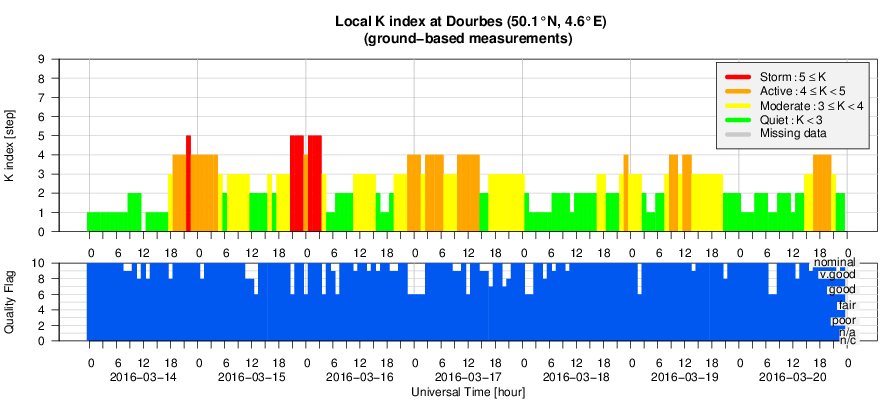
These negative Bz values resulted in active to minor storm conditions for several time slots (e.g. around UT midnight on March 14-15, 15-16 and 16-17 and a few time slots on March 19 and 20).
Geomagnetic Observations at Dourbes (14 Mar 2016 - 20 Mar 2016)
Review of ionospheric activity (14 Mar 2016 - 20 Mar 2016)

The figure shows the time evolution of the Vertical Total Electron Content (VTEC) (in red) during the last week at three locations:
a) in the northern part of Europe(N61°, 5°E)
b) above Brussels(N50.5°, 4.5°E)
c) in the southern part of Europe(N36°, 5°E)
This figure also shows (in grey) the normal ionospheric behaviour expected based on the median VTEC from the 15 previous days.
The VTEC is expressed in TECu (with TECu=10^16 electrons per square meter) and is directly related to the signal propagation delay due to the ionosphere (in figure: delay on GPS L1 frequency).
The Sun's radiation ionizes the Earth's upper atmosphere, the ionosphere, located from about 60km to 1000km above the Earth's surface.The ionization process in the ionosphere produces ions and free electrons. These electrons perturb the propagation of the GNSS (Global Navigation Satellite System) signals by inducing a so-called ionospheric delay.
See http://stce.be/newsletter/GNSS_final.pdf for some more explanations ; for detailed information, see http://gnss.be/ionosphere_tutorial.php