- Table of Content
- 1.A dynamic suns...
- 2.ESWW13 - Call ...
- 3.PROBA2 Observa...
- 4.Review of sola...
- 5.The Internatio...
- 6.Review of geom...
- 7.Geomagnetic Ob...
- 8.Review of iono...
2. ESWW13 - Call for Working Meetings
3. PROBA2 Observations (21 Mar 2016 - 27 Mar 2016)
4. Review of solar activity
5. The International Sunspot Number
6. Review of geomagnetic activity
7. Geomagnetic Observations at Dourbes (21 Mar 2016 - 27 Mar 2016)
8. Review of ionospheric activity (21 Mar 2016 - 27 Mar 2016)
A dynamic sunspot
Continuing the ongoing trend of low solar activity, last week was once again very quiet with flaring levels barely reaching the C-class level. Only NOAA 2524 was able to produce a C1 flare on 23 March (long duration event), and a C2 flare early on Monday 28 March. By then, this active region had decayed into a small single sunspot and was rounding the west limb. Despite its simple outlook, this region showed quite some activity in extreme ultraviolet (EUV) wavelengths.
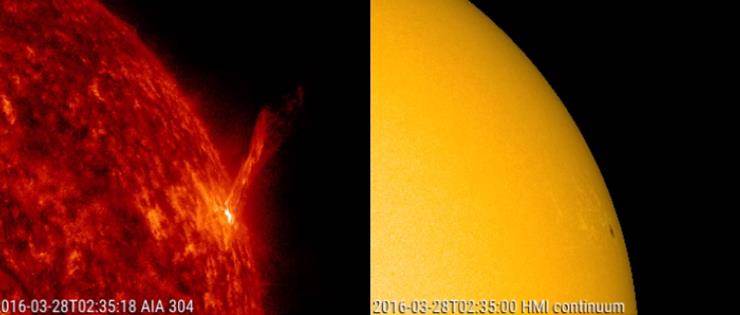
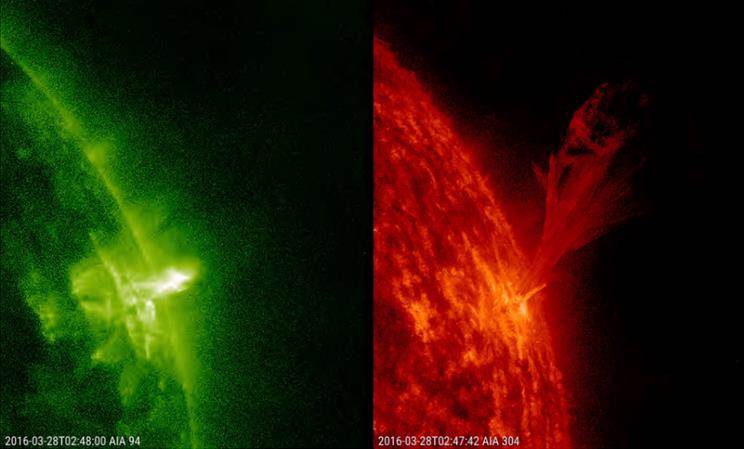
On 27 and 28 March, numerous jets (see the STCE news item of 5 February 2015 at http://www.stce.be/news/293/welcome.html ) can be seen emanating from an area to the north and northwest of the sunspot. Some but not all of these jets were related to B-class flares (e.g. the one around 19:50UT), with only one related to a C-class flare (around 02:30UT on 28 March). The latter event was also the only one associated with a coronal mass ejection.
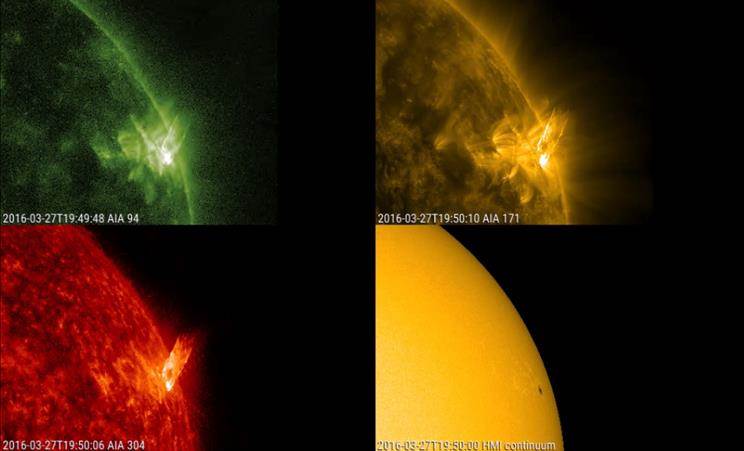
Using SDO imagery (http://sdo.gsfc.nasa.gov/data/aiahmi/), the movie at https://youtu.be/P84YoYZg-ZQ first shows a four-frame clip covering the period from 27 March (12:00UT) till 29 March (00:00UT) at a cadence of 1 image per 5 minutes. It shows a view at several million degrees (top left) and at about 700.000 degrees (top right), at about 80.000 degrees (bottom left) and in white light (bottom right). The next clips compare the EUV imagery side by side, but for a more restricted time period (from 18:00UT till 06:00UT) and at a higher cadence (1 image every 2 minutes). Clearly, some of the activity looks entirely different depending the filter used.
ESWW13 - Call for Working Meetings
13th European Space Weather Week, November 2016, Belgium

The ESWW is the main annual event in the European Space Weather calendar. The agenda will be composed of plenary/parallel sessions, working meetings and dedicated events for service end-users. The ESWW will again adopt the central aim of bringing together the diverse groups in Europe working on different aspects of Space Weather.
Key parts of the European Space Weather Weeks are the working meetings. These meetings provide the opportunity to address key issues in a style that complements the sessions. A working meeting aims at active interaction between the participants. The participants work and discuss on a predefined theme or problem heading towards an outcome or target. Working Meetings are open to all ESWW13 participants.
A working meeting is a 1.5-hour informal afternoon meeting with NO poster contributions. The conveners provide a title and abstract, those are put online. The title will appear in a handy printed program booklet. Since a working meeting is a forum for discussion, conveners don’t need to fix a speaker list or program. We encourage the conveners to write minutes or a summary which we will make available through the website.
Submission is open: http://www.stce.be/esww13/program/workingmeetings.php
Deadline for submissions is June 30, 2016 included.
ESWW13 will be held in Belgium, possible dates are November 14-18 and November 28 – December 2. We hope to announce the exact venue and dates very soon.
Sincerely
Mauro Messerotti (Chair PC), Petra Vanlommel (Chair PC) Alexi Glover (Vice Chair PC), Ronald Van der Linden (Chair LOC)
PROBA2 Observations (21 Mar 2016 - 27 Mar 2016)
Solar Activity
Solar flare activity fluctuated between very low and low during the week.
In order to view the activity of this week in more detail, we suggest to go to the following website from which all the daily (normal and difference) movies can be accessed:
http://proba2.oma.be/ssa
This page also lists the recorded flaring events.
A weekly overview movie can be found here (SWAP week 313).
http://proba2.oma.be/swap/data/mpg/movies/weekly_movies/weekly_movie_2016_03_21.mp4
Details about some of this week’s events, can be found further below.
Monday Mar 21
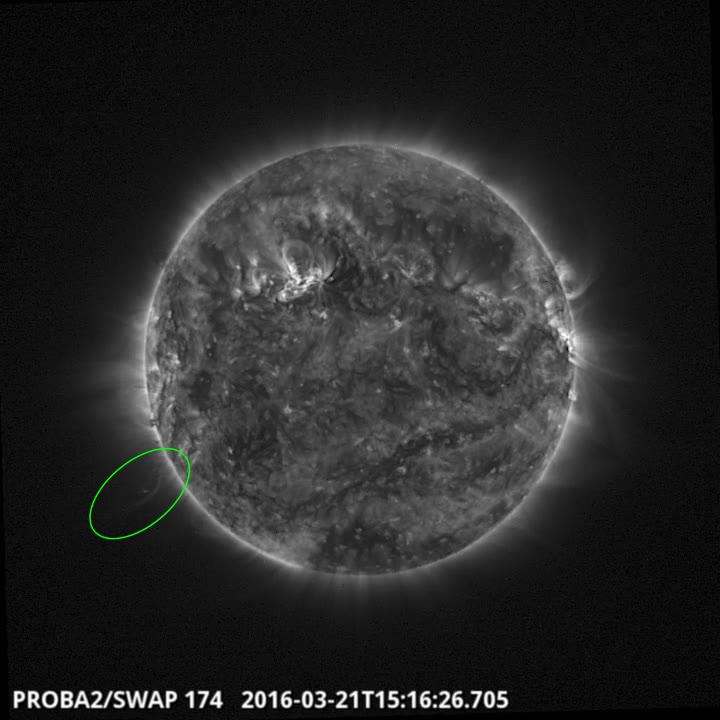
An eruption was observed by SWAP on the east limb at 15:16 UT on 2016 Mar 21
Find a movie of the event here (SWAP movie)
http://proba2.oma.be/swap/data/mpg/movies/20160321_swap_movie.mp4
Wednesday Mar 23
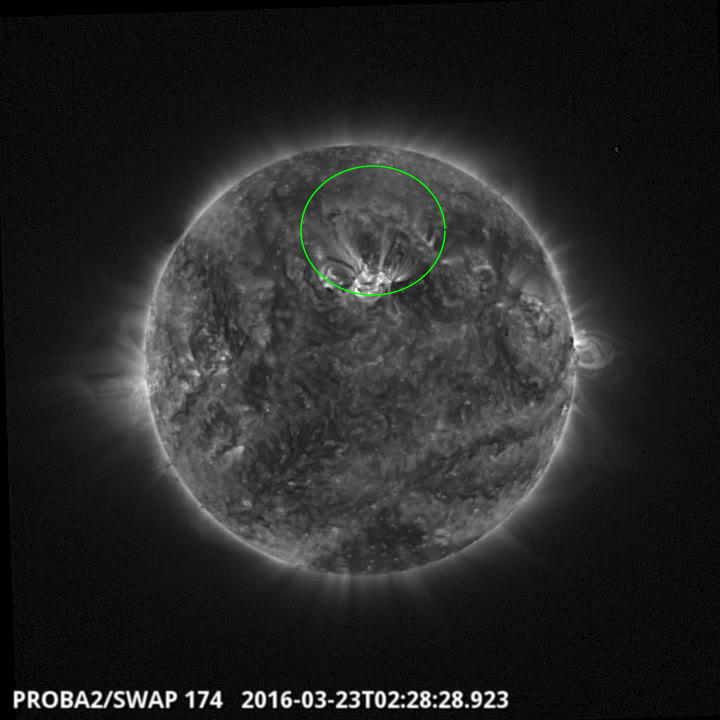
An eruption was observed by SWAP in the north at 02:28 UT on 2016 Mar 23
Find a movie of the event here (SWAP movie)
http://proba2.oma.be/swap/data/mpg/movies/20160323_swap_movie.mp4
Sunday Mar 27
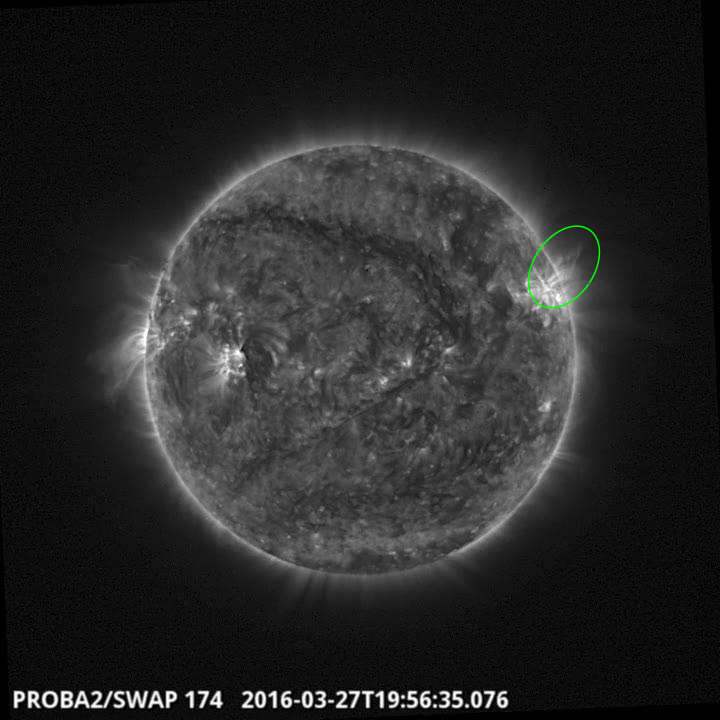
An eruption was observed by SWAP on the at the west limb at 19:56 UT on 2016Mar 27
Find a movie of the event here (SWAP movie)
http://proba2.oma.be/swap/data/mpg/movies/20160327_swap_movie.mp4
Review of solar activity
Over the past week solar activity varied between low and very low. No significant flares were recorded. The largest flare was a C1.1 class flare on Wednesday 23-Mar-2016 peaking at 03:54 UT from Active Region (ARs) 2524.
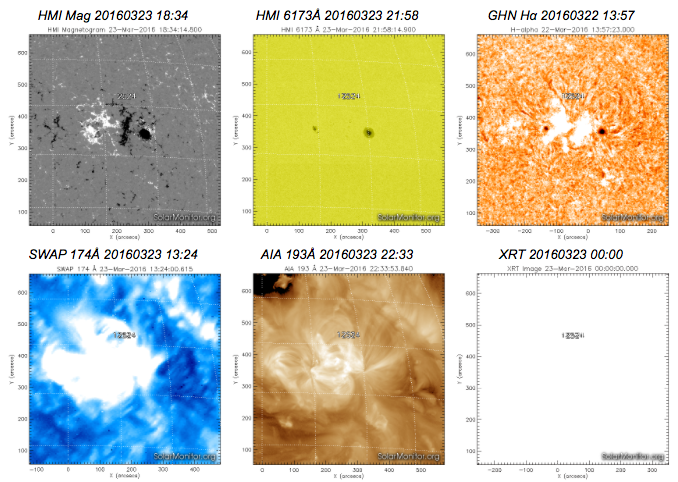
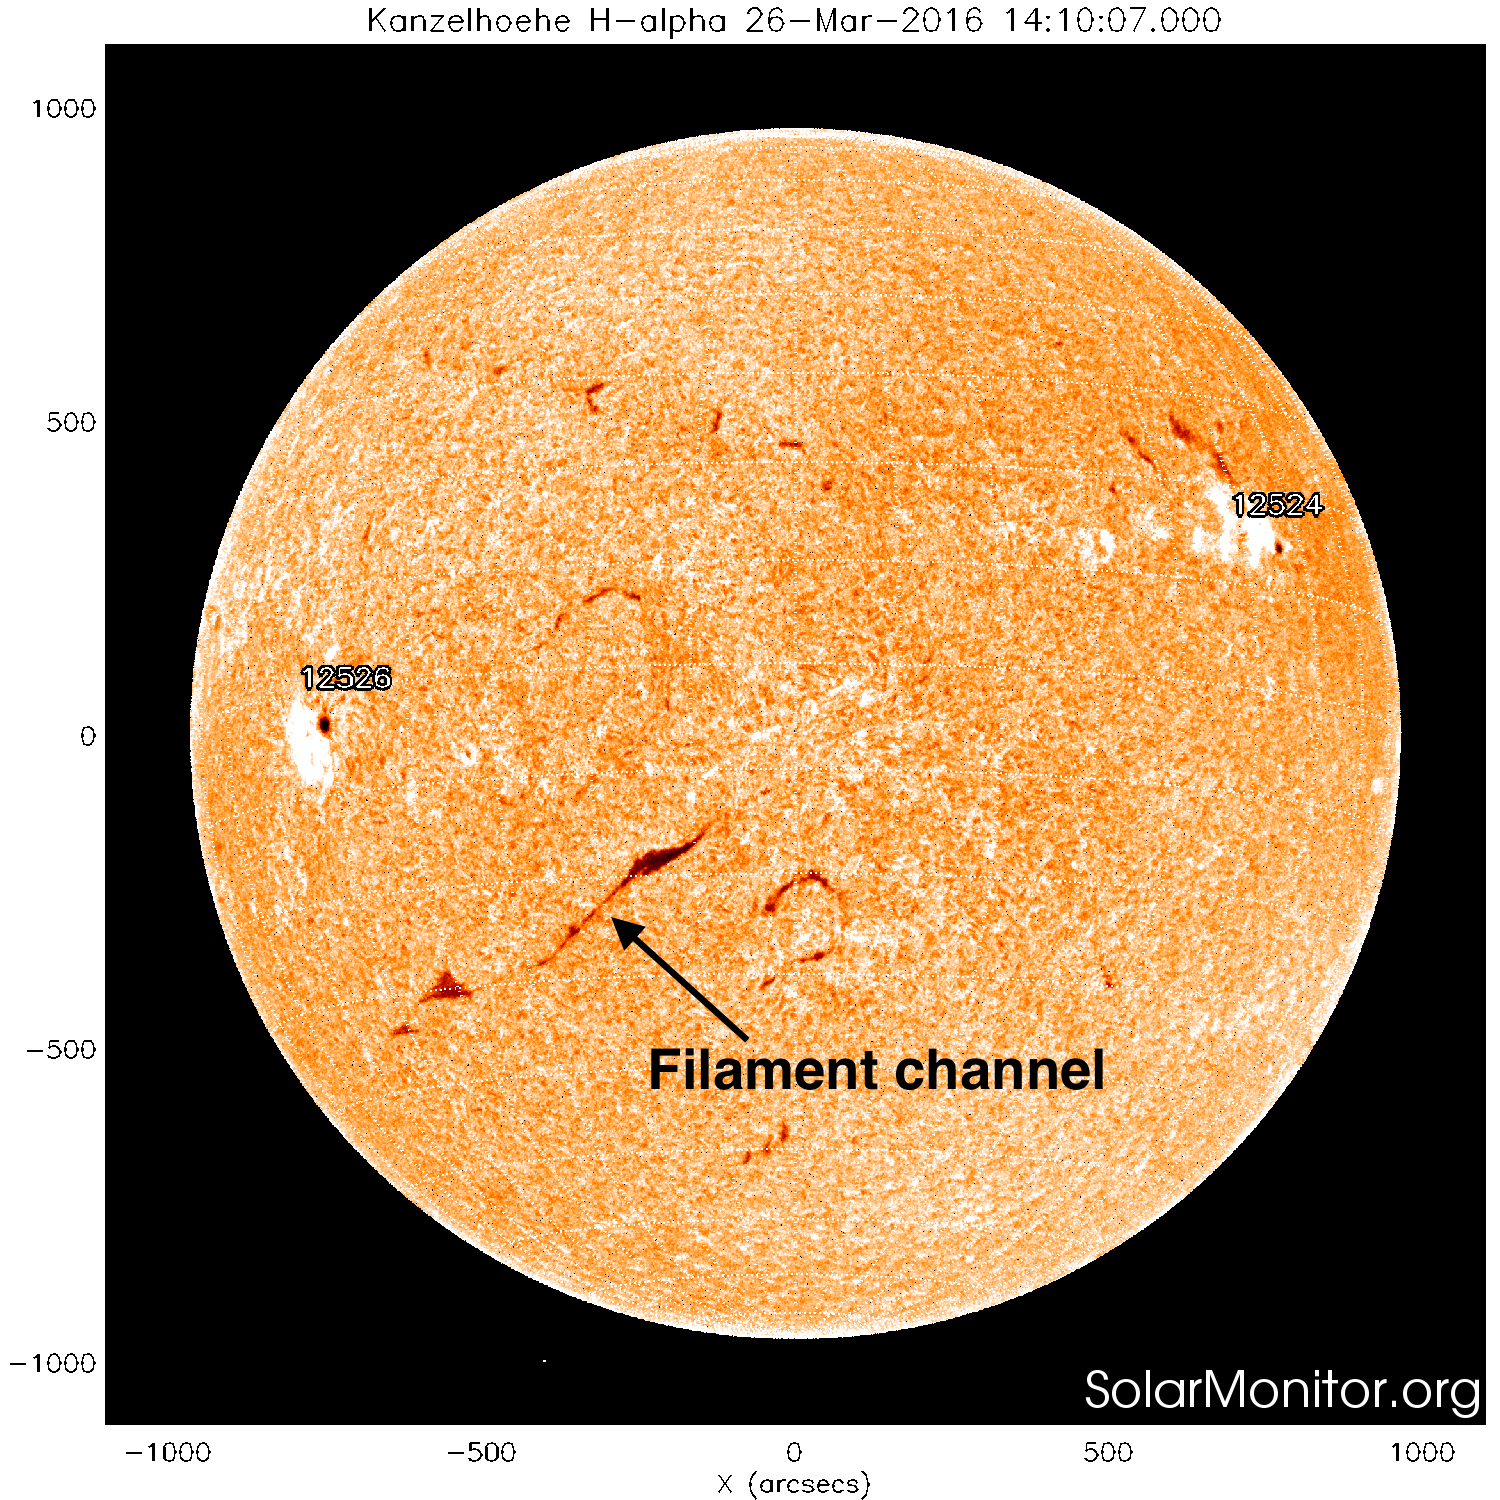
The mosaic above is taken from http://www.solarmonitor.org/
There were only two significant ARs on the solar disk last week AR 2524 and AR 2526. Both showed low levels of activity, producing B-class flares and the above mentioned C1.1 class flare.
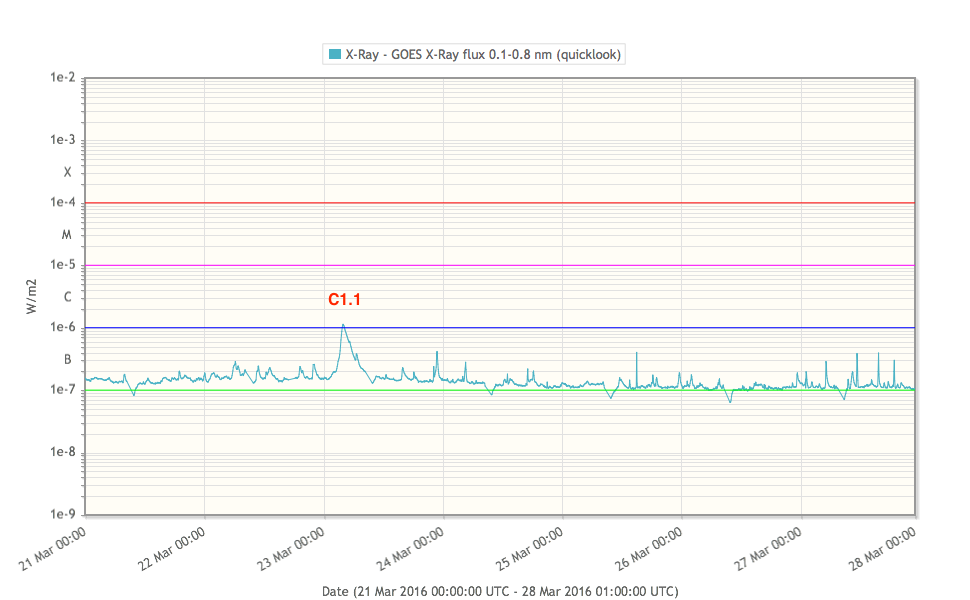
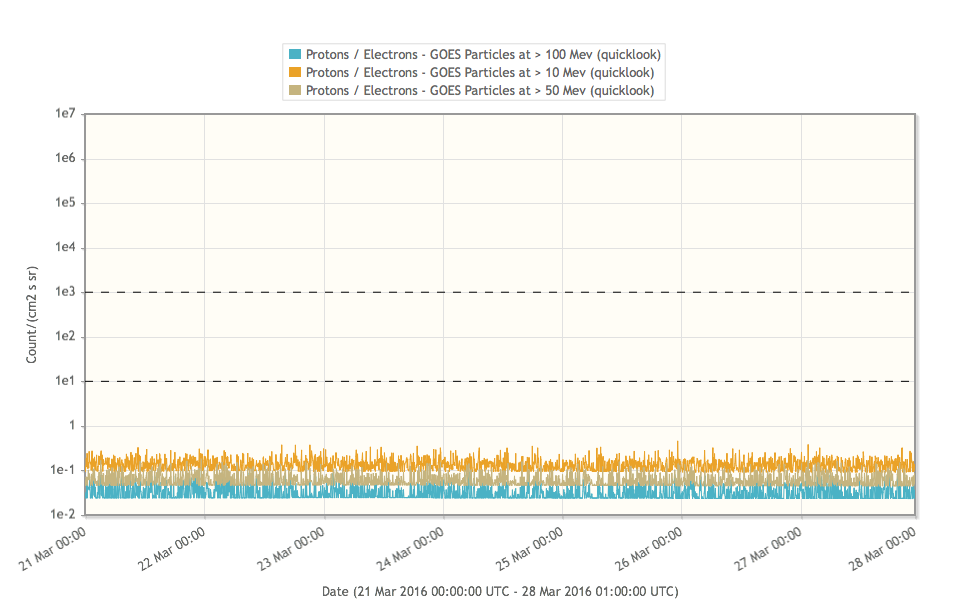
Solar proton levels have remained at background levels over the past week. Check the proton flux observations done by the satellite GOES below.
No Earth directed, or significant Coronal Mass Ejections (CMEs) were detected last week. A small brightening emerged in EUV imagery around S04E20 on Sunday 27-Mar-2016, and HMI observations suggest that a new AR is forming there. A large filament channel was seen extending from the Southeast to solar disk center at the end of the week, but remained stable.
The International Sunspot Number
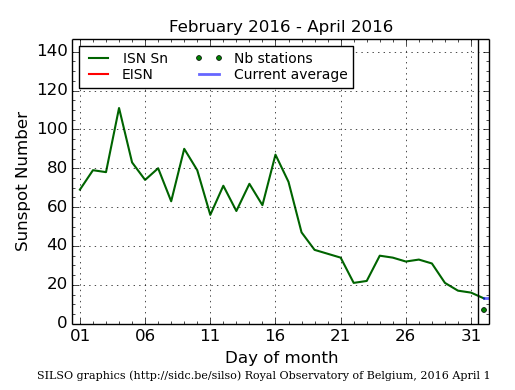
The daily Estimated International Sunspot Number (EISN, red curve with shaded error) derived by a simplified method from real-time data from the worldwide SILSO network. It extends the official Sunspot Number from the full processing of the preceding month (green line). The plot shows the last 30 days (about one solar rotation). The horizontal blue line shows the current monthly average, while the green dots give the number of stations included in the calculation of the EISN for each day.
Review of geomagnetic activity
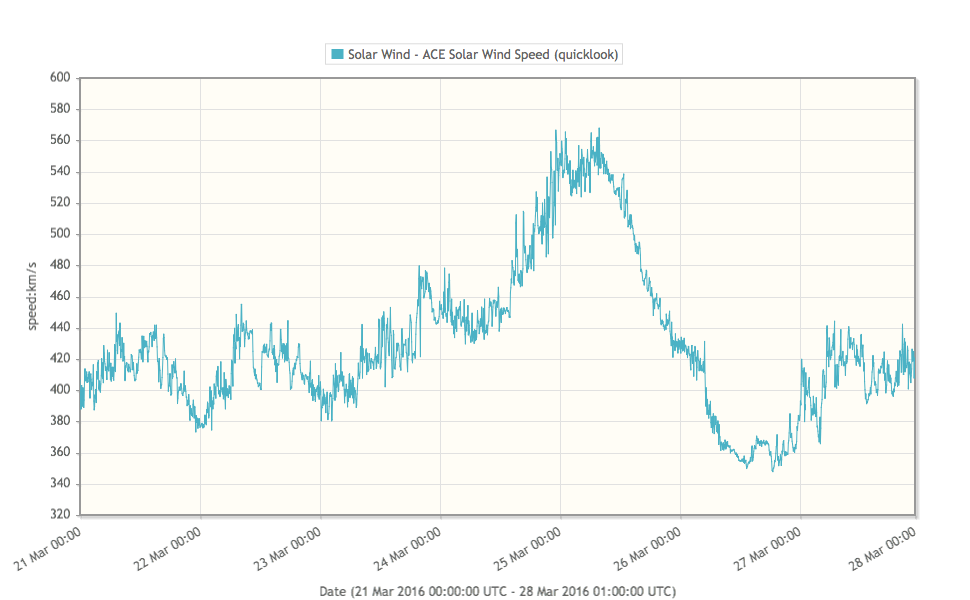
The solar wind speed has fluctuated between 350 and 550 km/s over the past week, peaking around 25-Mar-2016 00:00 UT, and rising again at the end of the week.
The total magnetic field strength has fluctuated between 2 and 13 nT peaking on Sunday 27-Mar-2016. The Bz component was predominantly positive throughout the week, and fluctuated between -5 and +9 nT.
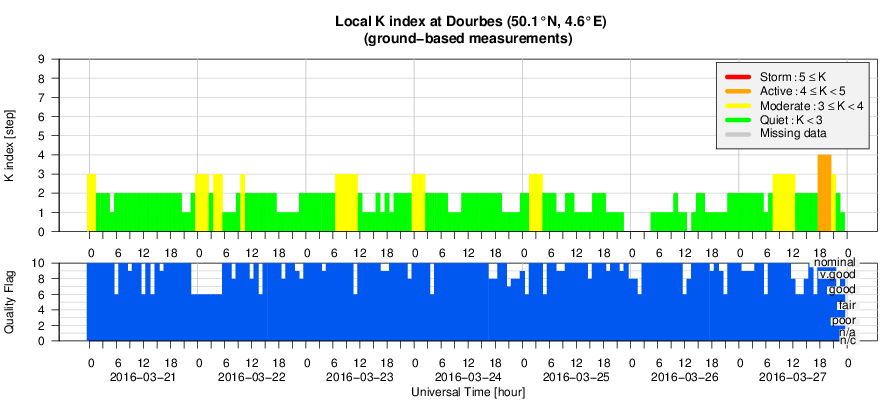
Geomagnetic conditions ranged between Kp index 0-4 (NOAA) and local K index 0-4 (Dourbes) over the past week, but largely remained around the 2 and 3 levels.
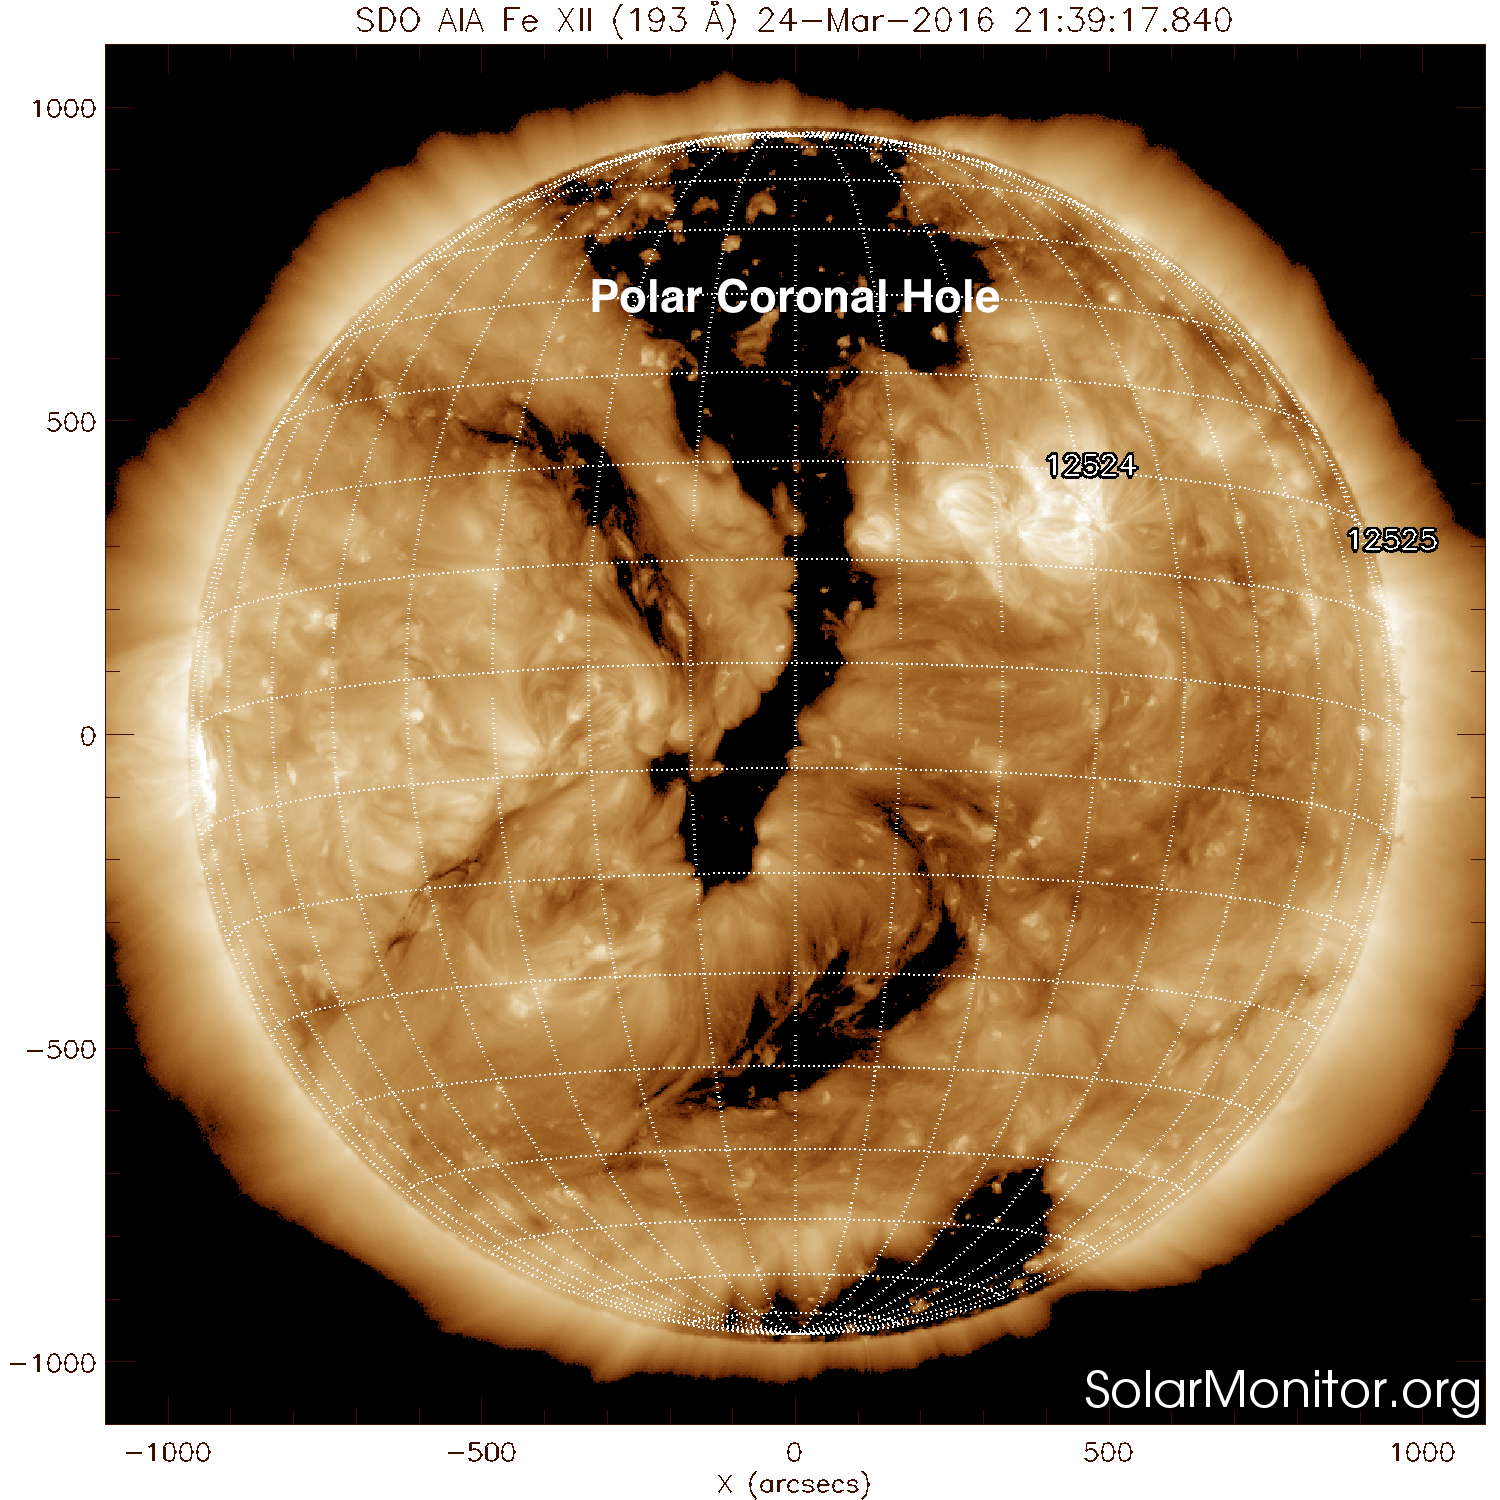
A large positive polarity Northern polar coronal hole began the week with a large extension to lower latitudes in the Eastern hemisphere, which slowly rotated across disk center and into the Western hemisphere throughout the week. The solar wind speed started to increase from Sunday 27-Mar-2016. The graph below shows already a preview of next weeks geomagnetic review.
CIR stands for Co-rotating Interaction Region
Geomagnetic Observations at Dourbes (21 Mar 2016 - 27 Mar 2016)
Review of ionospheric activity (21 Mar 2016 - 27 Mar 2016)
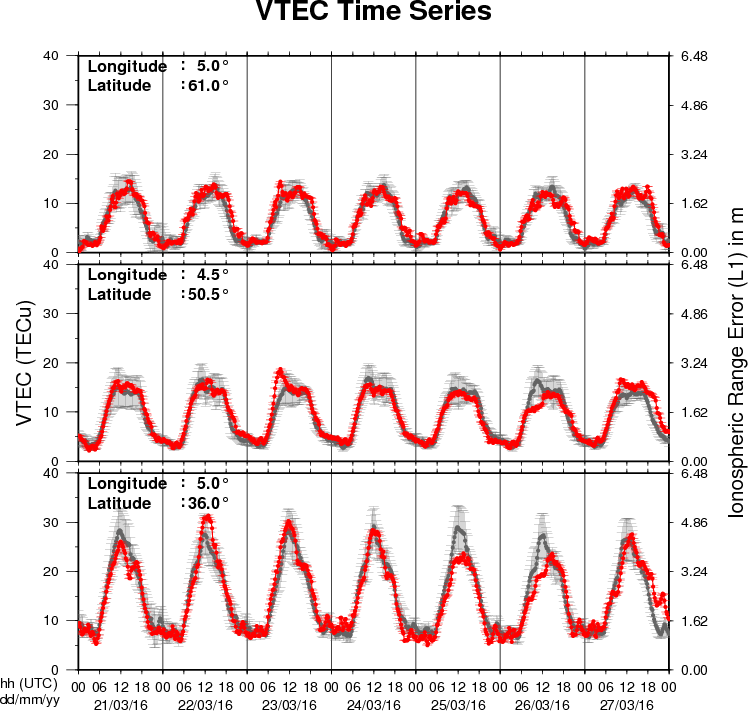
The figure shows the time evolution of the Vertical Total Electron Content (VTEC) (in red) during the last week at three locations:
a) in the northern part of Europe(N61°, 5°E)
b) above Brussels(N50.5°, 4.5°E)
c) in the southern part of Europe(N36°, 5°E)
This figure also shows (in grey) the normal ionospheric behaviour expected based on the median VTEC from the 15 previous days.
The VTEC is expressed in TECu (with TECu=10^16 electrons per square meter) and is directly related to the signal propagation delay due to the ionosphere (in figure: delay on GPS L1 frequency).
The Sun's radiation ionizes the Earth's upper atmosphere, the ionosphere, located from about 60km to 1000km above the Earth's surface.The ionization process in the ionosphere produces ions and free electrons. These electrons perturb the propagation of the GNSS (Global Navigation Satellite System) signals by inducing a so-called ionospheric delay.
See http://stce.be/newsletter/GNSS_final.pdf for some more explanations ; for detailed information, see http://gnss.be/ionosphere_tutorial.php