- Table of Content
- 1.CESRA meeting ...
- 2.Spectacular pr...
- 3.PROBA2 Observa...
- 4.Review of sola...
- 5.The Internatio...
- 6.Review of geom...
- 7.Geomagnetic Ob...
- 8.Review of iono...
2. Spectacular prominence eruption
3. PROBA2 Observations (28 Mar 2016 - 3 Apr 2016)
4. Review of solar activity
5. The International Sunspot Number
6. Review of geomagnetic activity
7. Geomagnetic Observations at Dourbes (28 Mar 2016 - 3 Apr 2016)
8. Review of ionospheric activity (28 Mar 2016 - 3 Apr 2016)
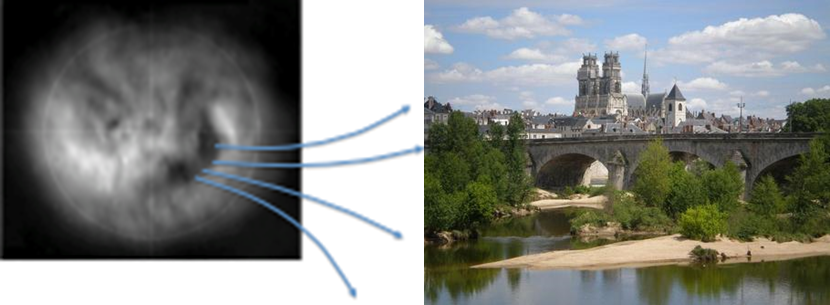
CESRA meeting 2016 : Working group on Space Weather and Solar Radio Science
CESRA, the "Community of European Solar Radio Astronomers" organizes every three years a meeting that brings together solar radio astronomers from Europe and beyond, to discuss the latest challenges and discoveries in their discipline. During the 2016 CESRA meeting that will be held in Orléans, France, from June 13 - 17, 2016, a series of Science Working groups will take place.
WG4: “Space Weather” is devoted to the use of radio astronomical observations for operational activities aiming at improving our understanding of Space Weather. We invite participants of the CESRA meeting to attend and present contributions that are relevant to Space Weather. In particular, we would like to emphasize the following aspects:
Observations
- What is the status of our current capabilities in solar radio monitoring for SW purposes?
- How can we improve existing facilities and set up new observing networks for a better time coverage of solar observations?
- How to improve calibration of solar observations: can we set up new international standardization procedures? What is the long term stability of existing data (spectra and time series)?
- How to detect and classify solar radio bursts in dynamic spectra for making automated alerts?
Forecasts
- How to make solar radio observations more accessible and understandable to non-radio physicists?
- What is the use of solar radio observations (ground based or space-borne) for modelling of SW events?
- What is the status of daily/monthly forecasts techniques of centimetric radio fluxes such as the F10.7 index?
Impacts
- Which operational services are the more likely to be impacted by solar radio emissions?
- How can we build resilient systems? How can solar radio monitoring be useful?
Conference website: http://cesra2016.sciencesconf.org/
The deadline for abstract submission is April 30.
WG organizers: Thierry Dudok de Wit (Université d’Orléans, France), Christophe Marqué (Royal Observatory of Belgium)
Spectacular prominence eruption
Solar prominences are clouds of charged particles ("plasma") above the solar surface squeezed between magnetic regions of opposite polarity. Being cooler and denser than the plasma underneath and their surroundings, they appear as bright blobs when seen near the solar limb and as dark lines when seen on the solar disk (then they are called "filaments"). Special filters are required to observe these features, such as in the Hydrogen-alpha (H-alpha) line in the red part of the solar spectrum, or in some extreme ultraviolet (EUV) passbands.
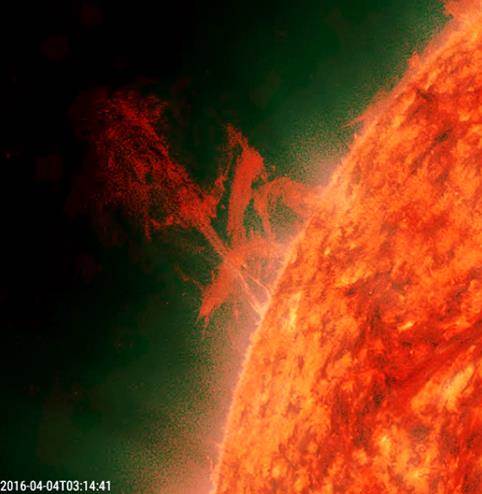
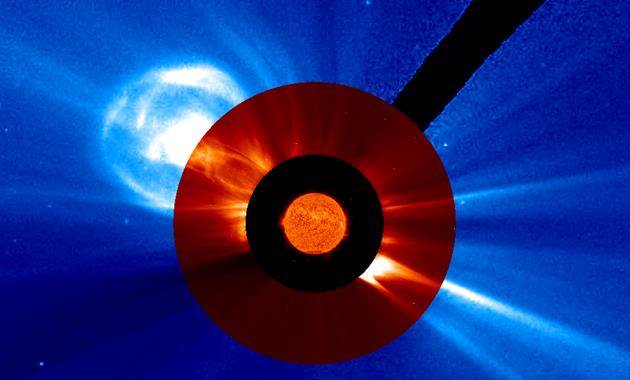
A rather large prominence started to round the northeast limb on 1 April and towered over 120.000 km or about 10 earth diameters above the solar surface 2 days later. The feature was highly active and, combined with its staggering height, finally erupted early on 4 April. It was associated with a very nice coronal mass ejection (CME) showing the three typical parts of a CME: a bright frontal loop surrounding a dark cavity and the core filament. Often, this kind of structure is reminiscent of a light bulb. The CME was not directed to Earth.
Using SDO (http://sdo.gsfc.nasa.gov/ ) and SOHO/LASCO (http://sohowww.nascom.nasa.gov/ ) imagery, a movie at https://youtu.be/wZ9hpRur1DE was created first showing a full disk and a zoom of the eruption in EUV (AIA304 and AIA193), followed by coronagraphic imagery of the associated CME.
PROBA2 Observations (28 Mar 2016 - 3 Apr 2016)
Solar Activity
Solar flare activity fluctuated between very low and low during the week.
In order to view the activity of this week in more detail, we suggest to go to the following website from which all the daily (normal and difference) movies can be accessed:
http://proba2.oma.be/ssa
This page also lists the recorded flaring events.
A weekly overview movie can be found here (SWAP week 314).
http://proba2.oma.be/swap/data/mpg/movies/weekly_movies/weekly_movie_2016_03_28.mp4
Details about some of this week’s events, can be found further below.
Monday Mar 28
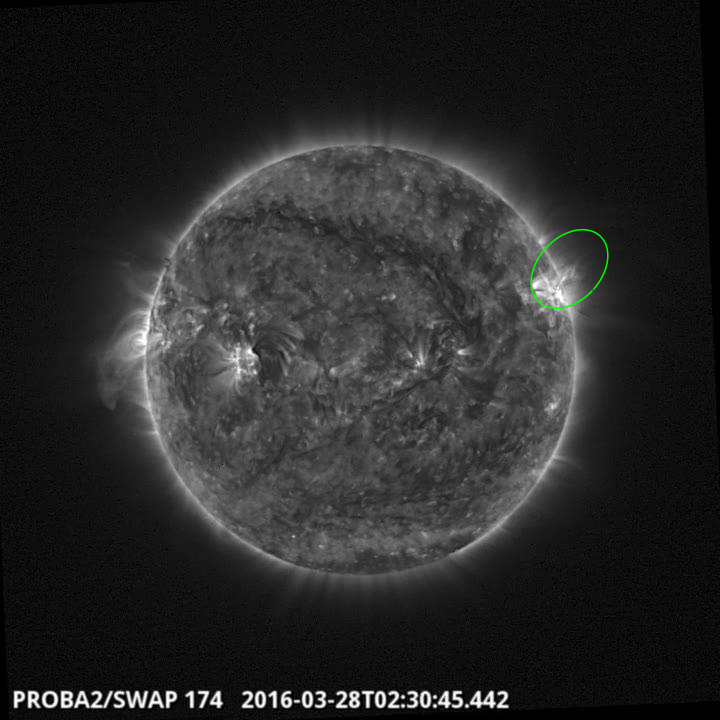
A partially confined eruption was observed by SWAP on the west limb at 02:30 UT on 2016 Mar 28
Find a movie of the event here (SWAP movie)
http://proba2.oma.be/swap/data/mpg/movies/20160328_swap_movie.mp4
Tuesday Mar 29
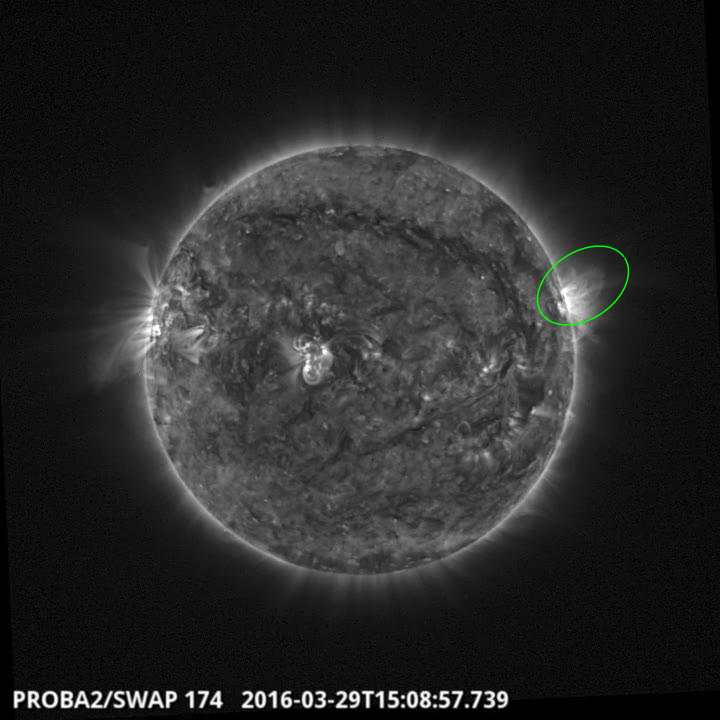
An eruption was observed by SWAP on the west limb at 15:08 UT on 2016 Mar 29
Find a movie of the event here (SWAP movie)
http://proba2.oma.be/swap/data/mpg/movies/20160329_swap_movie.mp4
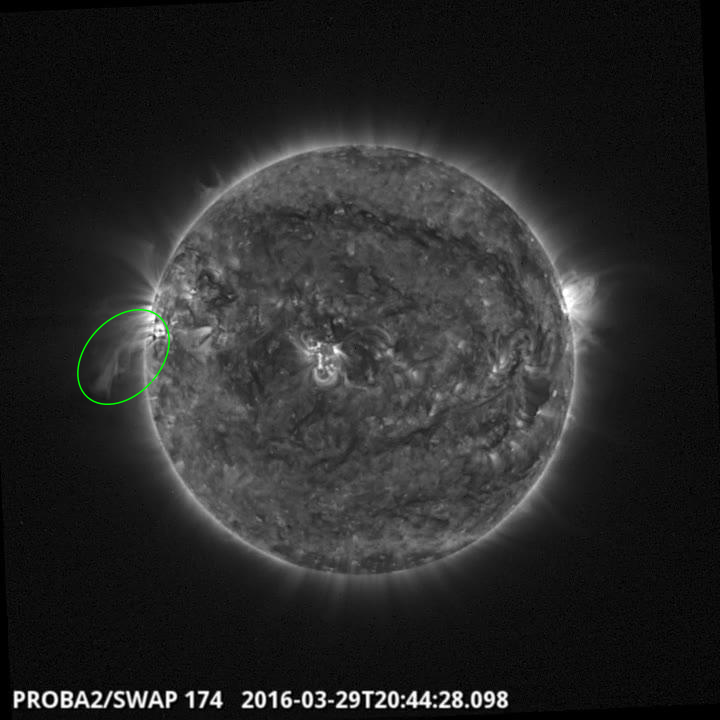
A partially confined eruption was observed by SWAP on the east limb at 20:44 UT on 2016 Mar 29
Find a movie of the event here (SWAP movie)
http://proba2.oma.be/swap/data/mpg/movies/20160329_swap_movie.mp4
Thursday Mar 31
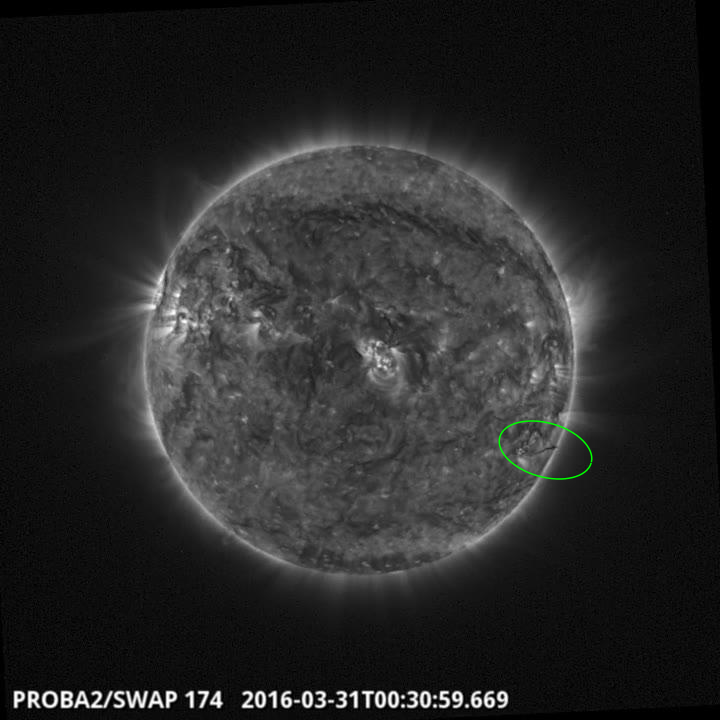
A partially confined eruption was observed by SWAP on the west limb at 00:30 UT on 2016 Mar 31
Find a movie of the event here (SWAP movie)
http://proba2.oma.be/swap/data/mpg/movies/20160331_swap_movie.mp4
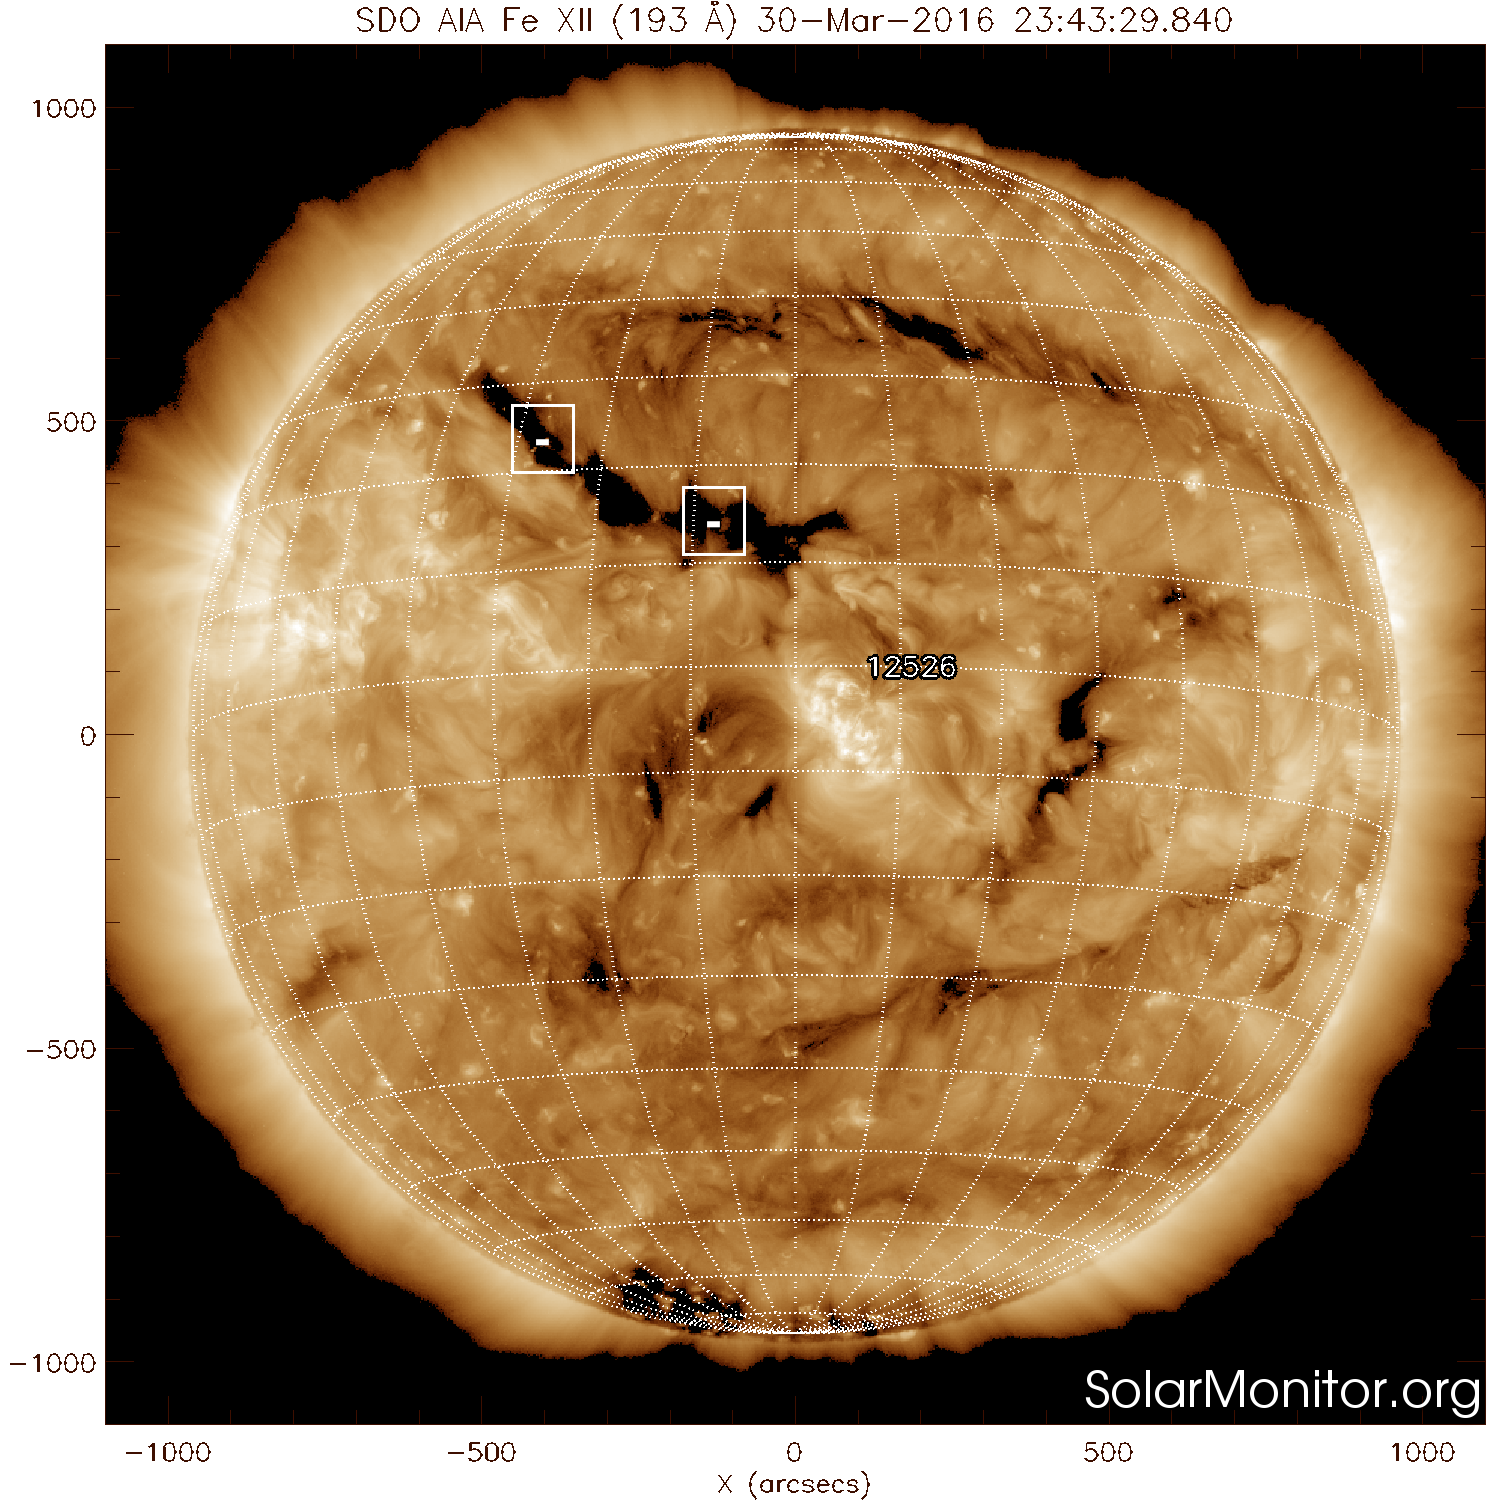
Review of solar activity
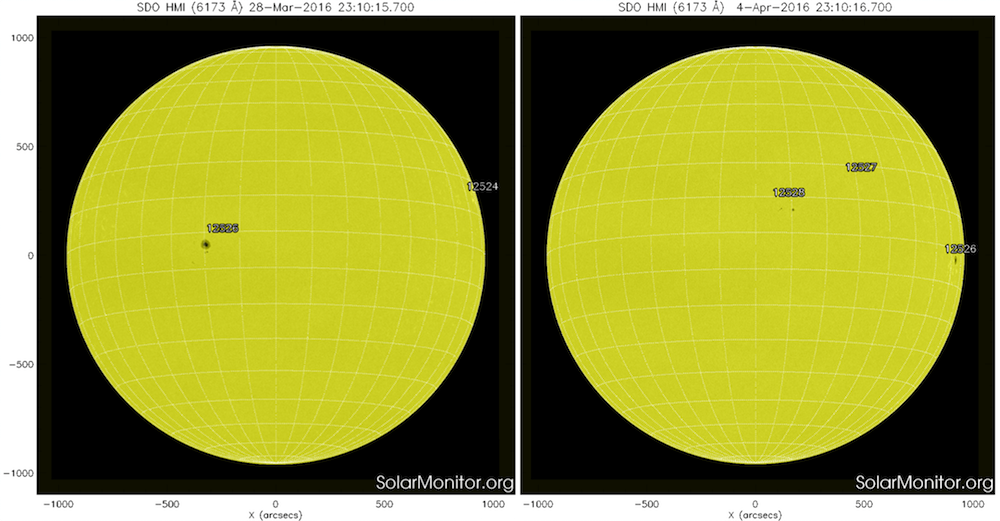
Solar activity was very low during the period with only a single C2 flare from NOAA 2524 early on 28 March. NOAA 2524 was at that moment located at the west limb. The x-ray background flux was at or below the B1 level for most of the week. For most of the week, NOAA 2526 was the sole sunspot group visible on the solar disk.
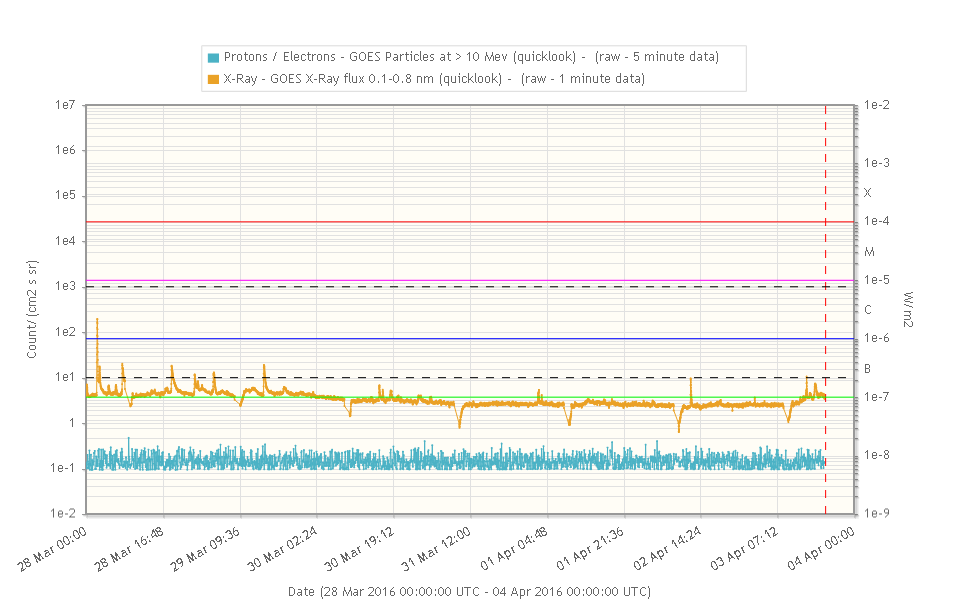
No earth-directed coronal mass ejections were observed.
The International Sunspot Number
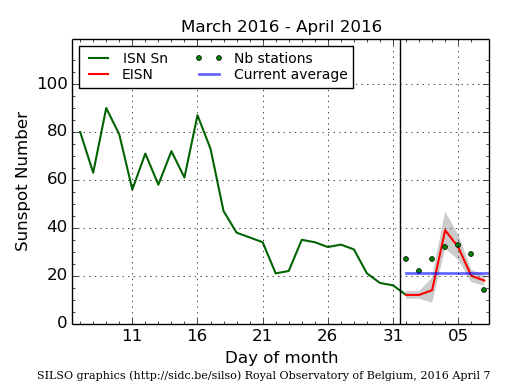
The daily Estimated International Sunspot Number (EISN, red curve with shaded error) derived by a simplified method from real-time data from the worldwide SILSO network. It extends the official Sunspot Number from the full processing of the preceding month (green line). The plot shows the last 30 days (about one solar rotation). The horizontal blue line shows the current monthly average, while the green dots give the number of stations included in the calculation of the EISN for each day.
Review of geomagnetic activity
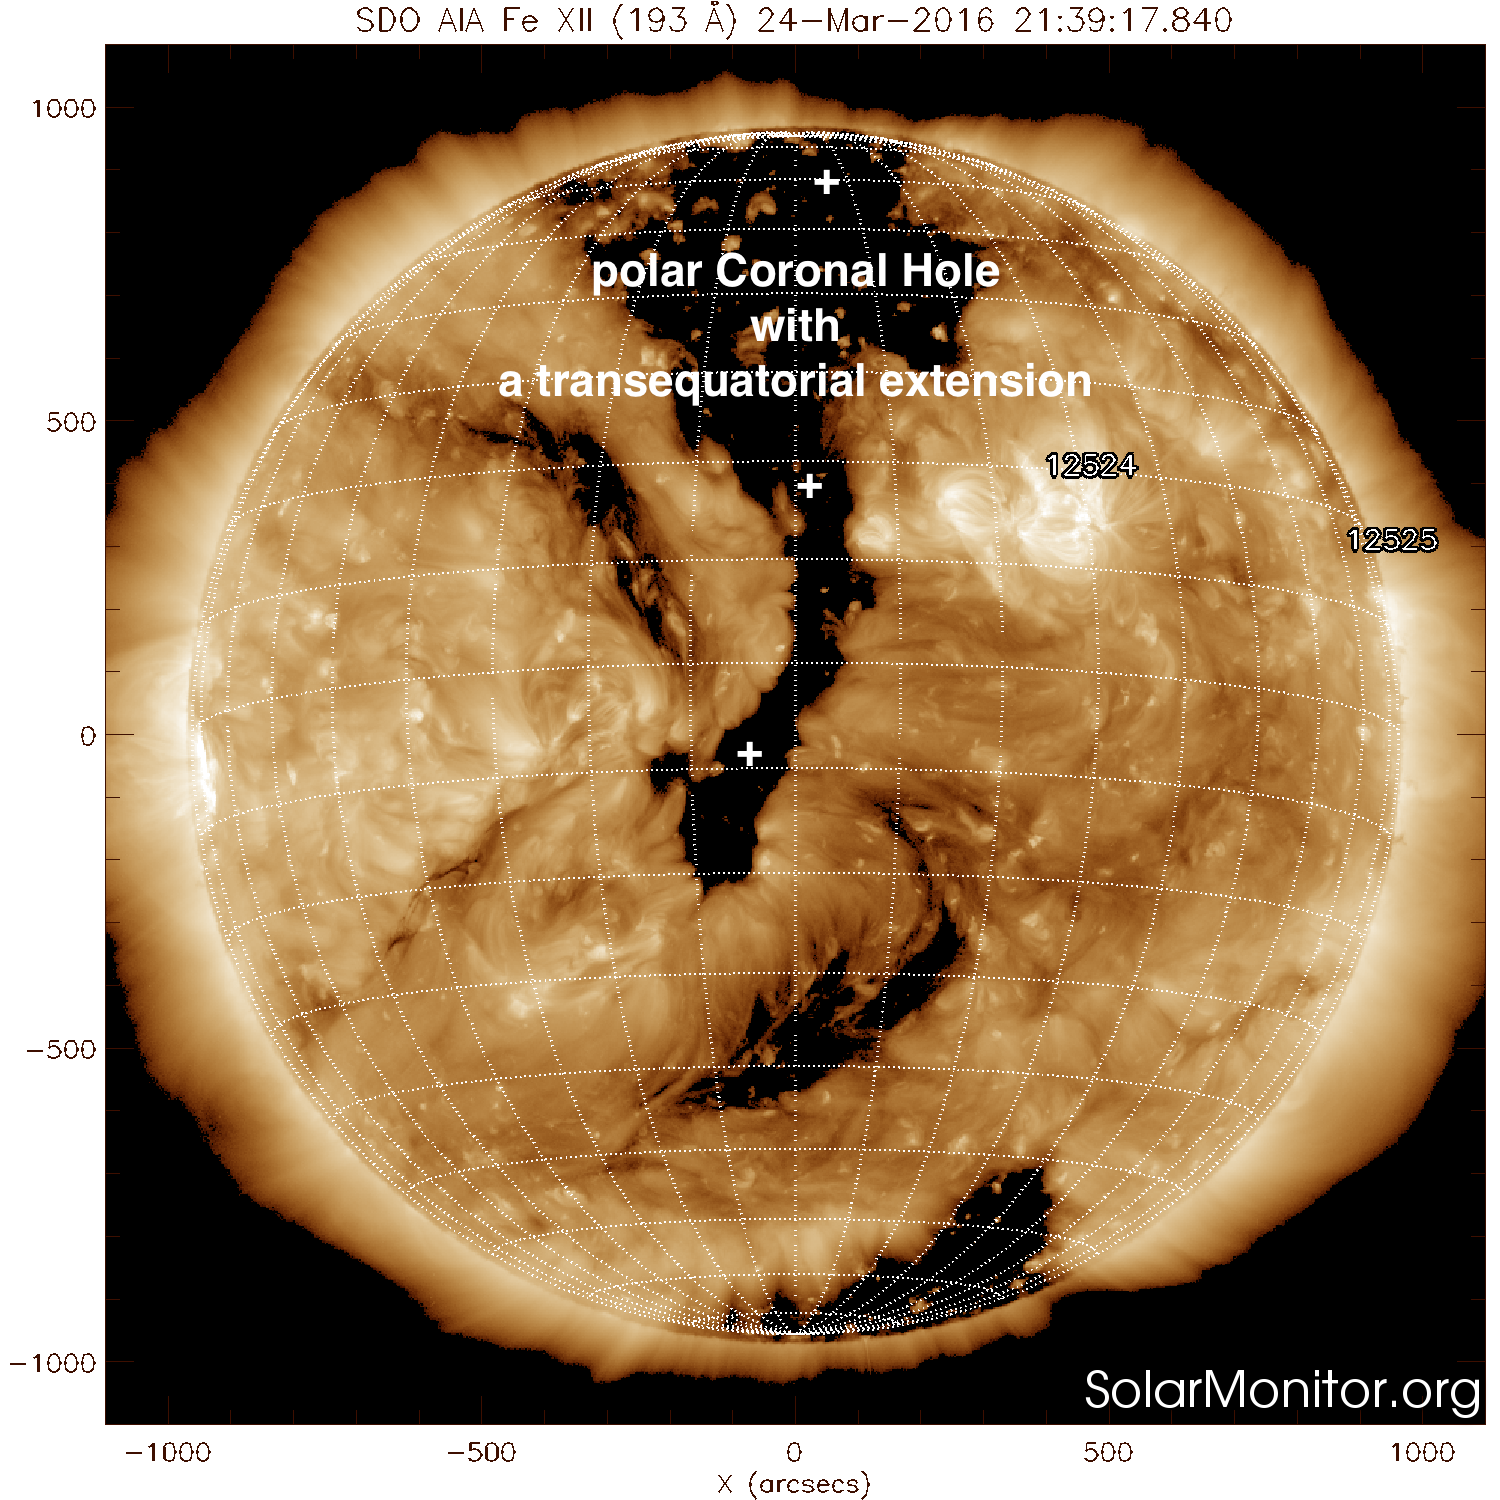
The first half of the week, Earth was under the influence of a high speed stream from a positive transequatorial coronal hole.
The parameter Phi measured by ACE stayed mainly between 90° and 180° (see 2nd window of the ACE graph below).
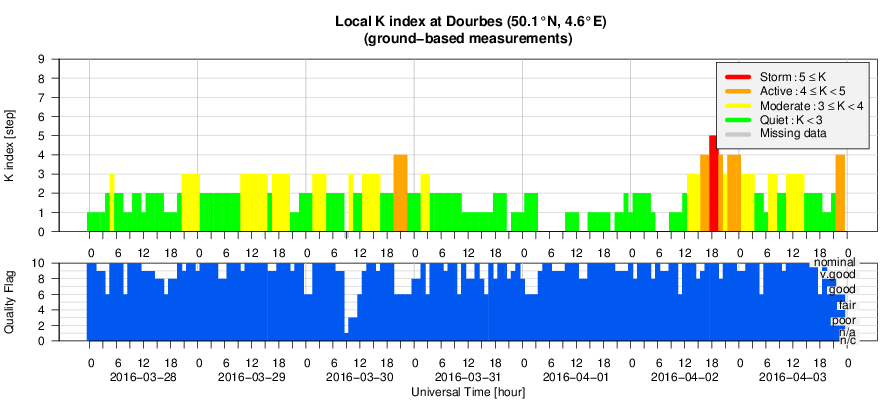
Despite wind speeds reaching a maximum early on 30 March of about 570-590 km/s, only active geomagnetic conditions were recorded on 28 (Kp) and 30 March (Kp and Dourbes).
Solar wind speed then gradually declined until early on 2 April, when a co-rotating interaction region and the associated wind stream from a small negative coronal hole arrived.
Solar wind speeds slowly increased from about 330 km/s at 08:00UT to about 530 km/s around 21:30UT. A sharp drop in wind density from 40 to 7 particles per cm3 occurred at 14:05UT, coinciding with a final shift in the direction of the interplanetary magnetic field from away to towards the Sun. It was followed about an hour later by a strong dive of Bz towards negative values around -14 nT, with sustained but gradually weakening negative values over the subsequent 7 hours.
This disturbance resulted in the Kp index reaching minor storm levels on 2 April during the 15-18UT interval, and moderate geomagnetic storming during the 21-24UT interval. K Dourbes was resp. at minor storming and active conditions. Solar wind effects then quickly tapered off to nominal values, with only an active interval recorded at the very end of the period.
Geomagnetic Observations at Dourbes (28 Mar 2016 - 3 Apr 2016)
Review of ionospheric activity (28 Mar 2016 - 3 Apr 2016)
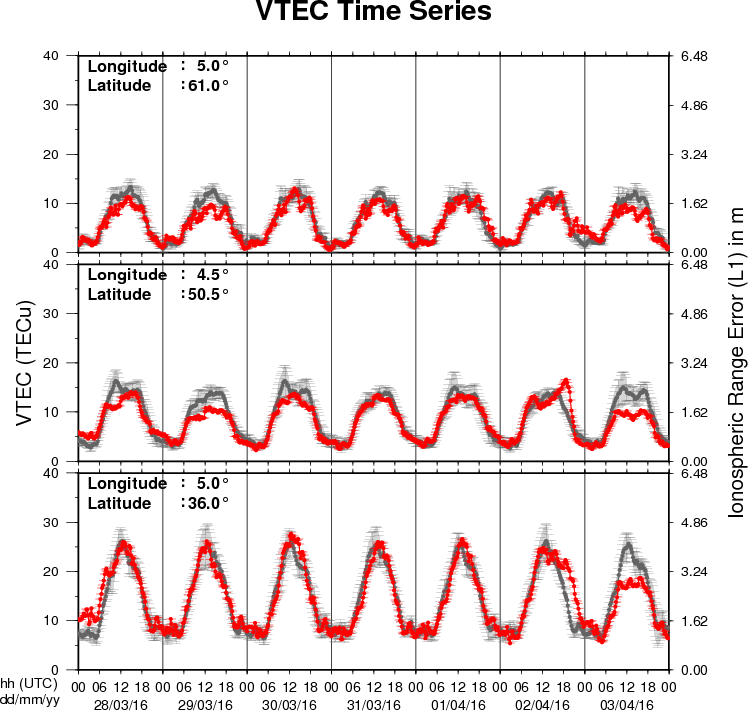
The figure shows the time evolution of the Vertical Total Electron Content (VTEC) (in red) during the last week at three locations:
a) in the northern part of Europe(N61°, 5°E)
b) above Brussels(N50.5°, 4.5°E)
c) in the southern part of Europe(N36°, 5°E)
This figure also shows (in grey) the normal ionospheric behaviour expected based on the median VTEC from the 15 previous days.
The VTEC is expressed in TECu (with TECu=10^16 electrons per square meter) and is directly related to the signal propagation delay due to the ionosphere (in figure: delay on GPS L1 frequency).
The Sun's radiation ionizes the Earth's upper atmosphere, the ionosphere, located from about 60km to 1000km above the Earth's surface.The ionization process in the ionosphere produces ions and free electrons. These electrons perturb the propagation of the GNSS (Global Navigation Satellite System) signals by inducing a so-called ionospheric delay.
See http://stce.be/newsletter/GNSS_final.pdf for some more explanations ; for detailed information, see http://gnss.be/ionosphere_tutorial.php