- Table of Content
- 1.A view on a sp...
- 2.Review of sola...
- 3.The Internatio...
- 4.Noticeable Sol...
- 5.PROBA2 Observa...
- 6.Review of geom...
- 7.Geomagnetic Ob...
- 8.Review of iono...
- 9.Future Events
- 10.New documents ...
2. Review of solar activity
3. The International Sunspot Number
4. Noticeable Solar Events (18 Jul 2016 - 24 Jul 2016)
5. PROBA2 Observations (18 Jul 2016 - 24 Jul 2016)
6. Review of geomagnetic activity
7. Geomagnetic Observations at Dourbes (18 Jul 2016 - 24 Jul 2016)
8. Review of ionospheric activity (18 Jul 2016 - 24 Jul 2016)
9. Future Events
10. New documents in the European Space Weather Portal Repository
A view on a spectacular flare
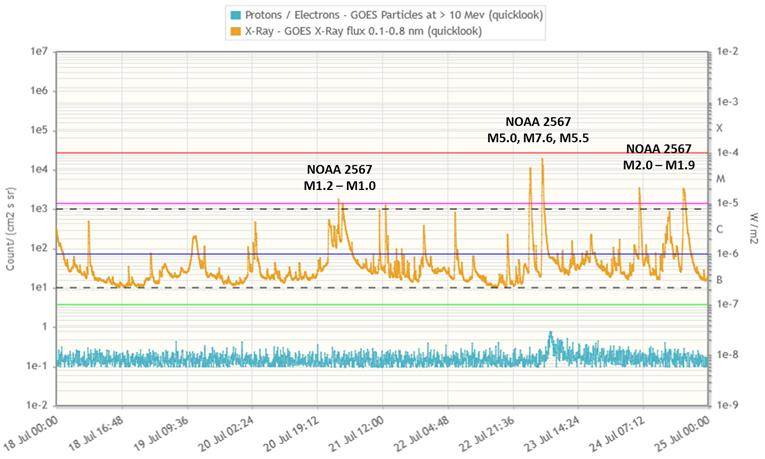
Last week, NOAA 2567 continued its growth in magnetic complexity and sunspot area. Early on 21 July, this active region produced an M1.2 flare which was the first "medium" event since the M6 flare on 18 April this year by NOAA 2529 (see the 19 April news item at http://www.stce.be/news/344/welcome.html ). NOAA 2567 would produce a total of 7 M-class flares, the strongest being an M7.6 event on 23 July which was the most powerful since the M7.9 flare by NOAA 2371 more than a year ago (see this 5 August news item at http://www.stce.be/news/316/welcome.html ).
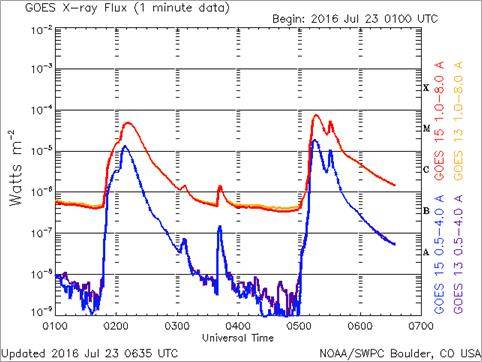
Closer examination of the GOES x-ray flux curve revealed that the M7.6 flare was closely followed by another M-class flare (see the red curve above). The double-peaked event started at 05:00UT with the M7 flare reaching its peak intensity at 05:16UT. It was in the aftermath of this flare that an impulsive M5.5 flare peaked only 15 minutes later. It lasted barely 6 minutes, but that was enough to strongly disturb a whole range of radio frequencies (245 MHz to 15.4 GHz). The M7/M5 pair slightly enhanced the greater than 10 MeV proton flux, and was associated with a coronal mass ejection directed away from the Earth.
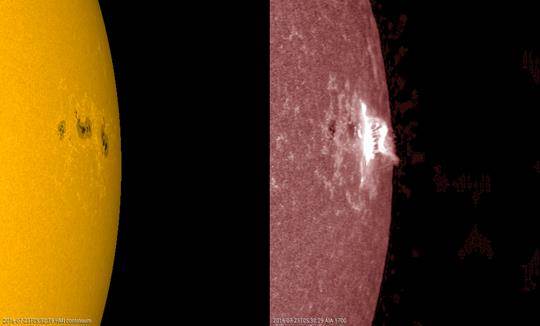
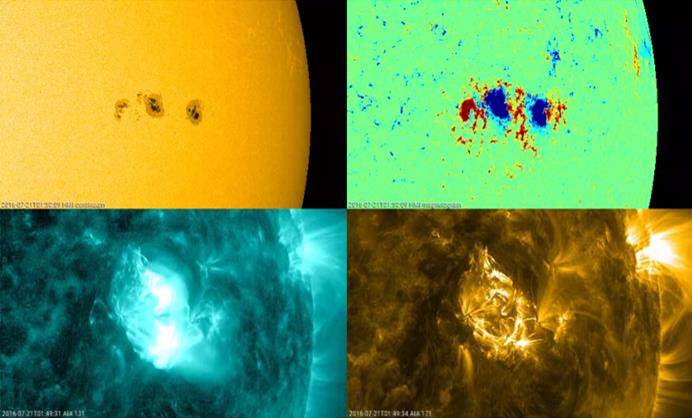
Using SDO imagery (http://sdo.gsfc.nasa.gov/ ), a movie of the event was created and can be found at https://youtu.be/QKz1FyEtZiI . Each clip spans the period from 04:30UT till 07:30UT, at a cadence of 1 image per minute. The screen shot above compares a view of the sunspot cluster in white light with a view in far ultraviolet (AIA 1700), the latter corresponding to the temperature minimum in the solar atmosphere at a height slightly above the visible solar "surface". The timing of the picture almost coincides with that of the peak x-ray intensity of the M5.5 flare. The imagery shows that the flaring events are taking place along the magnetic inversion line (the "borderline") between NOAA 2567 and NOAA 2565 (see last week's news item at http://www.stce.be/news/358/welcome.html ). A parallel ribbon flare (two elongated parallel bright patches) can be recognized in both cases.
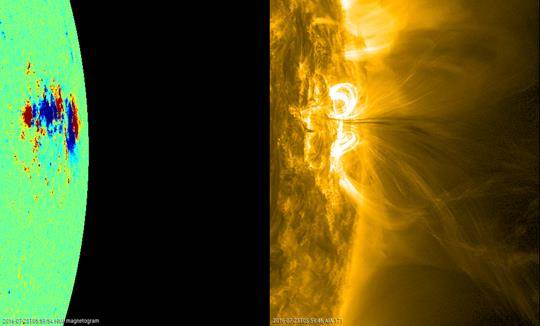
The next clip compares the magnetogram of the sunspot groups with extreme ultraviolet (EUV) images from the AIA 171 channel, which shows the upper transition zone at temperatures near 700.000 degrees. The clip emphasizes the dramatic outlook of the flaring events, in particular from the M5.5 flare. Material is being ejected along twisted magnetic field lines, but also dark ("colder") material can be seen flowing back to the Sun, some of which along a relatively narrow magnetic funnel ending near NOAA 2567's main spot. Also the post-flare coronal loops to the north and south of NOAA 2567's main spot are clearly visible.
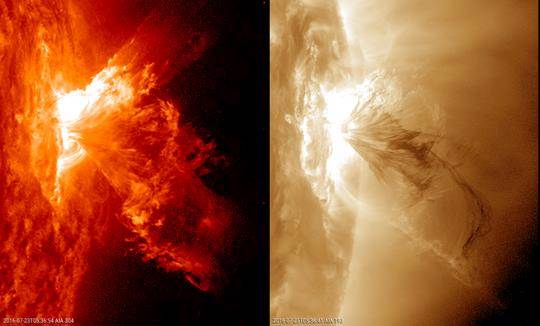
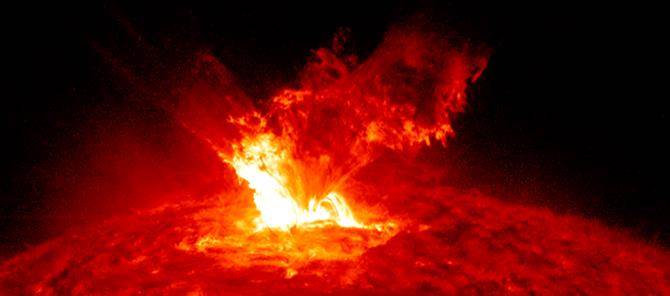
The last clip provides the most spectacular view on the flaring event, with EUV images in the AIA 304 (left) and AIA 193 (right) channel. These channels give a view on resp. the lower transition zone and the corona, at temperatures around resp. 80.000 and 1.5 million degrees. The whirling spraylike ejection of material as well as the downflow of cold material are standing out! The movie closes with a AIA 304 clip but with the imagery 90-degrees rotated (the flaring event is now on top), adding to the already dramatic outlook.
Review of solar activity
Solar activity was dictated by the NOAA 2565/2567 sunspot cluster. Most flares originated from NOAA 2567, due to this region's magnetic complexity and its interaction with nearby NOAA 2565. Seven M-class flares were recorded, all produced by NOAA 2567: on 21 July (2), 23 July (3) and 24 July (2).
The M1 flares on 21 July were preceded by a C4.6 flare peaking on 20 July at 22:17UT, which was associated with a type II radio burst with shock speed of 1168 km/s. Coronal mass ejections were observed to the northeast and southwest following this first intense flaring period. Underneath the outlook in white light (SDO/HMI), the magnetogram, and imagery in extreme ultraviolet (EUV; SDO/AIA 131 on the left and AIA 171 on the right) at the moment of the peak of the M1.0 flare (01:49UT).
The strongest event on 23 July was an M7.6 flare peaking at 05:16UT, followed by an impulsive M5.5 event only 15 minutes later. The latter was associated with an impressive spray of material (see rotated SDO/AIA 304 image underneath; the west limb is "up"), and a type II radio burst (shock speed of 729 km/s). A slight enhancement in the greater than 10 MeV proton flux was recorded in relation to this flaring activity (maximum of 0.77 pfu at 07:25UT see blue curve in graph on top), staying well below the event threshold. The associated CMEs have only a low probability of an earth-directed component. The two M-class flares from 24 July clearly did not have any associated earth-directed CMEs. By the end of the period, both NOAA 2565 and NOAA 2567 had rounded the west limb, leaving the Sun spotless.
The International Sunspot Number
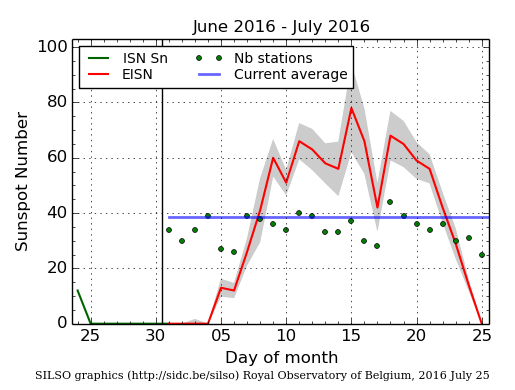
The daily Estimated International Sunspot Number (EISN, red curve with shaded error) derived by a simplified method from real-time data from the worldwide SILSO network. It extends the official Sunspot Number from the full processing of the preceding month (green line). The plot shows the last 30 days (about one solar rotation). The horizontal blue line shows the current monthly average, while the green dots give the number of stations included in the calculation of the EISN for each day.
Noticeable Solar Events (18 Jul 2016 - 24 Jul 2016)
| DAY | BEGIN | MAX | END | LOC | XRAY | OP | 10CM | TYPE | Cat | NOAA |
| 21 | 0042 | 0046 | 0050 | M1.2 | 9 | 2567 | ||||
| 21 | 0134 | 0149 | 0204 | M1.0 | 9 | 2567 | ||||
| 23 | 0146 | 0211 | 0223 | M5.0 | VI/2III/2 | 9 | 2567 | |||
| 23 | 0500 | 0516 | 0524 | N2W74 | M7.6 | 3B | 310 | III/2 | 9 | 2567 |
| 23 | 0527 | 0531 | 0533 | N2W74 | M5.5 | 3B | 900 | V/3IV/2II/1 | 9 | 2567 |
| 24 | 0609 | 0620 | 0632 | N3W84 | M2.0 | SF | 9 | 2567 | ||
| 24 | 1730 | 1743 | 1812 | M1.9 | 9 | 2567 |
| LOC: approximate heliographic location | TYPE: radio burst type |
| XRAY: X-ray flare class | Cat: Catania sunspot group number |
| OP: optical flare class | NOAA: NOAA active region number |
| 10CM: peak 10 cm radio flux |
PROBA2 Observations (18 Jul 2016 - 24 Jul 2016)
Solar Activity
Solar flare activity fluctuated between low and high during the week.
In order to view the activity of this week in more detail, we suggest to go to the following website from which all the daily (normal and difference) movies can be accessed:
http://proba2.oma.be/ssa
This page also lists the recorded flaring events.
A weekly overview movie can be found here (SWAP week 330).
http://proba2.oma.be/swap/data/mpg/movies/weekly_movies/weekly_movie_2016_07_18.mp4
Details about some of this week's events, can be found further below.
If any of the linked movies are unavailable they can be found in the P2SC movie repository here
http://proba2.oma.be/swap/data/mpg/movies/
Thursday Jul 21
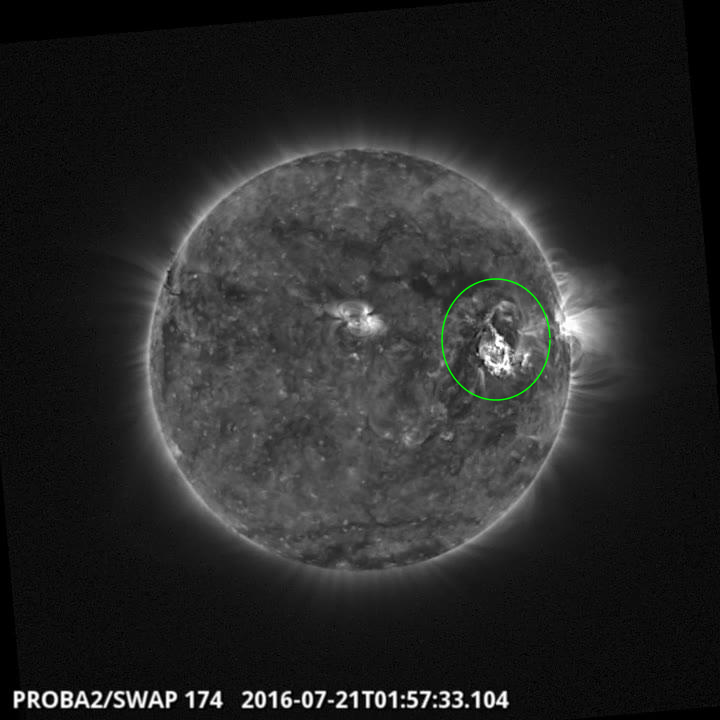
A Mclass flare was observed by SWAP on the north west quadrant of the Sun on 2016Jul21 at
01:57 UT
Find a movie of the events here (SWAP movie)
http://proba2.oma.be/swap/data/mpg/movies/20160721_swap_movie.mp4
Friday Jul 22
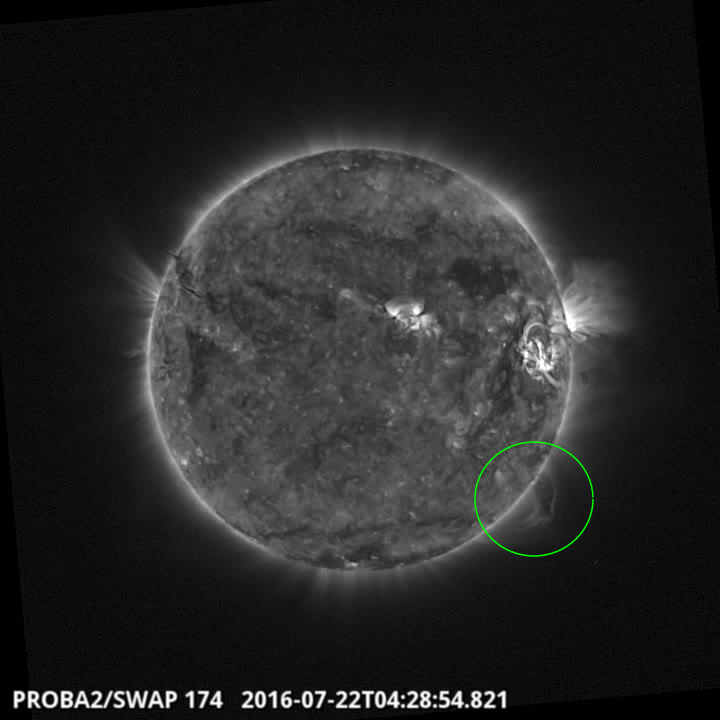
A failed eruption was observed by SWAP on the east limb of the Sun on 2016 Jul 22 at 04:28 UT
Find a movie of the events here (SWAP movie)
http://proba2.oma.be/swap/data/mpg/movies/20160722_swap_movie.mp4
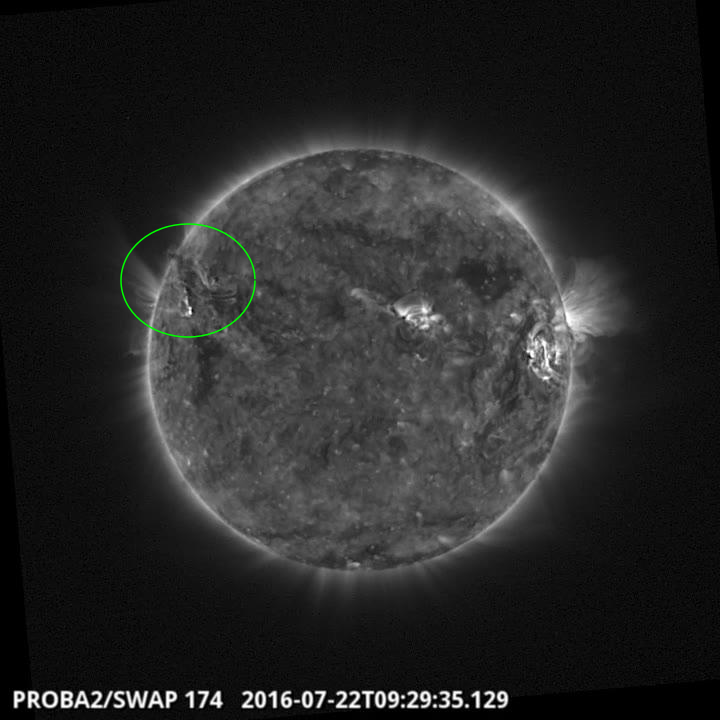
A failed eruption was observed by SWAP on the east limb of the Sun on 2016 Jul 22 at 09:29 UT
Find a movie of the events here (SWAP movie)
http://proba2.oma.be/swap/data/mpg/movies/20160722_swap_movie.mp4
Saturday Jul 23
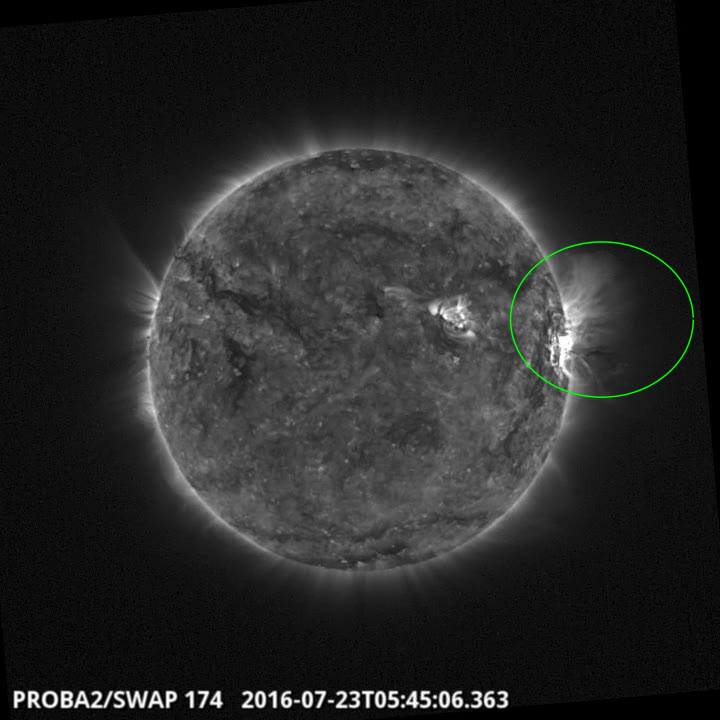
An eruption was observed by SWAP on the east limb of the Sun on 2016 Jul 23 at 05:45 UT
Find a movie of the events here (SWAP movie)
http://proba2.oma.be/swap/data/mpg/movies/20160723_swap_movie.mp4
Review of geomagnetic activity
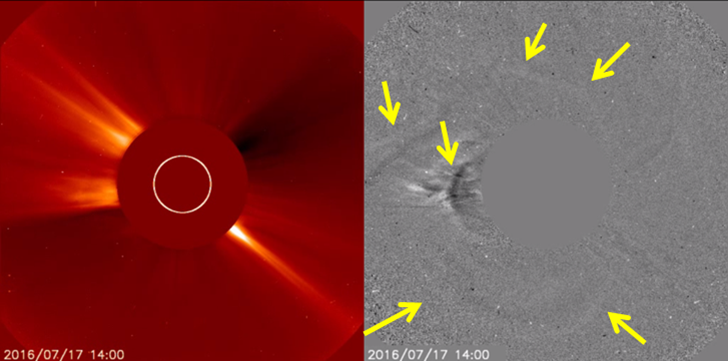
Solar wind and associated geomagnetic activity were dominated by two events. A shock in the solar wind speed (yellow curve) was observed on 19 July at 23:05UT, abruptly jumping from about 320 km/s to 450 km/s. Bz (red curve) varied initially between -12 and + 12 nT, then briefly dipped to -28 nT at 00:22UT (20 July) before turning strongly northward (+34 nT) between 00:45 and 01:15UT. The source of the disturbance was most likely the much earlier than expected arrival of a complex series of CMEs related to flaring activity in the NOAA 2565/2567 sunspot complex on 17 July (see annotated image underneath). Kp index reached minor geomagnetic storming levels during the 21-24UT, 00-03UT and 03-06UT intervals. At Dourbes, minor storming was reported from 01-04UT. Dst reached only a modest -28 nT.
During and following this event, the direction from the interplanetary magnetic field turned from away to towards the Sun (from "positive" to "negative"; see blue curve). It remained in this negative sector for the rest of the week, except for a brief positive period during the 22/17:00-23/02:00UT July interval.
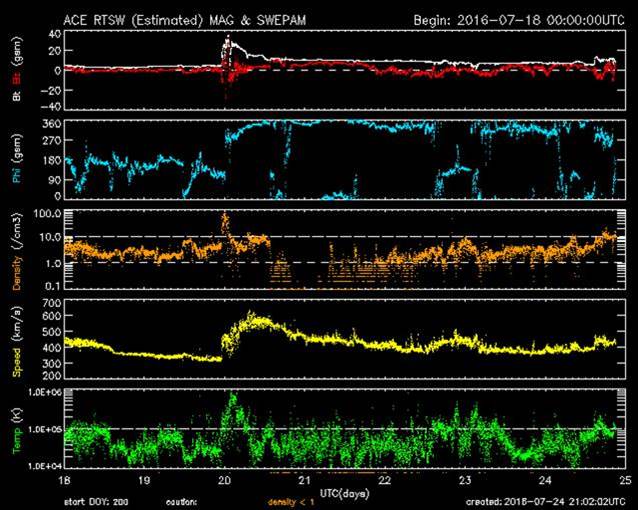
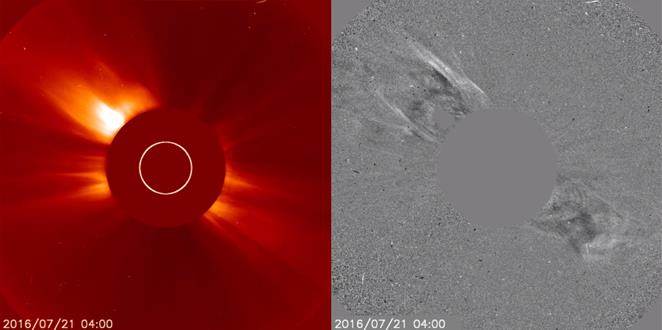
The second significant event occurred on 24 July, when a shock-like feature was observed in the solar wind parameters around 14:50UT. Solar wind speed increased fairly quickly from around 390 km/s to 460 km/s, with Bt (white curve) from +5 nT to +13 nT. Bz was near -9 nT around 15:40UT and 16:40UT, and near -11 nT around 20:05UT. The source of the disturbance was most likely the very late arrival of the CME(s) associated with flaring activity in NOAA 2565/2567 late on 20 July (see image underneath). Minor storming levels were reached by Kp during the 18-21UT interval on 24 July, and remained active afterwards. K Dourbes was mostly at active levels from the 15-18UT interval onwards. Dst was around -30 nT at the end of the reporting period.
Except for these two episodes early on 20 July and late on 24 July, geomagnetic conditions were quiet to unsettled.
Geomagnetic Observations at Dourbes (18 Jul 2016 - 24 Jul 2016)

Review of ionospheric activity (18 Jul 2016 - 24 Jul 2016)

The figure shows the time evolution of the Vertical Total Electron Content (VTEC) (in red) during the last week at three locations:
a) in the northern part of Europe(N61°, 5°E)
b) above Brussels(N50.5°, 4.5°E)
c) in the southern part of Europe(N36°, 5°E)
This figure also shows (in grey) the normal ionospheric behaviour expected based on the median VTEC from the 15 previous days.
The VTEC is expressed in TECu (with TECu=10^16 electrons per square meter) and is directly related to the signal propagation delay due to the ionosphere (in figure: delay on GPS L1 frequency).
The Sun's radiation ionizes the Earth's upper atmosphere, the ionosphere, located from about 60km to 1000km above the Earth's surface.The ionization process in the ionosphere produces ions and free electrons. These electrons perturb the propagation of the GNSS (Global Navigation Satellite System) signals by inducing a so-called ionospheric delay.
See http://stce.be/newsletter/GNSS_final.pdf for some more explanations ; for detailed information, see http://gnss.be/ionosphere_tutorial.php
Future Events
For more details, see http://www.spaceweather.eu/en/event/future
Global Modelling of the Space Weather Chain in Helsinki, Finland
Start : 2016-10-24 - End : 2016-10-28
This event brings together solar, heliospheric, magnetospheric,
and ionospheric communities to discuss the current state and future
challenges in global modelling of the entire space weather chain.
Major developments in forecasting space weather, and understanding
the effects of solar eruptions requires increased communication and
collaboration of these often rather distinct communities. We
welcome submissions from these modelling communities and also
synergetic studies utilising both observations and numerical
models.
Website:
https://pnst.ias.u-psud.fr/sites/pnst/files/global_modelling_space_weather_oct2016.pdf
European Space Weather Week in Ostend, Belgium
Start : 2016-11-14 - End : 2016-11-18
The ESWW is the main annual event in the European Space Weather
calendar. It is the European forum for Space Weather as proven by
the high attendance to the past editions. The agenda will be
composed of plenary/parallel sessions, working meetings and
dedicated events for service end-users. The ESWW will again adopt
the central aim of bringing together the diverse groups in Europe
working on different aspects of Space Weather.
Website:
http://www.stce.be/esww13/
Solar Orbiter Workshop 7: Exploring the solar environs in Granada, Spain
Start : 2017-04-03 - End : 2017-04-06
This event will be hosted by the Instituto de Astrofisica de
Andalucia - CSIC. Please mind that on April 7th the 20th SWT
meeting will take place at the same venue.
Website: Unkown