- Table of Content
- 1.New release of...
- 2.Review of sola...
- 3.The SIDC Space...
- 4.The Internatio...
- 5.Geomagnetic Ob...
- 6.Review of iono...
2. Review of solar and geomagnetic activity
3. The SIDC Space weather Briefing
4. The International Sunspot Number
5. Geomagnetic Observations at Dourbes (30 Oct 2017 - 5 Nov 2017)
6. Review of ionospheric activity (30 Oct 2017 - 5 Nov 2017)
New release of STAFF
The SIDC team is pleased to announce a new release for STAFF (version 5.6)
Release date: 25/10/2017 - 27/10/2017
webpage: http://www.staff.oma.be

The Solar Timelines viewer for AFFECTS (STAFF) is a dynamical online viewer that provides a whole range of timelines related to solar activity and space weather like GOES X-ray flux, DSCOVRIMF and solar wind data, 10.7 cm flux, the new version of the international sunspot number (SILSO) and image based timelines. Most datasets are available in near real-time.
This new version contains :
* “clear selection” button
* “reset” (back to default) option (in the “Advanced” menu)
* Timelines are re-ordered within each category
* NRTI improvements, including E-SWDS privileged access to NOAA data.
* Copyright notice on image export
* GOES X-Ray background flux
* SDO/AIA and SOHO/EIT image statistics
* Improvements to the StaffBox (See the help section for more information on the StaffBox)
* General improvements and bug fixes
At your service
Review of solar and geomagnetic activity
SOLAR ACTIVITY
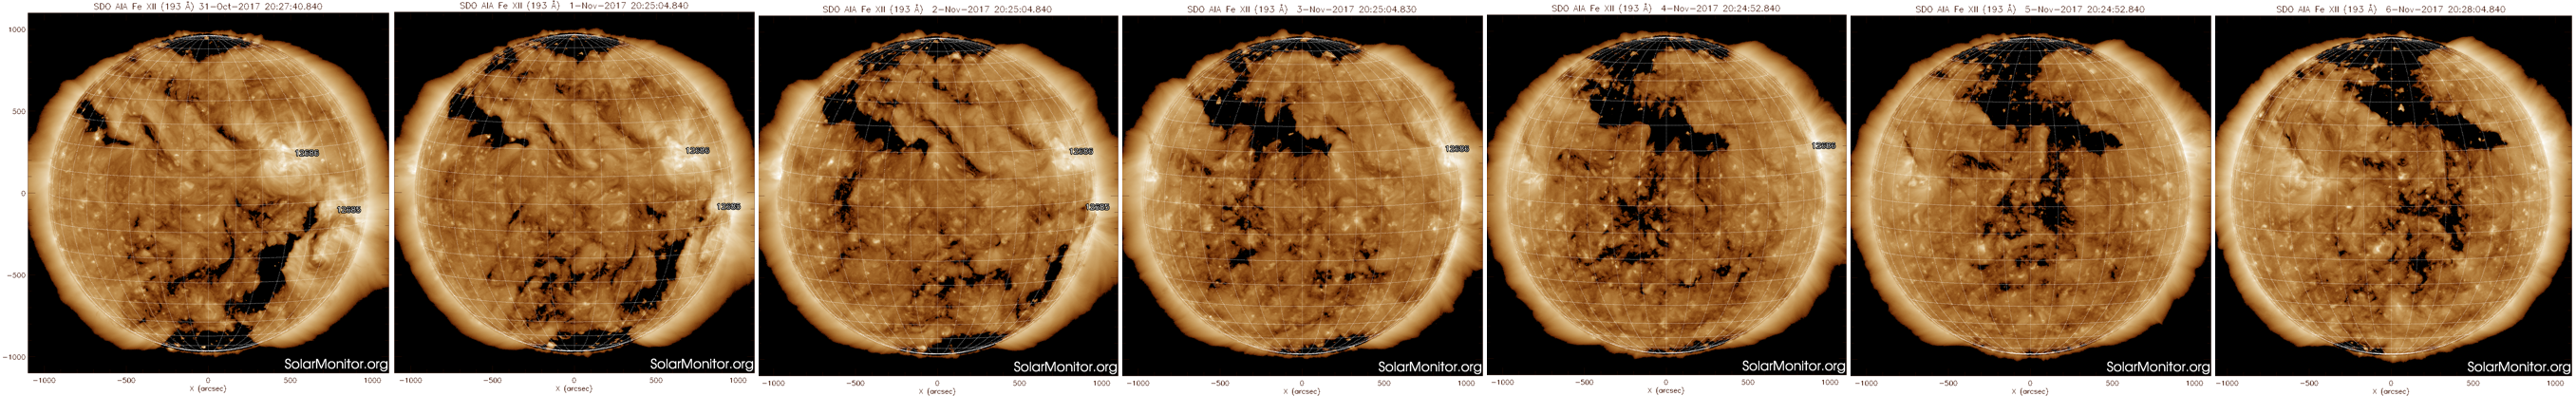
At the beginning of the week, two active regions were visible on the solar disk: NOAA 2685 (Catania 60) and NOAA 2686 (Catania 61). These regions produced no flares above the B level, and decayed into plages on 1 November.
No significant CMEs were detected.
A coronal hole (negative southern hemisphere) turned into Earth affecting position on 1 November.
There were no SEP events.
Below, a series of SDO pictures, one per day. You clearly can see the southern coronal hole rotating into a geo-effective position. The influence of the big northern coronal hole that rotates nicely into view is for next weeks bulletin.
GEOMAGNETIC ACTIVITY
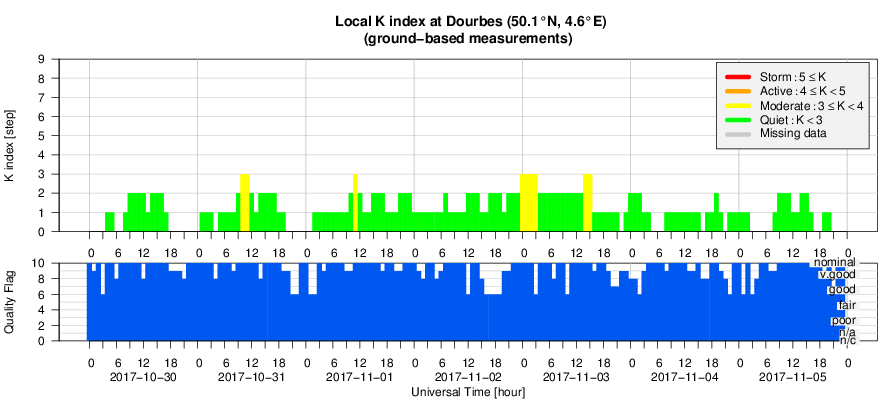
The Earth was inside the slow solar wind throughout the week. The fast speed stream from the southern hemisphere coronal hole passed mostly to the south of the Earth, producing only minor effects starting on 1 November. The speed did not go higher than 450 km/s. The magnetic field elevated up to 15 nT, leading to only one 3h interval of Kp = 4 and KDourbes = 3 on 3 November.
The SIDC Space weather Briefing
The Space Weather Briefing presented by the forecaster on duty from October 31 to November 5. It reflects in images and graphs what is written in the Solar and Geomagnetic Activity report.
Briefing in pdf-format: http://www.stce.be/briefings/SIDCbriefing-20171106.pdf
The International Sunspot Number
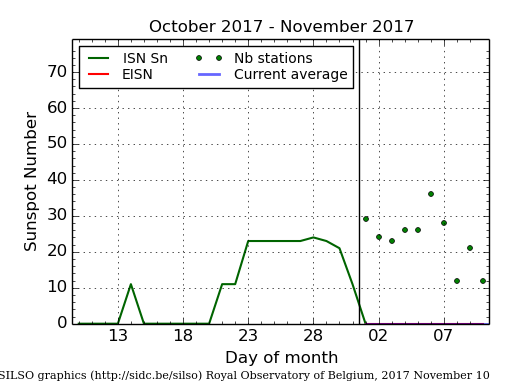
The daily Estimated International Sunspot Number (EISN, red curve with shaded error) derived by a simplified method from real-time data from the worldwide SILSO network. It extends the official Sunspot Number from the full processing of the preceding month (green line). The plot shows the last 30 days (about one solar rotation). The horizontal blue line shows the current monthly average, while the green dots give the number of stations included in the calculation of the EISN for each day.
Geomagnetic Observations at Dourbes (30 Oct 2017 - 5 Nov 2017)
Review of ionospheric activity (30 Oct 2017 - 5 Nov 2017)
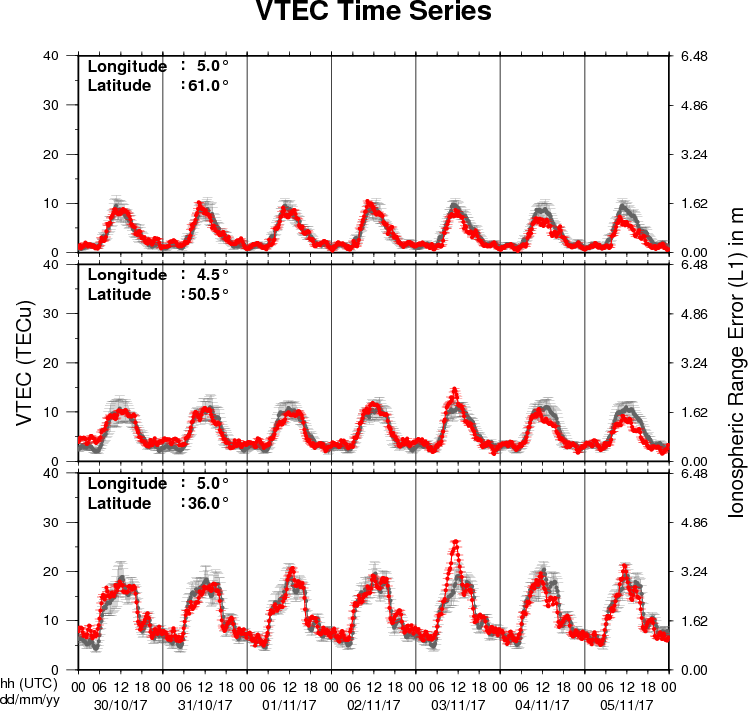
The figure shows the time evolution of the Vertical Total Electron Content (VTEC) (in red) during the last week at three locations:
a) in the northern part of Europe(N61°, 5°E)
b) above Brussels(N50.5°, 4.5°E)
c) in the southern part of Europe(N36°, 5°E)
This figure also shows (in grey) the normal ionospheric behaviour expected based on the median VTEC from the 15 previous days.
The VTEC is expressed in TECu (with TECu=10^16 electrons per square meter) and is directly related to the signal propagation delay due to the ionosphere (in figure: delay on GPS L1 frequency).
The Sun's radiation ionizes the Earth's upper atmosphere, the ionosphere, located from about 60km to 1000km above the Earth's surface.The ionization process in the ionosphere produces ions and free electrons. These electrons perturb the propagation of the GNSS (Global Navigation Satellite System) signals by inducing a so-called ionospheric delay.
See http://stce.be/newsletter/GNSS_final.pdf for some more explanations ; for detailed information, see http://gnss.be/ionosphere_tutorial.php