- Table of Content
- 1.Review of sola...
- 2.Review of geom...
- 3.The SIDC Space...
- 4.The Internatio...
- 5.Geomagnetic Ob...
- 6.Review of iono...
2. Review of geomagnetic activity
3. The SIDC Space weather Briefing
4. The International Sunspot Number
5. Geomagnetic Observations at Dourbes (6 Nov 2017 - 12 Nov 2017)
6. Review of ionospheric activity (6 Nov 2017 - 12 Nov 2017)
Review of solar activity
Over the past week, the solar activity was low as the solar disc remained spotless the whole week. No flare has been recorded and the X-ray flux remained below C-class flare level.
Several filaments were observed in H alpha solar images. On Nov 10, one of the filaments located in the North-East quadrant erupted creating a wide spread coronal dimming early morning. The eruption was then detected in SOHO/LASCO-C2 coronagraph on Nov 10 at 08:12 UT, but no Earth directed component was identified. No other Earth directed Coronal Mass Ejection have been observed, and the solar protons remained at background levels over the past 24 hours.
Review of geomagnetic activity
Until Nov 07 early morning, the solar wind environment remained at nominal level: The wind speed was around 300 km/s, the interplanetary magnetic field magnitude remained below 6 nT, and Bz component fluctuated between -2 and 2 nT. On Nov 07, the solar wind conditions became enhanced due to the sector boundary crossing at 03:00 UT (from a negative to a positive sector), which announced the soon arrival of the high speed stream associated with the northern extension Coronal Hole that has transited the central meridian on Nov 04. The wind speed then consistently increased to reach 650 km/s on Nov 07 around 19:15 UT, after a slight decrease (up to 500 km/s on Nov 09), it reached 710 km/s on Nov 10 around 13:00 UT and finally continuously decreased to the value of 400 km/s at the end of the week. The interplanetary magnetic field magnitude reached a maximum of 23 nT on Nov 07 at 15:48 UT, and the Bz component fluctuated between -15 and 13 nT being mainly negative around that period of time. These enhanced solar wind conditions persist until Nov 10 afternoon, then decrease to return to nominal conditions at the end of the week.
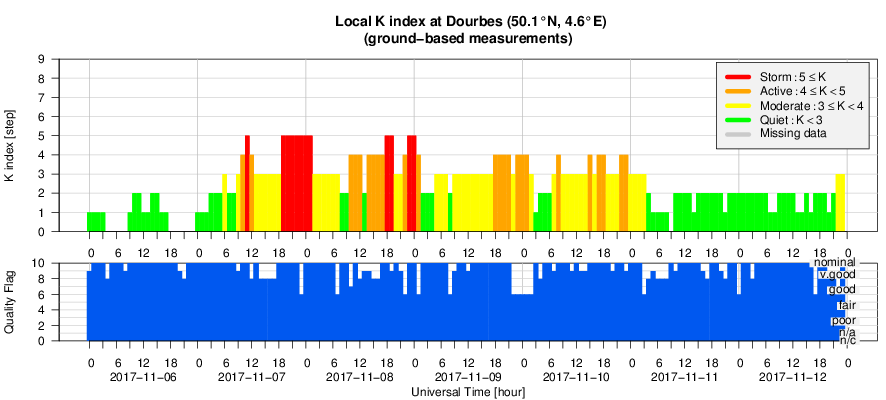
Disturbed geomagnetic conditions were observed on Nov 07, 08, and 09 with K-Dourbes up to 5 and Kp-NOAA up to 6 due to the arrival of the fast solar wind and the southward Bz component of the interplanetary magnetic field over several consecutive intervals. The geomagnetic conditions were then mostly quiet to unsettled with Kp (NOAA) and local K (Dourbes) indexes ranging between 0-3 at the end of the week.
The SIDC Space weather Briefing
The Space Weather Briefing presented by the forecaster on duty from November 6 to 12 It reflects in images and graphs what is written in the Solar and Geomagnetic Activity report.
The briefing in pdf format: http://www.stce.be/briefings/SIDCbriefing-20171113.pdf
Solar active region evolution - movie: http://www.stce.be/briefings/20171113_1JHV_2017-11-13_09.34.36.mp4
Filament - movie 1: http://www.stce.be/briefings/20171113_2JHV_2017-11-12_13.54.17.mp4
Filament - movie 2: http://www.stce.be/briefings/20171113_3JHV_2017-11-12_14.13.44.mp4
Filament - movie 3: http://www.stce.be/briefings/20171113_4JHV_2017-11-12_14.14.38.mp4
The International Sunspot Number
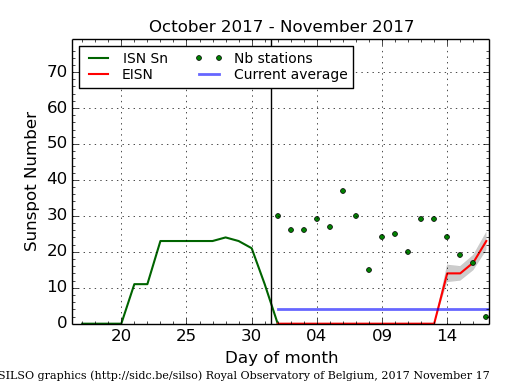
The daily Estimated International Sunspot Number (EISN, red curve with shaded error) derived by a simplified method from real-time data from the worldwide SILSO network. It extends the official Sunspot Number from the full processing of the preceding month (green line). The plot shows the last 30 days (about one solar rotation). The horizontal blue line shows the current monthly average, while the green dots give the number of stations included in the calculation of the EISN for each day.
Geomagnetic Observations at Dourbes (6 Nov 2017 - 12 Nov 2017)
Review of ionospheric activity (6 Nov 2017 - 12 Nov 2017)
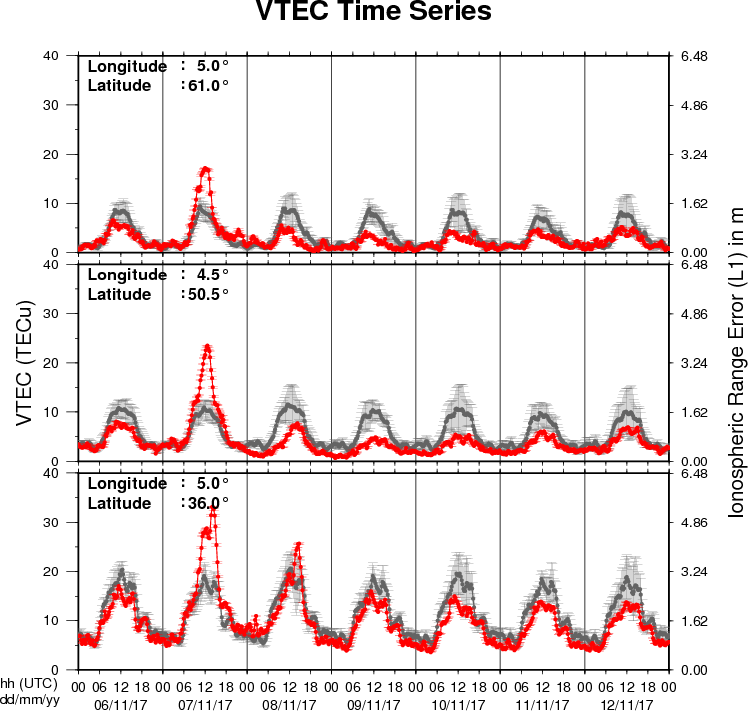
The figure shows the time evolution of the Vertical Total Electron Content (VTEC) (in red) during the last week at three locations:
a) in the northern part of Europe(N61°, 5°E)
b) above Brussels(N50.5°, 4.5°E)
c) in the southern part of Europe(N36°, 5°E)
This figure also shows (in grey) the normal ionospheric behaviour expected based on the median VTEC from the 15 previous days.
The VTEC is expressed in TECu (with TECu=10^16 electrons per square meter) and is directly related to the signal propagation delay due to the ionosphere (in figure: delay on GPS L1 frequency).
The Sun's radiation ionizes the Earth's upper atmosphere, the ionosphere, located from about 60km to 1000km above the Earth's surface.The ionization process in the ionosphere produces ions and free electrons. These electrons perturb the propagation of the GNSS (Global Navigation Satellite System) signals by inducing a so-called ionospheric delay.
See http://stce.be/newsletter/GNSS_final.pdf for some more explanations ; for detailed information, see http://gnss.be/ionosphere_tutorial.php