- Table of Content
- 1.It's coming ne...
- 2.PROBA2 Observa...
- 3.Review of sola...
- 4.Review of geom...
- 5.The SIDC Space...
- 6.The Internatio...
- 7.Geomagnetic Ob...
- 8.Review of iono...
2. PROBA2 Observations (13 Nov 2017 - 19 Nov 2017)
3. Review of solar activity
4. Review of geomagnetic activity
5. The SIDC Space weather Briefing
6. The International Sunspot Number
7. Geomagnetic Observations at Dourbes (13 Nov 2017 - 19 Nov 2017)
8. Review of ionospheric activity (13 Nov 2017 - 19 Nov 2017)
It's coming nearer and nearer and ...
The 14th European Space Weather Week
With sessions, posters, orals, topical discussion meetings, keynotes, business meetings, fair, round table, coffee, ringing sunspots, medals, planeterrella-demo, tutorial, exhibition, music after work, poster presenters' corner, live space weather forecast, free podium, CubeSats, CME canon, ...
The 14th Week of Space Weather Fun!
November 27 - December 1, 2017
Kursaal, Ostend, Belgium
website: http://www.stce.be/esww14/index.php
Full movie: http://www.stce.be/esww14/images/ESWW14.mp4
PROBA2 Observations (13 Nov 2017 - 19 Nov 2017)
Solar Activity
Solar flare activity remained very low during the week.
In order to view the activity of this week in more detail, we suggest to go to the following website from which all the daily (normal and difference) movies can be accessed: http://proba2.oma.be/ssa
This page also lists the recorded flaring events.
A weekly overview movie can be found here (SWAP week 399): http://proba2.oma.be/swap/data/mpg/movies/weekly_movies/weekly_movie_2017_11_13.mp4
Details about some of this week's events, can be found further below.
If any of the linked movies are unavailable they can be found in the P2SC movie repository here: http://proba2.oma.be/swap/data/mpg/movies/
Monday Nov 13
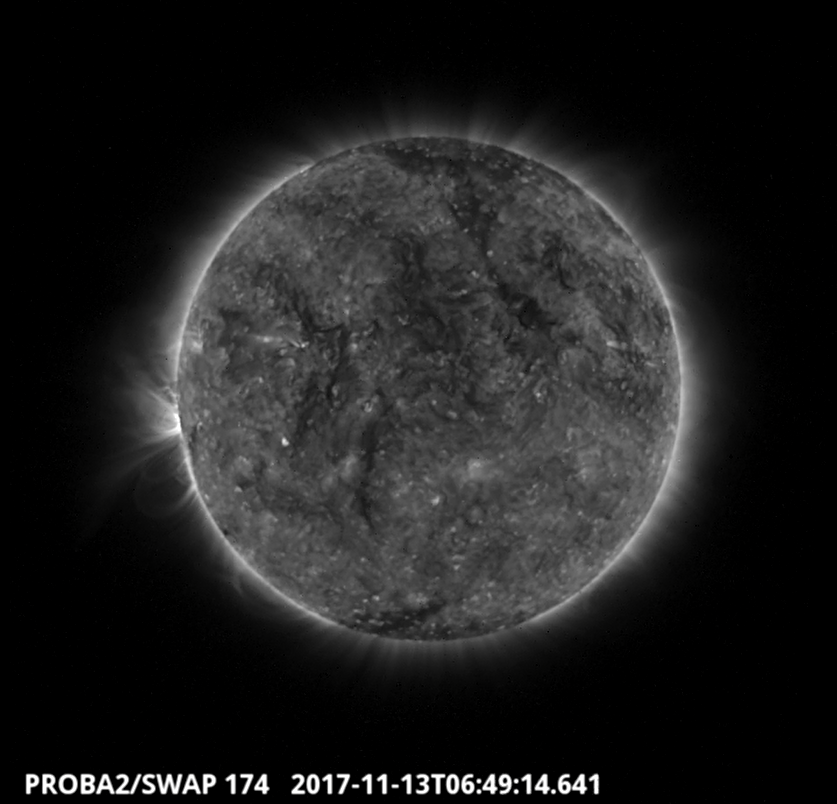
The largest flare of the week was a B-class (B7.5) flare and was observed by SWAP on 2017-Nov-13. The flare is visible on the eastern limb of the Sun in the SWAP image above at 06:49 UT.
Find a movie of the event here (SWAP movie): http://proba2.oma.be/swap/movies/20171113_swap_movie.mp4
Tuesday Nov 14
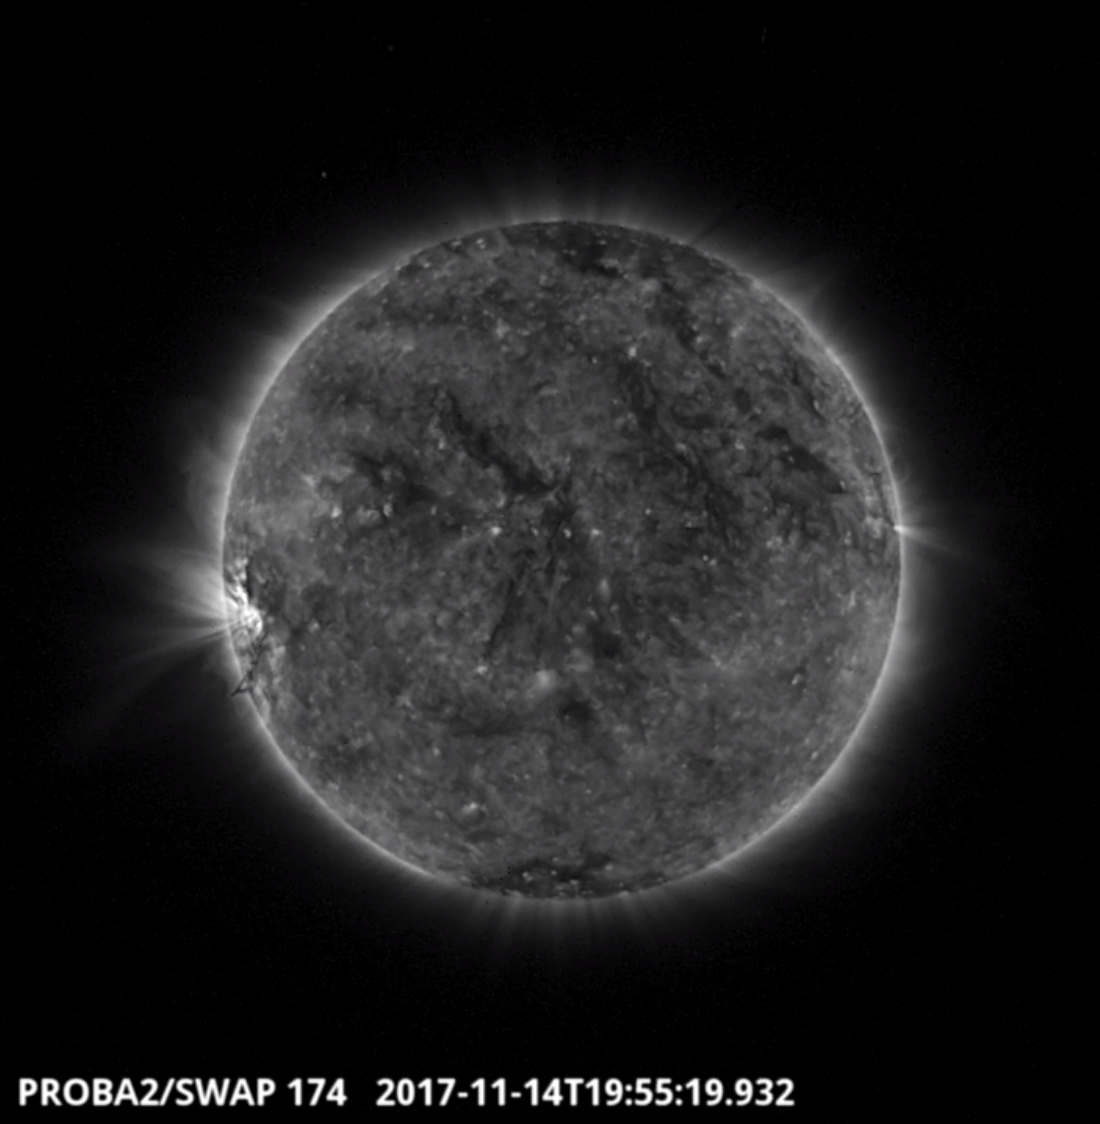
A dark filament is also observed by SWAP on the eastern limb of the Sun on 2017-Nov-14 as shown in the image above at 19:55 UT.
Find a movie of the event here (SWAP movie): http://proba2.oma.be/swap/movies/20171114_swap_movie.mp4
Friday Nov 17
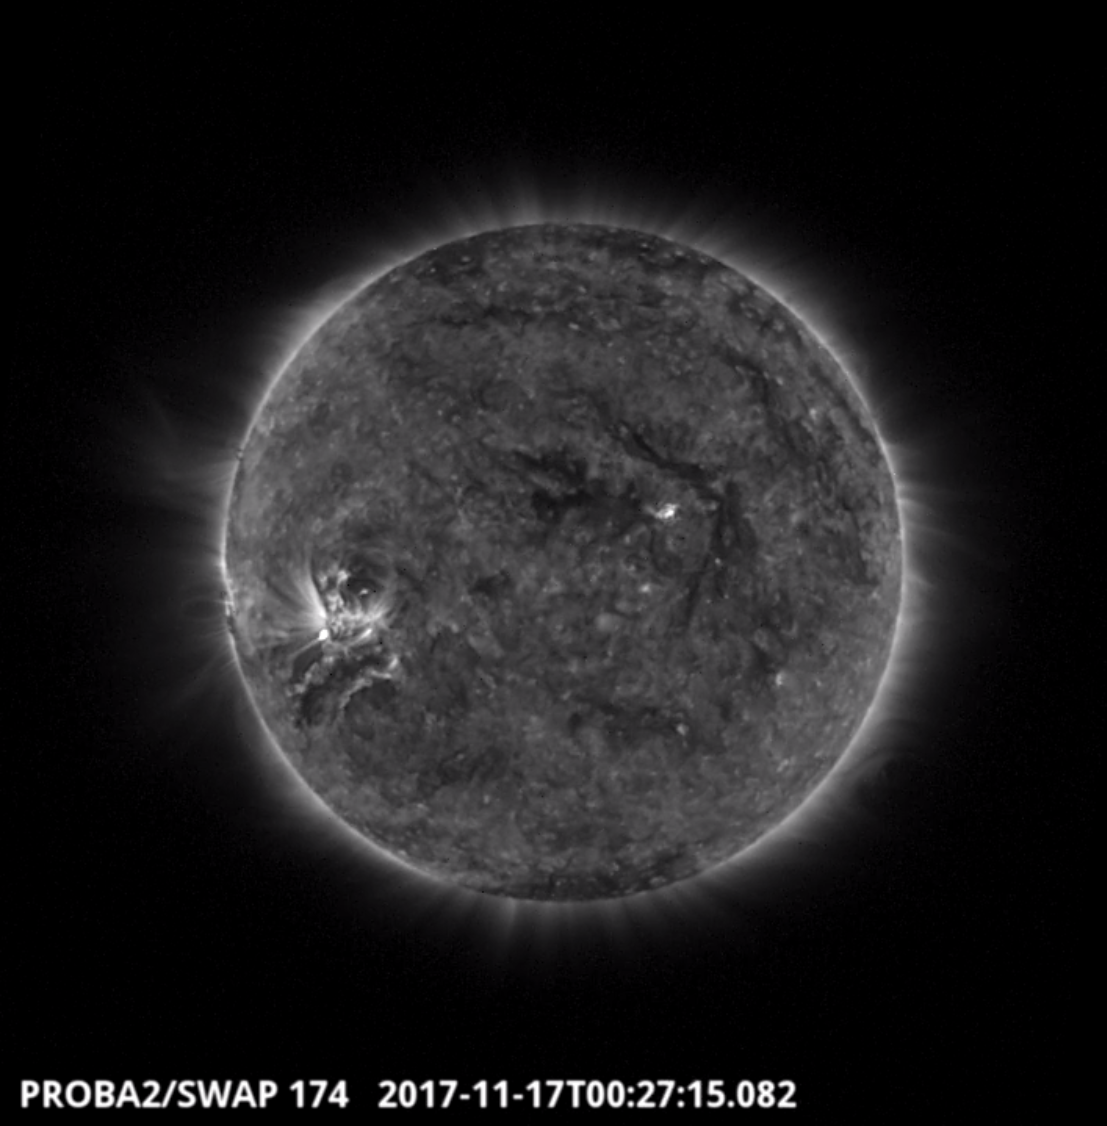
The second largest flare of the week was a B-class (B6.2) flare and was observed by SWAP on 2017-Nov-17. The flare is visible in the south-eastern quadrant of the solar disk in the SWAP image above at 00:27 UT.
Find a movie of the event here (SWAP movie): http://proba2.oma.be/swap/movies/20171117_swap_movie.mp4
Review of solar activity
Electromagnetic flux: flares
Solar flaring activity was very low: only eight B-class flares and no C-class flares reported. There were two sunspot groups observed on the visible side of the solar disc, Catania sunspot group 63 (NOAA AR 2687) and group 64 (NOAA AR 2688). The photospheric magnetic field configuration of the two sunspot groups was simple and labelled as beta or alpha.
Solar Wind: Coronal Mass Ejections
There was no wide or Earth-directed CMEs observed this week.
Solar Wind: 3 coronal holes
Three coronal holes were present on the side of the solar disk facing the earth.
A northern polar coronal hole (30 degrees wide) with a low latitude extension reached the central meridian on November 11.
A second polar coronal hole with an extension to low latitudes was located in the Southern Hemisphere. It reached the central meridian in the evening of November 13.
The third equatorial coronal hole reached the central meridian in the early morning of November 16.
Proton flux
The solar protons remained at background level during the whole week.
Review of geomagnetic activity
November 14, 00:48 UT, DSCOVR satellite measured a sudden increase of the interplanetary magnetic field magnitude, density, temperature and the solar wind speed. This indicated the arrival of the shock wave probably associated with the large filament located in the north-east quadrant of the Sun and erupted on November 10. The shock did not cause any disturbances in the geomagnetic field. The local station at Dourbes reported K = 3 and NOAA reported Kp = 3.
The fast solar wind (top speed of 520 km/s) flowing from the low-latitude part of the northern polar coronal hole (at the central meridian on November 10, see section 'review of solar activity') arrived at Earth in the second part of November 15. The solar wind disturbed the geomagnetic field as soon as it arrived on November 15 and on the first half of November 16. Dourbes reported several 3h intervals of K=4 and NOAA several 3h intervals of Kp=4.
On November 18, the solar wind speed dropped below 400 km/s.
The fast solar wind associated with the southern polar coronal hole (at the central meridian on November 13, see section 'review of solar activity') did not arrive at Earth.
The SIDC Space weather Briefing
The Space Weather Briefing presented by the forecaster on duty for the period from November 12 to 19. It reflects in images and graphs what is written in the Solar and Geomagnetic Activity report.
The pdf version: http://www.stce.be/briefings/SIDCbriefing-20171120.pdf
The International Sunspot Number
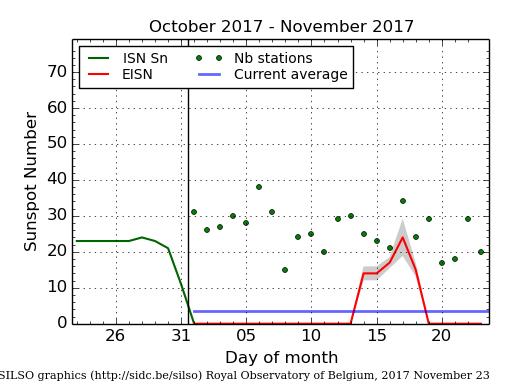
The daily Estimated International Sunspot Number (EISN, red curve with shaded error) derived by a simplified method from real-time data from the worldwide SILSO network. It extends the official Sunspot Number from the full processing of the preceding month (green line). The plot shows the last 30 days (about one solar rotation). The horizontal blue line shows the current monthly average, while the green dots give the number of stations included in the calculation of the EISN for each day.
Geomagnetic Observations at Dourbes (13 Nov 2017 - 19 Nov 2017)

Review of ionospheric activity (13 Nov 2017 - 19 Nov 2017)

The figure shows the time evolution of the Vertical Total Electron Content (VTEC) (in red) during the last week at three locations:
a) in the northern part of Europe(N61°, 5°E)
b) above Brussels(N50.5°, 4.5°E)
c) in the southern part of Europe(N36°, 5°E)
This figure also shows (in grey) the normal ionospheric behaviour expected based on the median VTEC from the 15 previous days.
The VTEC is expressed in TECu (with TECu=10^16 electrons per square meter) and is directly related to the signal propagation delay due to the ionosphere (in figure: delay on GPS L1 frequency).
The Sun's radiation ionizes the Earth's upper atmosphere, the ionosphere, located from about 60km to 1000km above the Earth's surface.The ionization process in the ionosphere produces ions and free electrons. These electrons perturb the propagation of the GNSS (Global Navigation Satellite System) signals by inducing a so-called ionospheric delay.
See http://stce.be/newsletter/GNSS_final.pdf for some more explanations ; for detailed information, see http://gnss.be/ionosphere_tutorial.php