- Table of Content
- 1.Esww14 almost ...
- 2.Review of sola...
- 3.Review of geom...
- 4.The Internatio...
- 5.Geomagnetic Ob...
- 6.Review of iono...
2. Review of solar activity
3. Review of geomagnetic activity
4. The International Sunspot Number
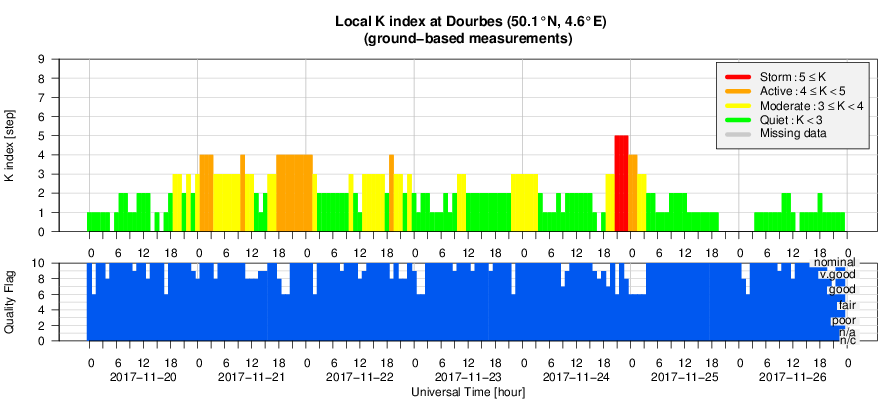
5. Geomagnetic Observations at Dourbes (20 Nov 2017 - 26 Nov 2017)
6. Review of ionospheric activity (20 Nov 2017 - 26 Nov 2017)
Esww14 almost finished - Esww15 preparations started
The fourteenth European Space Weather Week is about to finish.
The ESWW is one of the main international conferences when it comes to space weather. This ESWW was co-located with the 9th CubeSat Workshop.
It was definitely a success. Almost 500 scientists, engineers, satellite operators, power grid technicians, communication specialists,... from all over the world came to Oostende to discuss space weather and CubeSats.
We are already looking forward to the next edition that will be organised from November 5 to 9 in Leuven, Belgium.

Review of solar activity
Over the past week solar activity has been quiet. No significant flares have been recorded.
The graph below shows the X-ray flux over the week. You can see that not much happened, only a few B-flares.
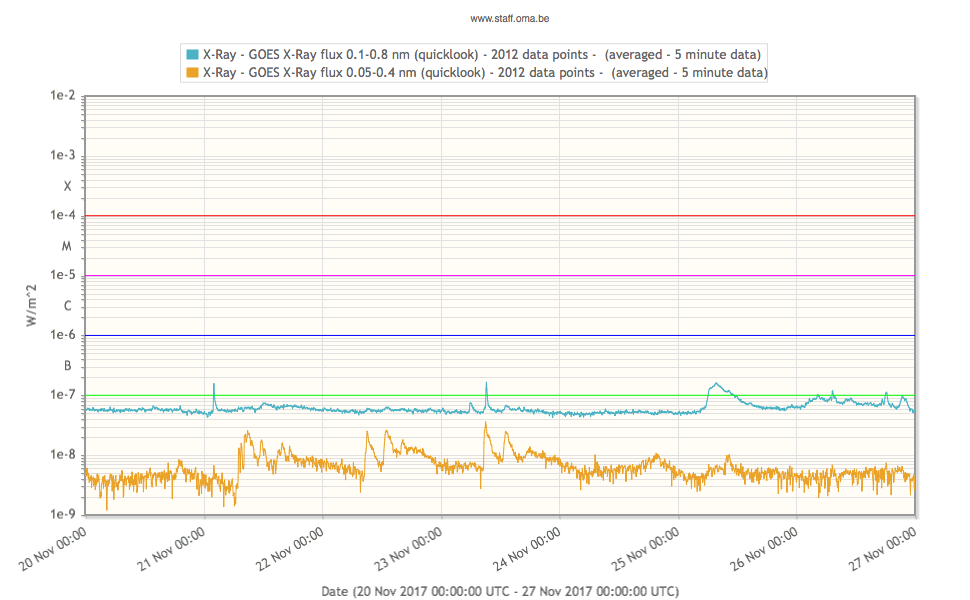
All active regions (AR) have shown low levels of activity.
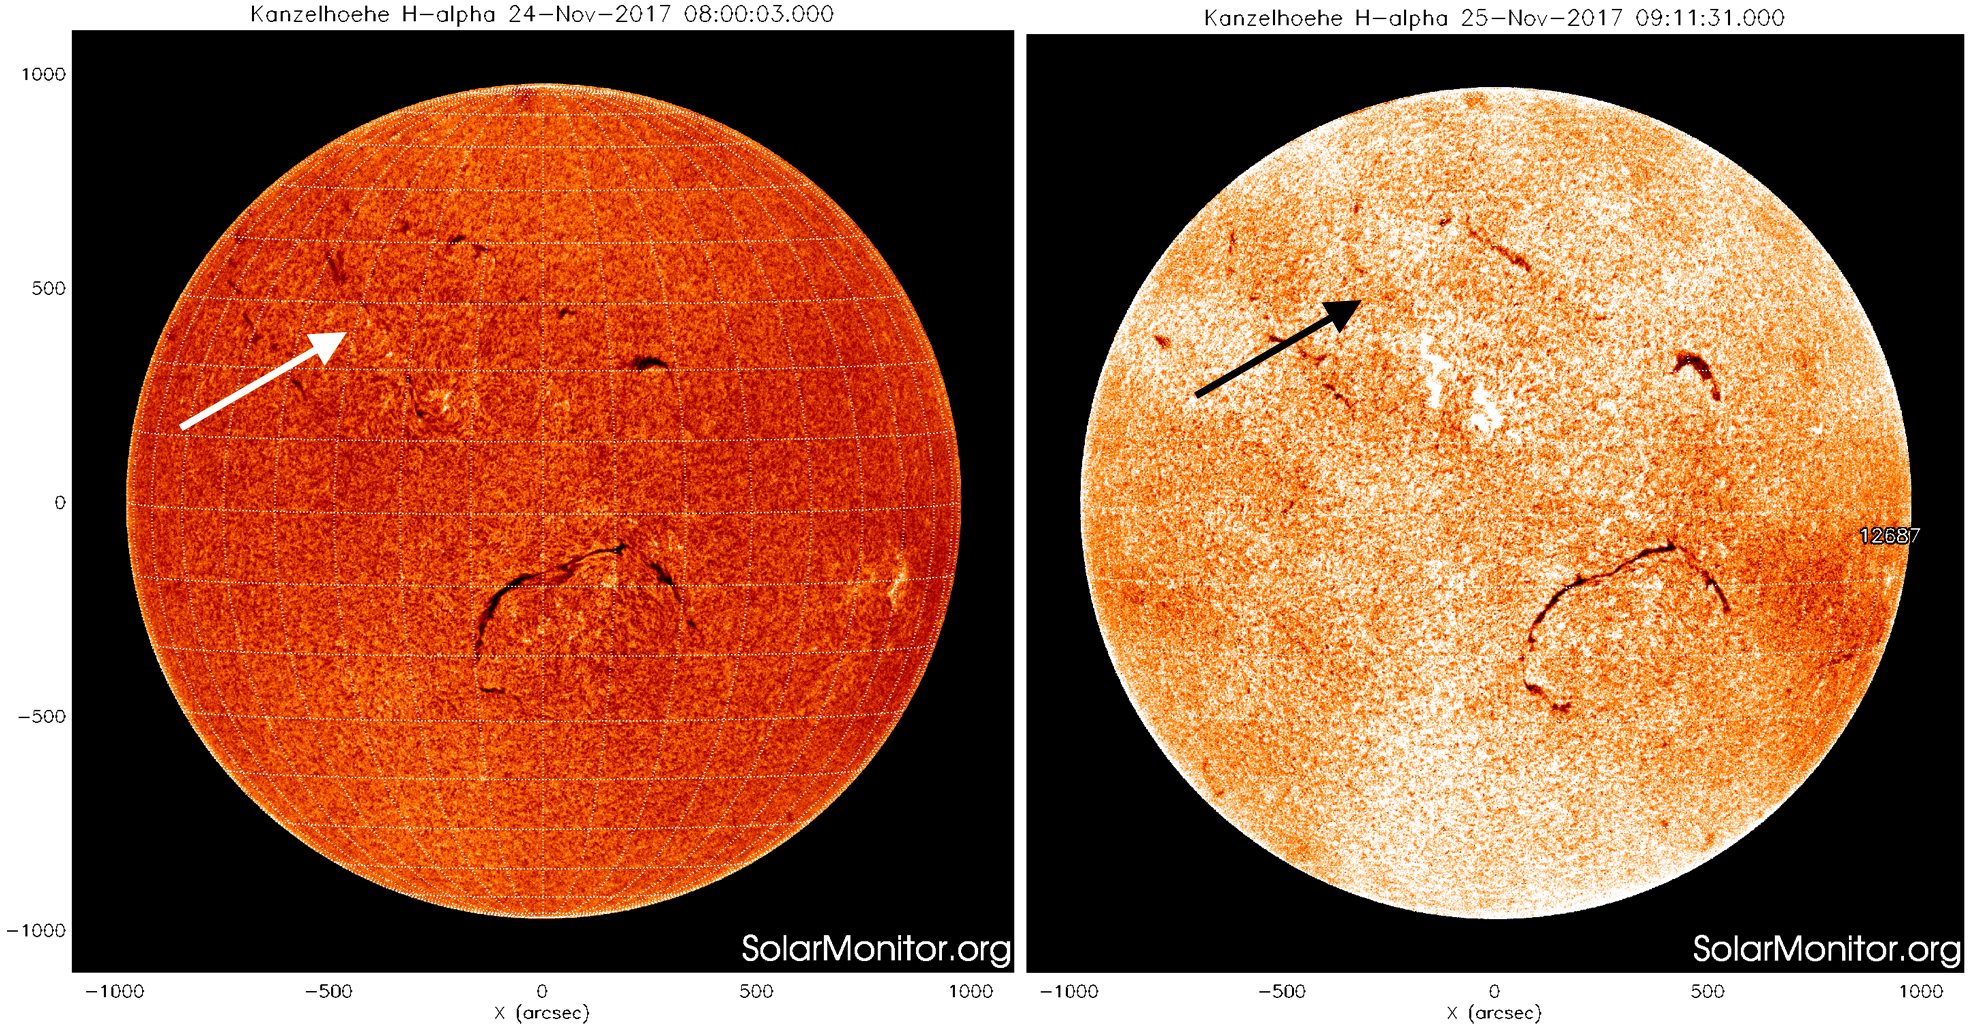
A small filament eruption occurred near disk centre at around 04:00 UT on 2017-Nov-25. Coronagraph imagery suggested the bulk of the ejection headed to the East of the Sun-Earth line and only a glancing blow, if any, can be expected at Earth. Projection effects make it difficult to a s certain an accurate speed.
This is the Sun in H-alpha (red part of the visible spectrum) from Kanzelhoehe observatory, Austria. You can see that part of the filament has disappeared in the right picture.
No other Earth directed CMEs were detected.
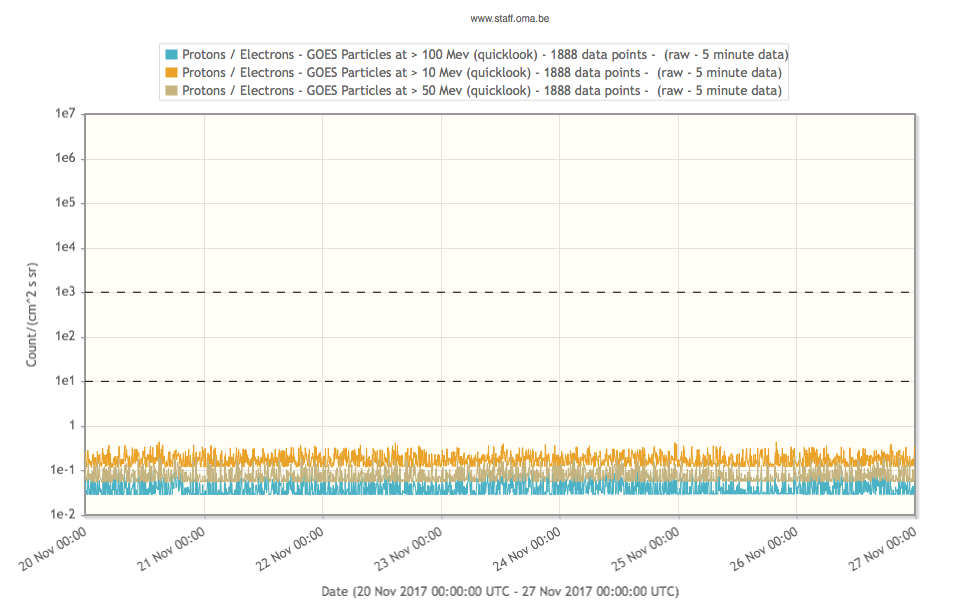
The greater than 10MeV proton flux remained at background levels over the past week.
Review of geomagnetic activity
Solar wind
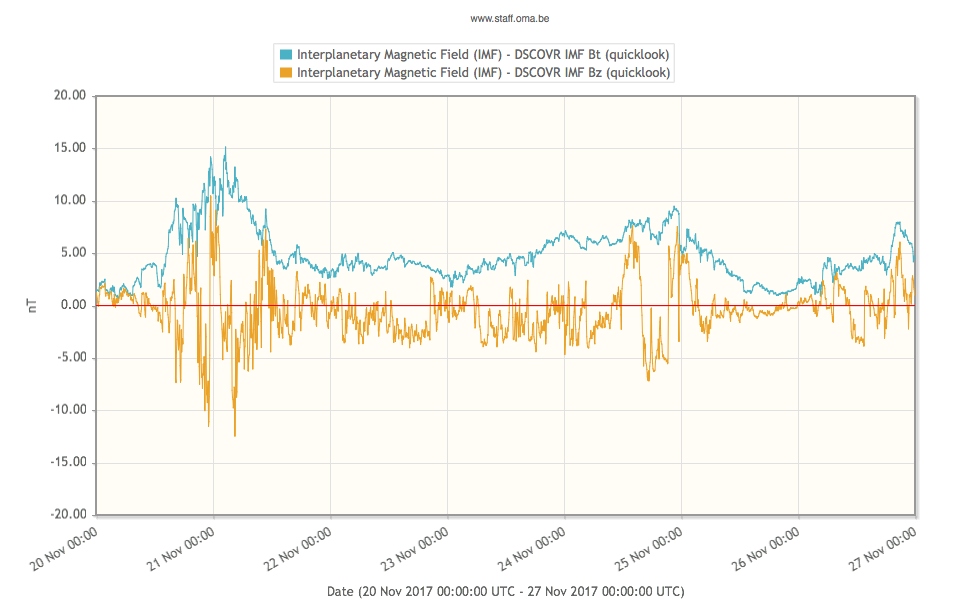
The solar wind speed has fluctuated between 300 to 650 km/s, the total magnetic field strength between 3 and 14 n, the Bz component -13 and +14 nT.
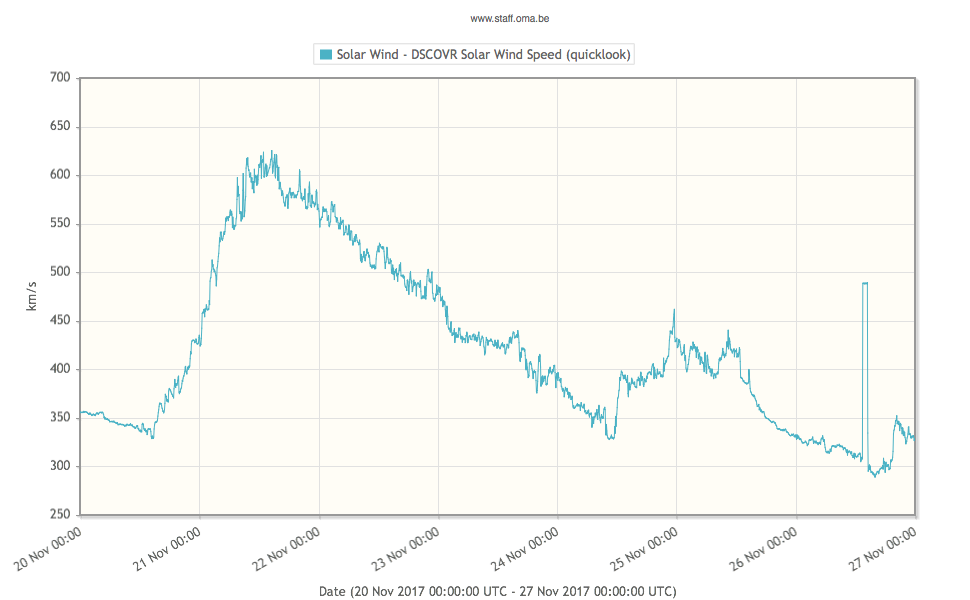
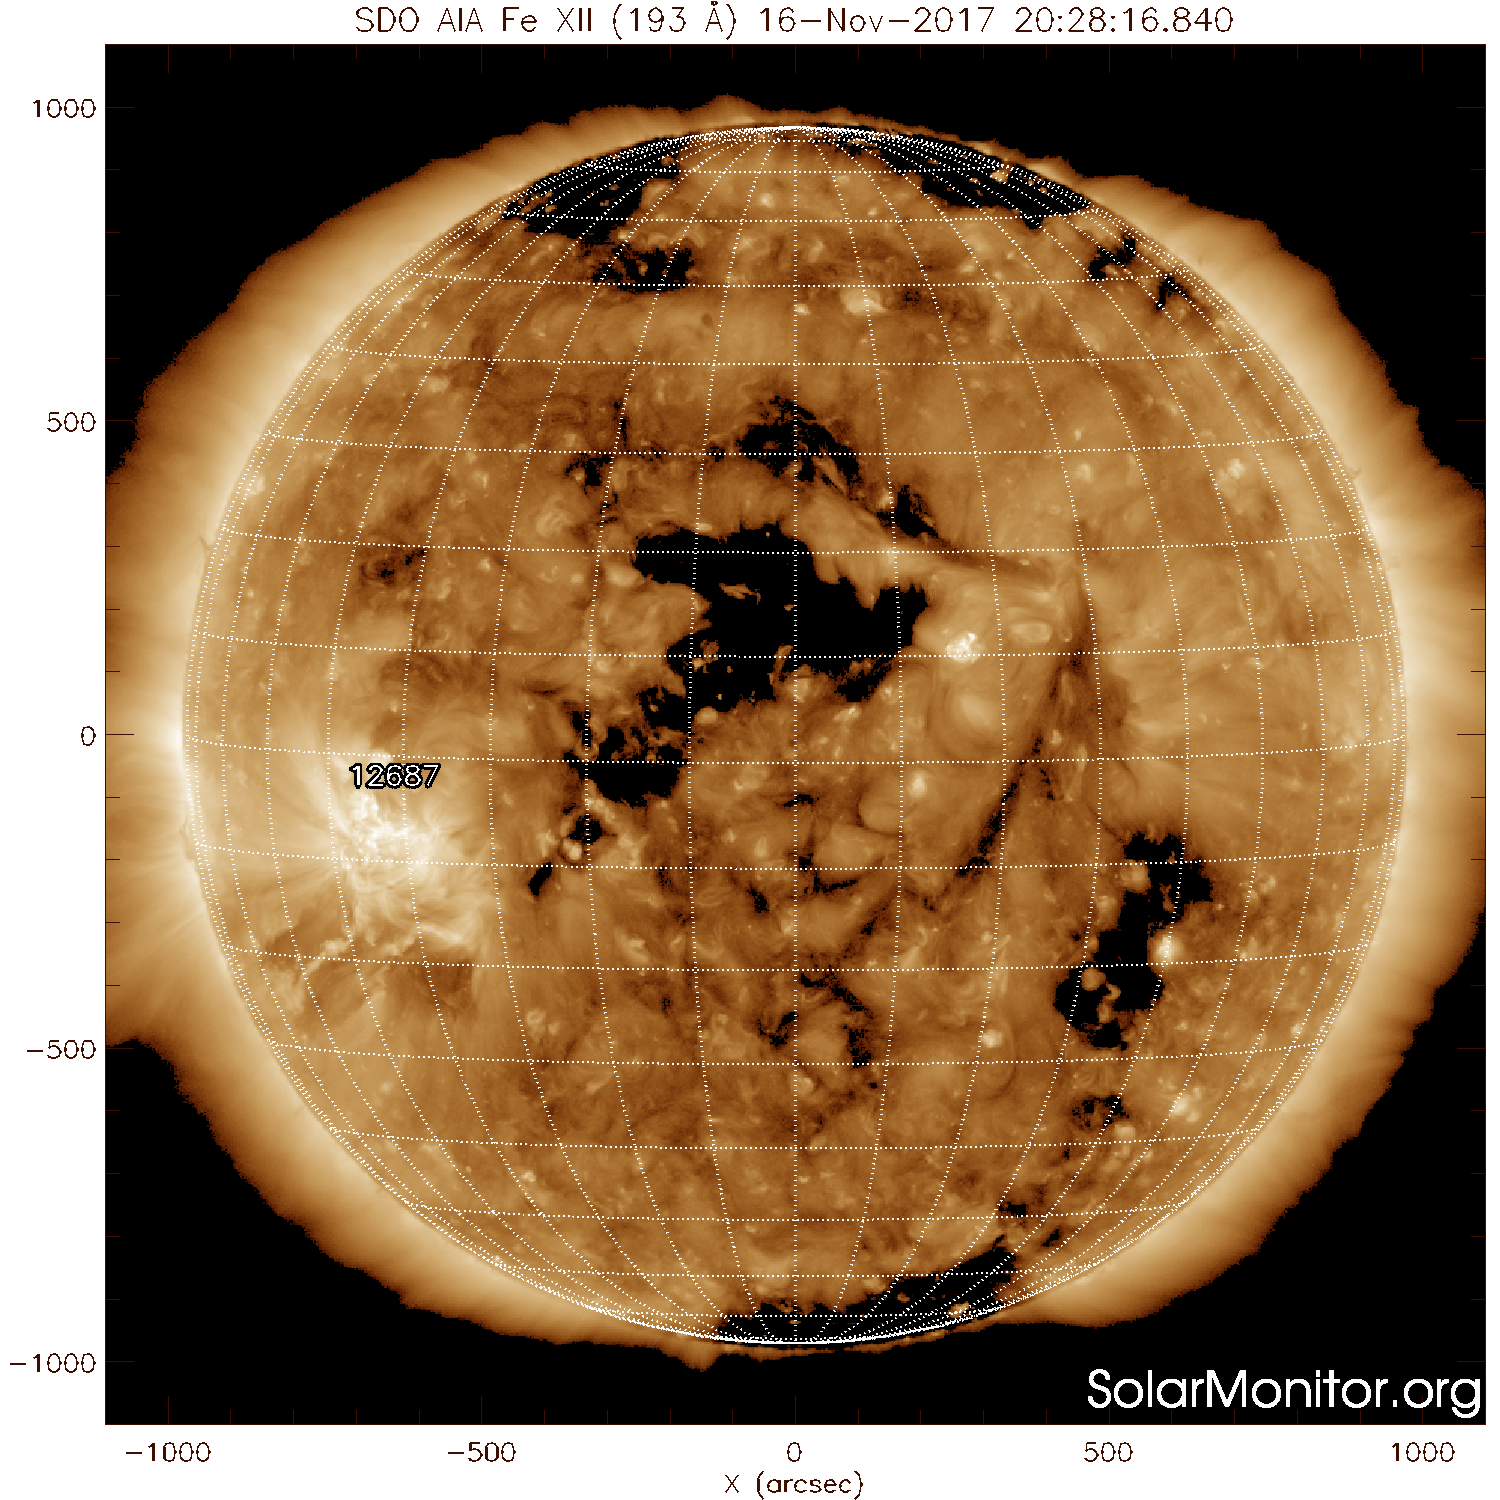
The speed of the solar wind increased on November 21 to values above 600 km/s. This was the fast wind emanating from the coronal hole that reached the central meridian on November 16. You can see this coronal hole in the SDO/AIA image below.
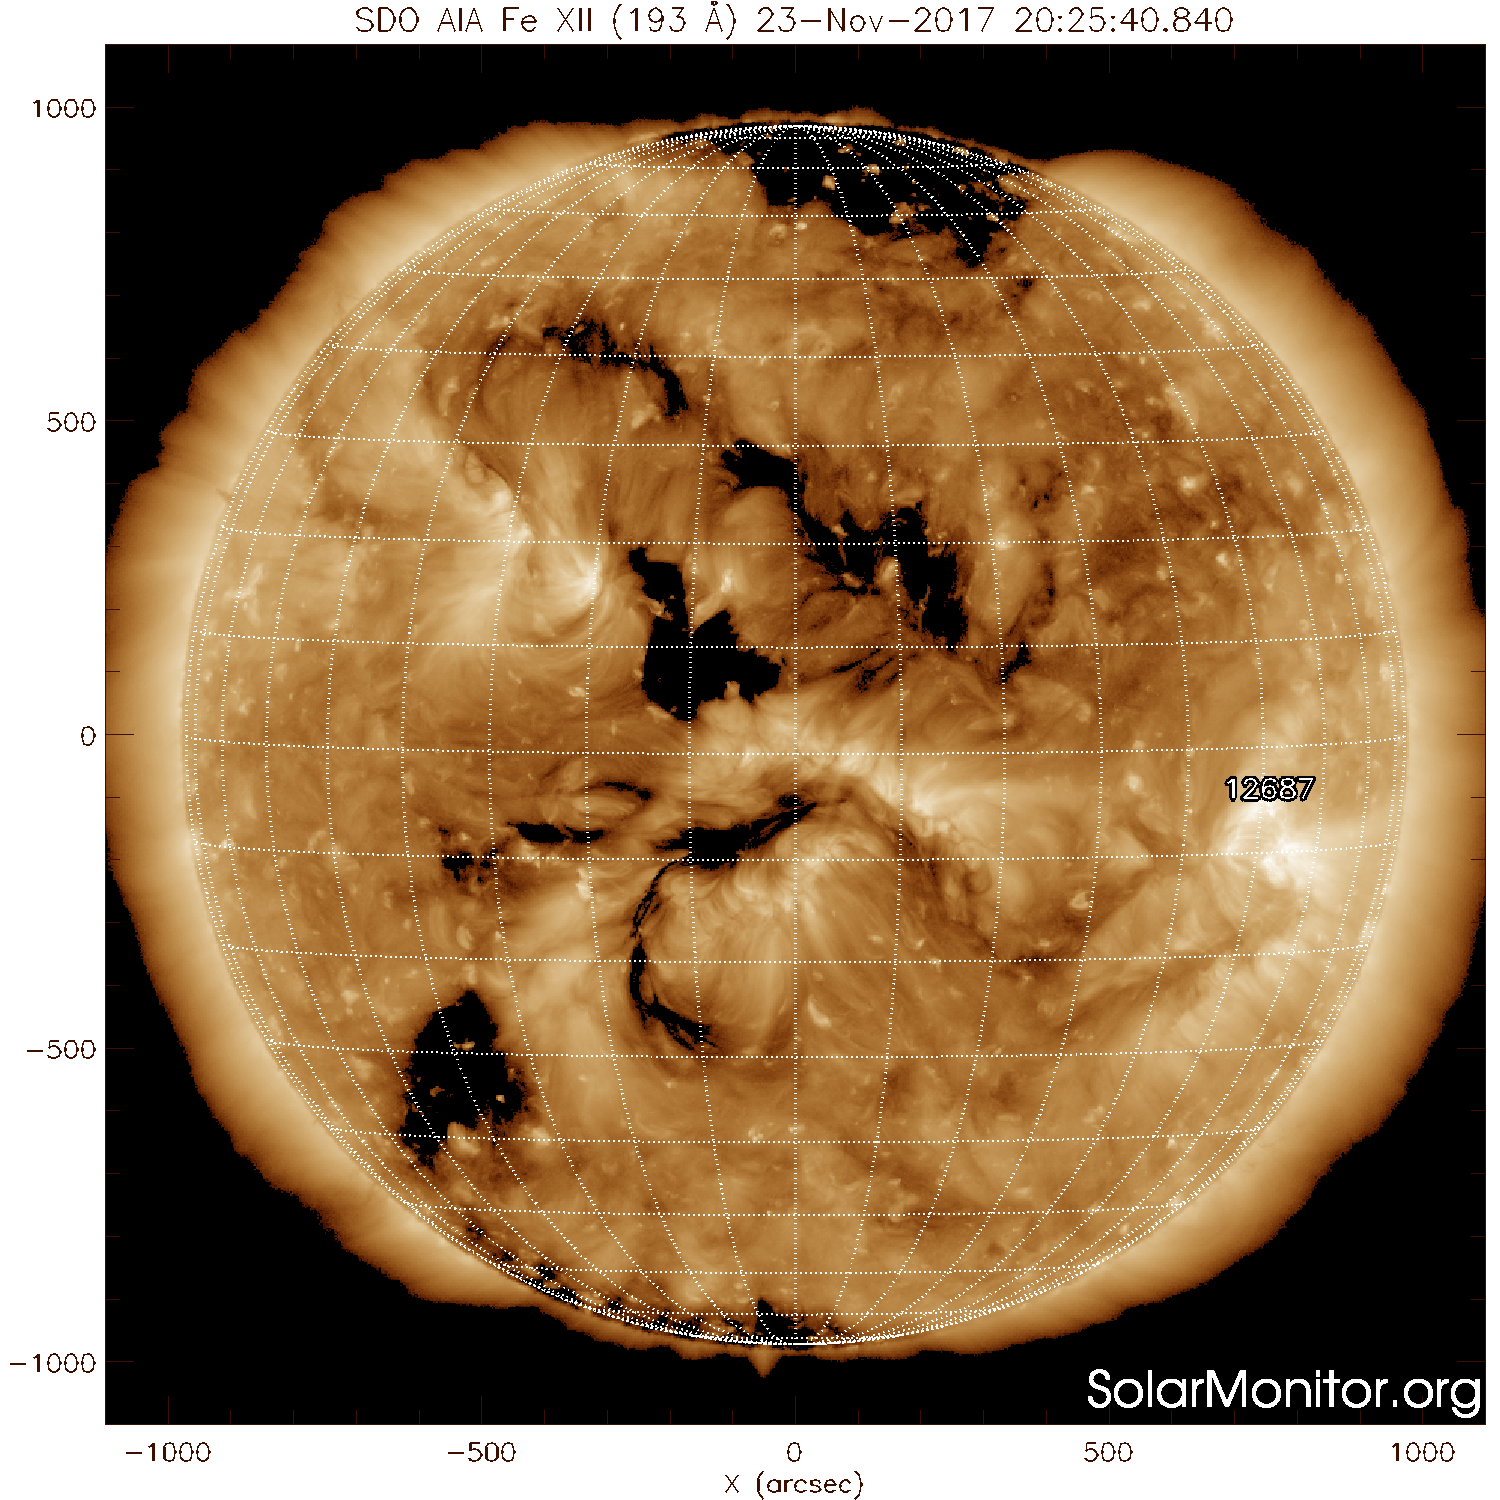
The second bump in the solar wind speed graph was linked with the small coronal holes at central latitudes in the SDO/AIA image below.
Geomagnetic conditions
Due to the interaction between the slow and fast solar wind associated with the coronal hole that was at the central meridian on November 16, the geomagnetic field was disturbed on November 21. NOAA reported 2 3h intervals of Kp=5, Dourbes reported 3 3h intervals of K=4.
For the last 3h interval on November 24, Dourbes reported K=5. For the first 3h interval on November 25, NOAA reported Kp=4. This was due to the second solar wind speed bump.
The International Sunspot Number
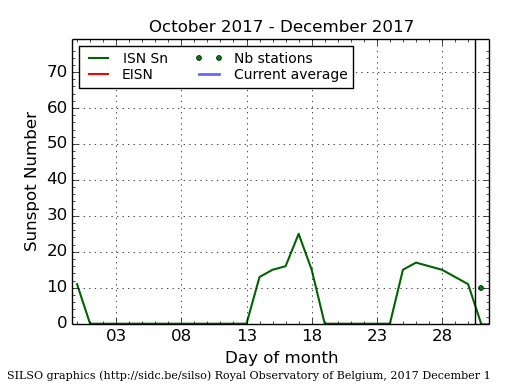
The daily Estimated International Sunspot Number (EISN, red curve with shaded error) derived by a simplified method from real-time data from the worldwide SILSO network. It extends the official Sunspot Number from the full processing of the preceding month (green line). The plot shows the last 30 days (about one solar rotation). The horizontal blue line shows the current monthly average, while the green dots give the number of stations included in the calculation of the EISN for each day.
Geomagnetic Observations at Dourbes (20 Nov 2017 - 26 Nov 2017)
Review of ionospheric activity (20 Nov 2017 - 26 Nov 2017)
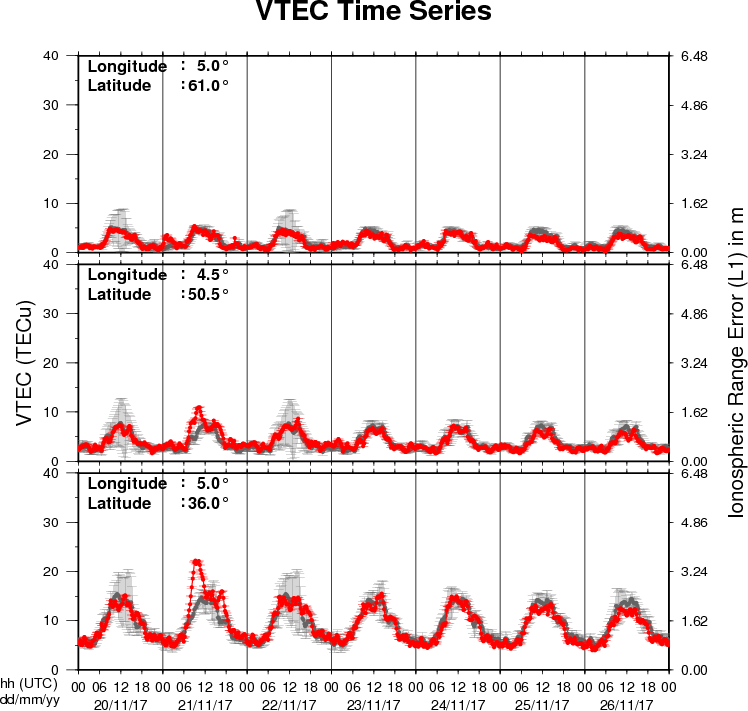
The figure shows the time evolution of the Vertical Total Electron Content (VTEC) (in red) during the last week at three locations:
a) in the northern part of Europe(N61°, 5°E)
b) above Brussels(N50.5°, 4.5°E)
c) in the southern part of Europe(N36°, 5°E)
This figure also shows (in grey) the normal ionospheric behaviour expected based on the median VTEC from the 15 previous days.
The VTEC is expressed in TECu (with TECu=10^16 electrons per square meter) and is directly related to the signal propagation delay due to the ionosphere (in figure: delay on GPS L1 frequency).
The Sun's radiation ionizes the Earth's upper atmosphere, the ionosphere, located from about 60km to 1000km above the Earth's surface.The ionization process in the ionosphere produces ions and free electrons. These electrons perturb the propagation of the GNSS (Global Navigation Satellite System) signals by inducing a so-called ionospheric delay.
See http://stce.be/newsletter/GNSS_final.pdf for some more explanations ; for detailed information, see http://gnss.be/ionosphere_tutorial.php