- Table of Content
- 1.esww14 picture...
- 2.PROBA2 Observa...
- 3.Review of sola...
- 4.The SIDC Space...
- 5.The Internatio...
- 6.Geomagnetic Ob...
- 7.Review of iono...
2. PROBA2 Observations (4 Dec 2017 - 10 Dec 2017)
3. Review of solar and geomagnetic activity
4. The SIDC Space weather Briefing
5. The International Sunspot Number
6. Geomagnetic Observations at Dourbes (4 Dec 2017 - 10 Dec 2017)
7. Review of ionospheric activity (4 Dec 2017 - 10 Dec 2017)
esww14 pictures are online
ESWW14 is now behind us. We can look back on a successful edition that certainly will have implications on the future of space weather. This is thanks to the efforts of the PC, the session conveners, the TDM conveners, the organizers of business meetings, sponsor, participants, the LOC, … You could feel the positive vibe the whole week.
Snif once more the atmosphere: http://www.stce.be/esww14/photos/photos.php
and figure out what this picture is:
PROBA2 Observations (4 Dec 2017 - 10 Dec 2017)
Solar Activity
Solar flare activity remained very low during the week.
In order to view the activity of this week in more detail, we suggest to go to the following website from which all the daily (normal and difference) movies can be accessed: http://proba2.oma.be/ssa
This page also lists the recorded flaring events.
A weekly overview movie can be found here (SWAP week 402): http://proba2.oma.be/swap/data/mpg/movies/weekly_movies/weekly_movie_2017_12_04.mp4
Details about some of this week's events, can be found further below.
If any of the linked movies are unavailable they can be found in the P2SC movie repository here: http://proba2.oma.be/swap/data/mpg/movies/
Thursday Dec 07
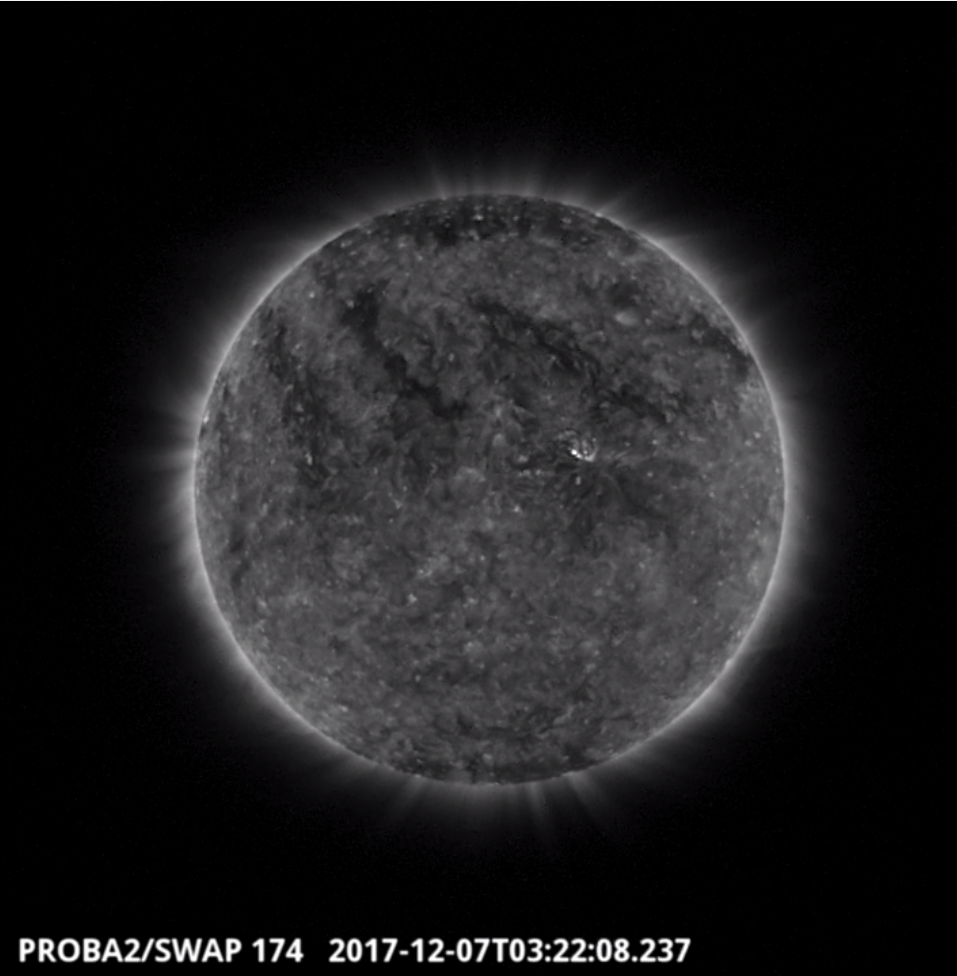
The first flare of the week was a B-class (B1.0) flare and was observed by SWAP on 2017-Dec-07. The flare is visible near the centre of the solar disk in the SWAP image above at 03:22 UT.
Find a movie of the event here (SWAP movie): http://proba2.oma.be/swap/movies/20171207_swap_movie.mp4
Review of solar and geomagnetic activity
SOLAR ACTIVITY
Solar activity was low. No C-class flares or stronger have been recorded. Catania sunspot group 65 (NOAA Active Region 2690) emerged on Dec 6 and rapidly decayed on Dec 8. NOAA Active Region 2691 emerged on Dec 10 and produced a B1.5-Class flare on Dec 10 at 10:54 UT.
No Earth directed Coronal Mass Ejection has been observed.
The solar protons measured by the geostationary satellite GOES remained at background levels.
GEOMAGNETIC ACTIVITY
A high speed stream associated with an extension of a polar coronal hole in the northern hemisphere disturbed the geomagnetic field. The extension of the coronal hole passed the central meridian on Dec 01.
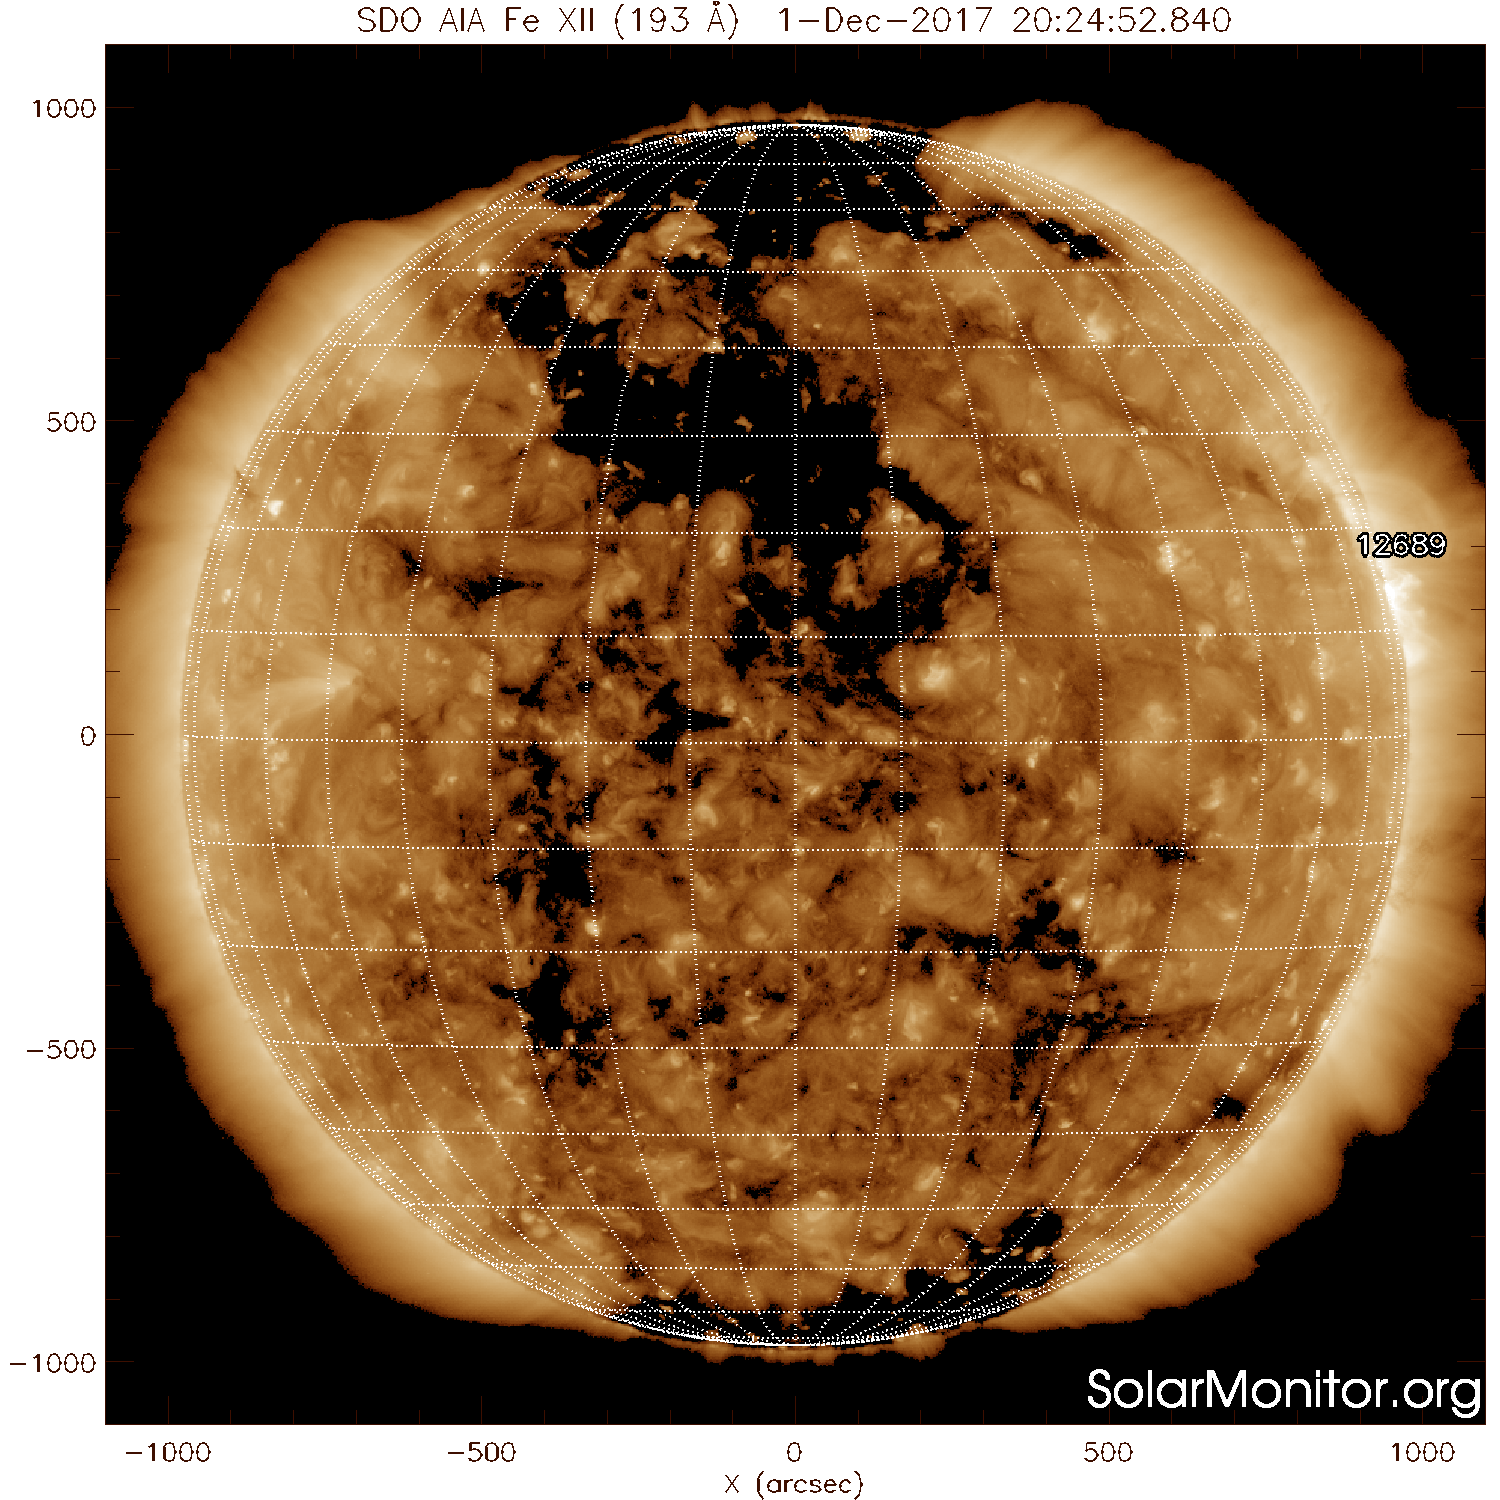
What was measured at the L1 point?
The solar wind measured at L1 speeded up and reached a maximum speed of 630 km/s on Dec 6. This is the fast solar wind that emanated from the part of the coronal hole at the central meridian (see the SDO/AIA picture) and reached a few days later the L1 point.
Preceding this fast part, on Dec 5, the solar wind carried a magnetic field with a strength (B_total) fluctuating between 7 and 12nT. More important, the Bz component of the magnetic field was negative and dropped even to -12nT. Note that the B_total and Bz mentioned here are also measured at the L1 point. The period marked by a more dense magnetic field is associated with the co-rotating interaction region of the coronal hole.
From Dec 9 onwards, the speed at L1 dropped below 400 km/s.
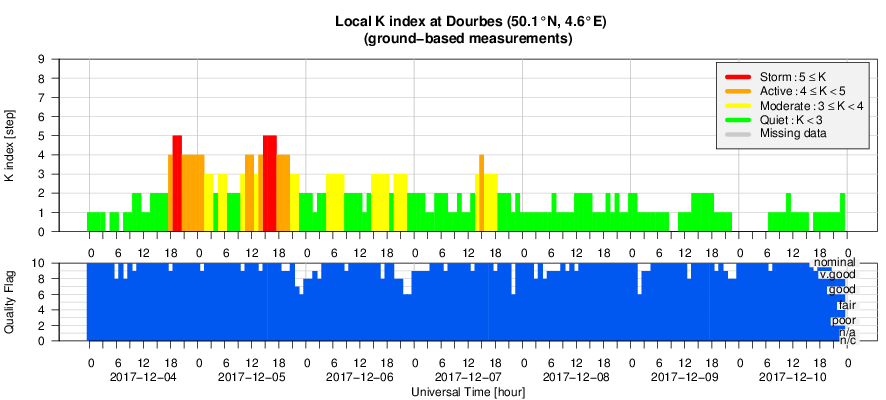
Due to the fast solar wind emanating from the coronal hole and the preceding co-rotating interaction region, the geomagnetic field was disturbed. The station at Dourbes reported 5 1hour-periods with K_Dourbes = 5 on Dec 4 and 5. NOAA reported 2 3hour-periods with Kp=5 on Dec 5. A K that equals 5 is labeled as a minor storm.
The SIDC Space weather Briefing
The Space Weather Briefing presented by the forecaster on duty from December 4 to 10. It reflects in images and graphs what is written in the Solar and Geomagnetic Activity report.
Movie of the active regions transitioning the solar disk: http://www.stce.be/briefings/20171211_JHV.mp4
Pdf version: http://www.stce.be/briefings/SIDCbriefing-20171211.pdf
The International Sunspot Number
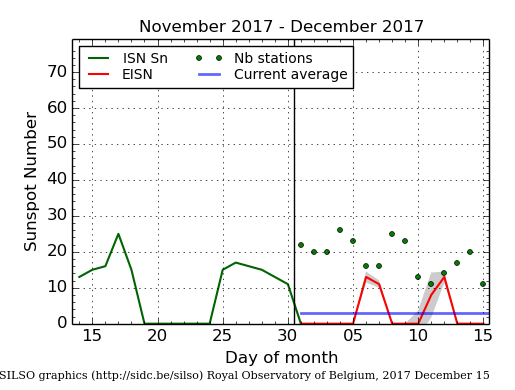
The daily Estimated International Sunspot Number (EISN, red curve with shaded error) derived by a simplified method from real-time data from the worldwide SILSO network. It extends the official Sunspot Number from the full processing of the preceding month (green line). The plot shows the last 30 days (about one solar rotation). The horizontal blue line shows the current monthly average, while the green dots give the number of stations included in the calculation of the EISN for each day.
Geomagnetic Observations at Dourbes (4 Dec 2017 - 10 Dec 2017)
Review of ionospheric activity (4 Dec 2017 - 10 Dec 2017)
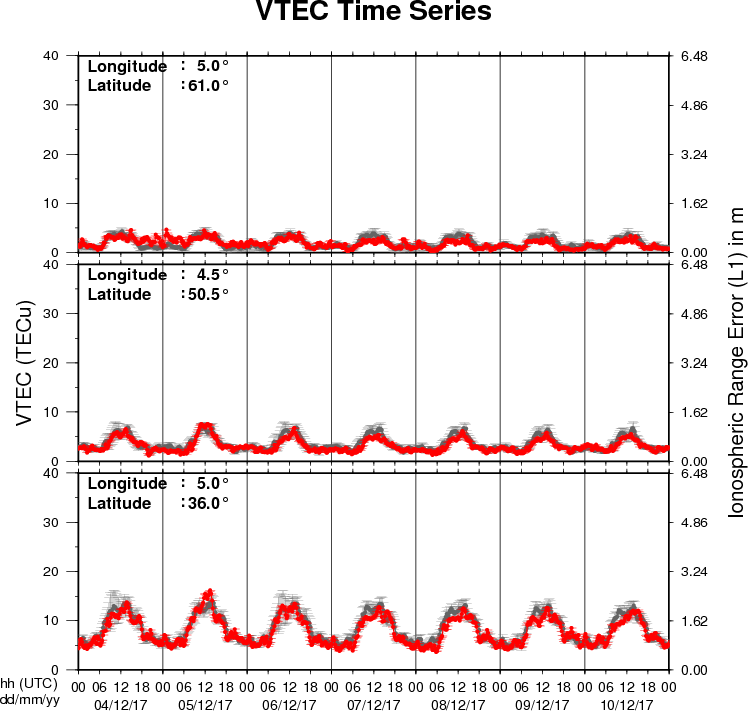
The figure shows the time evolution of the Vertical Total Electron Content (VTEC) (in red) during the last week at three locations:
a) in the northern part of Europe(N61°, 5°E)
b) above Brussels(N50.5°, 4.5°E)
c) in the southern part of Europe(N36°, 5°E)
This figure also shows (in grey) the normal ionospheric behaviour expected based on the median VTEC from the 15 previous days.
The VTEC is expressed in TECu (with TECu=10^16 electrons per square meter) and is directly related to the signal propagation delay due to the ionosphere (in figure: delay on GPS L1 frequency).
The Sun's radiation ionizes the Earth's upper atmosphere, the ionosphere, located from about 60km to 1000km above the Earth's surface.The ionization process in the ionosphere produces ions and free electrons. These electrons perturb the propagation of the GNSS (Global Navigation Satellite System) signals by inducing a so-called ionospheric delay.
See http://stce.be/newsletter/GNSS_final.pdf for some more explanations ; for detailed information, see http://gnss.be/ionosphere_tutorial.php