- Table of Content
- 1.esww5 - call f...
- 2.PROBA2 Observa...
- 3.Review of sola...
- 4.The SIDC Space...
- 5.The Internatio...
- 6.Geomagnetic Ob...
- 7.Review of iono...
- 8.Enjoy the holi...
2. PROBA2 Observations (11 Dec 2017 - 17 Dec 2017)
3. Review of solar and geomagnetic activity
4. The SIDC Space weather Briefing (11 Dec 2017 - 17 Dec 2017)
5. The International Sunspot Number
6. Geomagnetic Observations at Dourbes (11 Dec 2017 - 17 Dec 2017)
7. Review of ionospheric activity (11 Dec 2017 - 17 Dec 2017)
8. Enjoy the holidays!
esww5 - call for sessions
Dear Colleagues
Each year, during the European Space Weather Week (ESWW) conference, people from all over the world gather to discuss the newest insights in space weather and try to find appropriate answers to the challenges and threats that space weather imposes. Science, data exploitation, observations, service development, operational models, engineering, industrial challenges, etc. are all relevant and most important aspects of space weather.
One of the strengths of the conference is that the participants can contribute largely to its content. For ESWW15, we foresee sessions in 3 flavours:
* plenary sessions, one oriented towards Users and one towards Operations/Services;
* parallel Science and Research sessions;
* parallel 100% community driven or Open sessions.
Read more on the 3 flavours: http://www.stce.be/esww15/sessionflavours.php
We would like to invite and encourage you and your colleagues to submit a proposal for a session. The online submission will be opened on 16 January 2018. The deadline for submission is 2 February 2018, included.
The ESWW Programme Committee (PC) will decide which of the submitted sessions are accepted. Session conveners will be notified by mid February.
Enjoy the holidays!
Mauro Messerotti and Petra Vanlommel, on behalf of the ESWW15 PC
PROBA2 Observations (11 Dec 2017 - 17 Dec 2017)
Solar Activity
Solar flare activity was very low during the week.
In order to view the activity of this week in more detail, we suggest to go to the following website from which all the daily (normal and difference) movies can be accessed: http://proba2.oma.be/ssa
This page also lists the recorded flaring events.
A weekly overview movie can be found here (SWAP week 403).
http://proba2.oma.be/swap/data/mpg/movies/weekly_movies/weekly_movie_2017_12_11.mp4
Details about some of this week’s events, can be found further below.
If any of the linked movies are unavailable they can be found in the P2SC movie repository here
http://proba2.oma.be/swap/data/mpg/movies/
Monday Dec 11
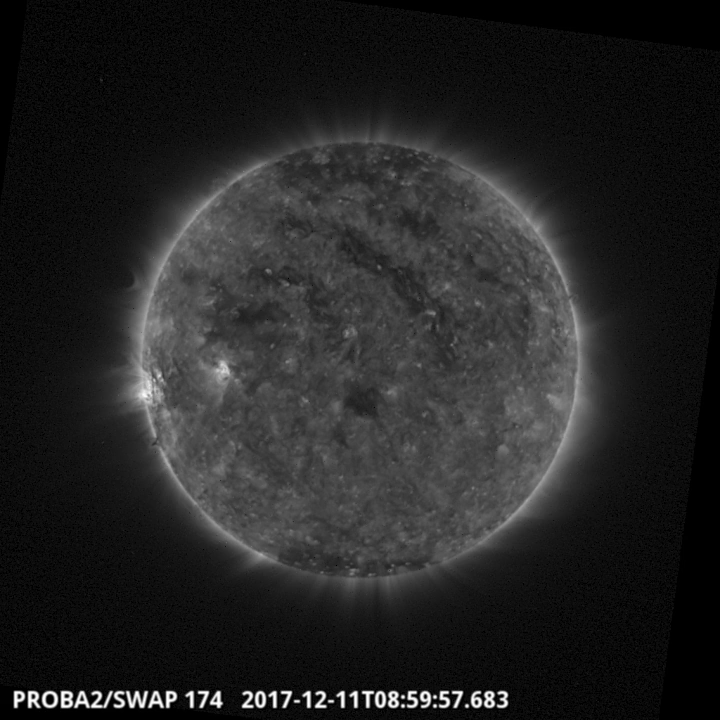
There have been two significant coronal holes visible on the solar disk throughout the week. A large positive Northern polar coronal hole and a small centrally (latitude) located hole, these are visible in the SWAP image above.
The weekly movie showing the hole can be seen here (SWAP movie)
http://proba2.oma.be/swap/data/mpg/movies/weekly_movies/weekly_movie_2017_12_11.mp4
Friday Dec 15
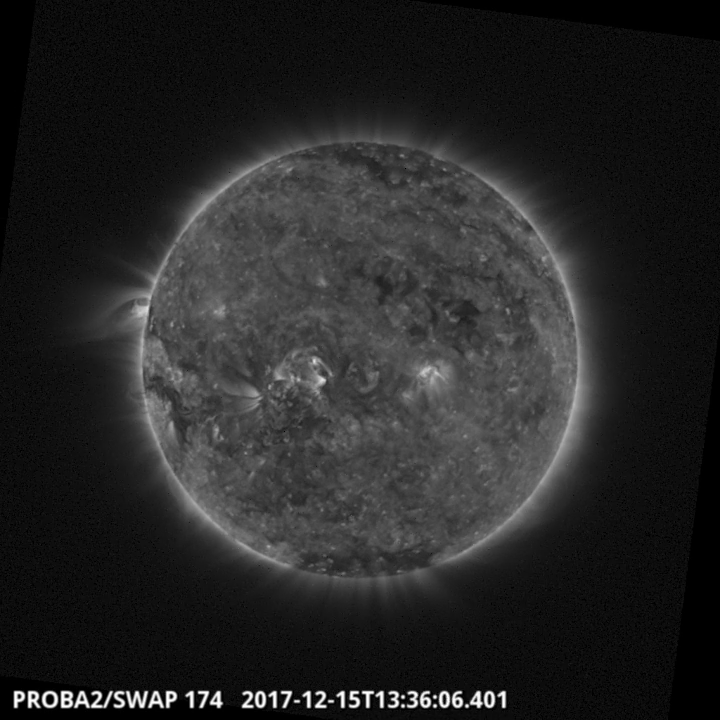
A filament erupted on 2017-12-15 around 12:00 UT from S25E40, a CME related to this event was recorded in coronagraph industry.
Find a movie of the events here (SWAP movie)
http://proba2.oma.be/swap/data/mpg/movies/20171215_swap_movie.mp4
Review of solar and geomagnetic activity
SOLAR ACTIVITY
The GOES X-ray background was around the A5 level throughout the week. The only active region present was NOAA 2691 (beta, later spotless). No C flares were measured.
A filament erupted on December 15. The filament was seen in H-alpha images from the GONG ground based network and in AIA 304 A solar images from the SDO satellite. The filament was located at 25 degrees South and 40 degrees East. The CACTUS software saw the CME appearing in LASCO C2 images at 12:12 UT on December 15. CACTus made an estimation of the CME speed COR2 A J-maps. It appeared to be very low: only 284 km/s.
The greater than 10 MeV proton flux was at nominal levels throughout the week.
GEOMAGNETIC ACTIVITY
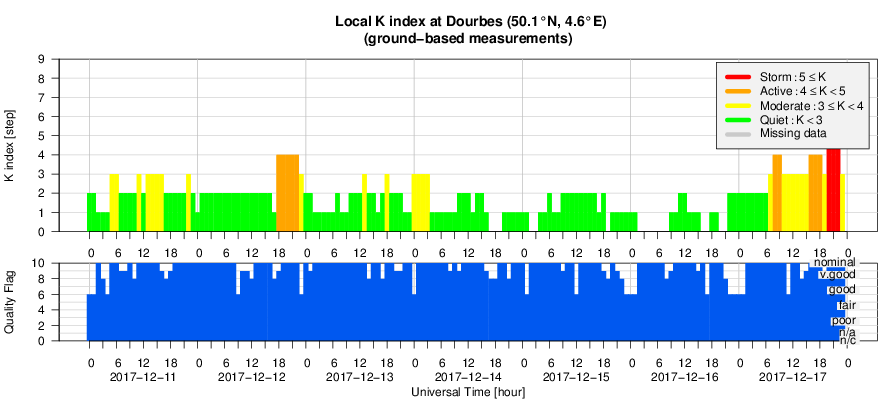
The solar wind speed and the total magnetic field carried by the solar wind at L1 were elevated levels on December 11 and 12 . This was due to the presence of a positive polar coronal hole on the Sun with an extension towards the solar equator. The geomagnetic field was slightly disturbed. At Dourbes, a K of 4 was measured on December 12.
A Corotating Interaction Region and a high speed stream associated with a recurrent positive equatorial coronal hole passed the L1 on December 16. The solar wind speed up to values slightly above 600 km/s. The Interplanetary magnetic field carried by the solar wind had a strength around 16 nT.
On December 17, active to minor geomagnetic storms intervals were registered at Dourbes. The planetary Kp index reached also values up to 5. Several active to minor geomagnetic storm intervals (K Dourbes and NOAA Kp = 4-5) were registered as a result on December 17.
The SIDC Space weather Briefing (11 Dec 2017 - 17 Dec 2017)
The Space Weather Briefing presented by the forecaster on duty from December 11 to 17. It reflects in images and graphs what is written in the Solar and Geomagnetic Activity report.
The pdf-version: http://www.stce.be/briefings/SIDCbriefing-20171218.pdf
Movie 1 on Solar active region evolution: http://www.stce.be/briefings/20171218_movie1.mp4
Movie 2 on Solar active region evolution: http://www.stce.be/briefings/20171218_movie2.mp4
Movie about CMEs: http://www.stce.be/briefings/20171218_movie3.mp4
The International Sunspot Number
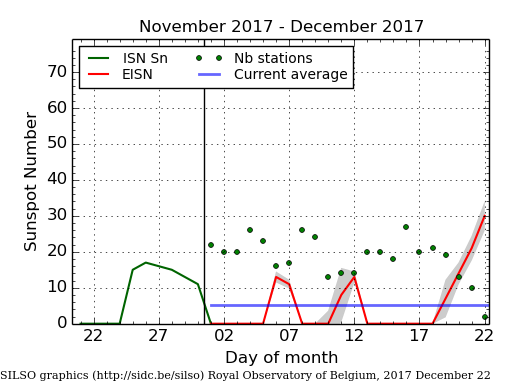
The daily Estimated International Sunspot Number (EISN, red curve with shaded error) derived by a simplified method from real-time data from the worldwide SILSO network. It extends the official Sunspot Number from the full processing of the preceding month (green line). The plot shows the last 30 days (about one solar rotation). The horizontal blue line shows the current monthly average, while the green dots give the number of stations included in the calculation of the EISN for each day.
Geomagnetic Observations at Dourbes (11 Dec 2017 - 17 Dec 2017)
Review of ionospheric activity (11 Dec 2017 - 17 Dec 2017)
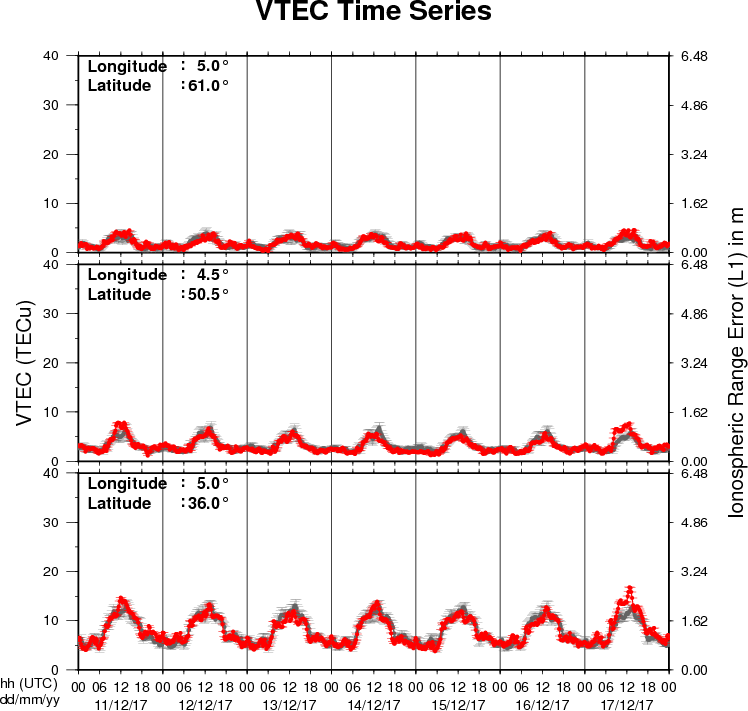
The figure shows the time evolution of the Vertical Total Electron Content (VTEC) (in red) during the last week at three locations:
a) in the northern part of Europe(N61°, 5°E)
b) above Brussels(N50.5°, 4.5°E)
c) in the southern part of Europe(N36°, 5°E)
This figure also shows (in grey) the normal ionospheric behaviour expected based on the median VTEC from the 15 previous days.
The VTEC is expressed in TECu (with TECu=10^16 electrons per square meter) and is directly related to the signal propagation delay due to the ionosphere (in figure: delay on GPS L1 frequency).
The Sun's radiation ionizes the Earth's upper atmosphere, the ionosphere, located from about 60km to 1000km above the Earth's surface.The ionization process in the ionosphere produces ions and free electrons. These electrons perturb the propagation of the GNSS (Global Navigation Satellite System) signals by inducing a so-called ionospheric delay.
See http://stce.be/newsletter/GNSS_final.pdf for some more explanations ; for detailed information, see http://gnss.be/ionosphere_tutorial.php
Enjoy the holidays!