- Table of Content
- 1.A sunspot oddi...
- 2.PROBA2 Observa...
- 3.Review of sola...
- 4.The SIDC Space...
- 5.The Internatio...
- 6.Geomagnetic Ob...
- 7.Review of iono...
2. PROBA2 Observations (1 Jan 2018 - 7 Jan 2018)
3. Review of solar and geomagnetic activity
4. The SIDC Space weather Briefing
5. The International Sunspot Number
6. Geomagnetic Observations at Dourbes (1 Jan 2018 - 7 Jan 2018)
7. Review of ionospheric activity (1 Jan 2018 - 7 Jan 2018)
A sunspot oddity
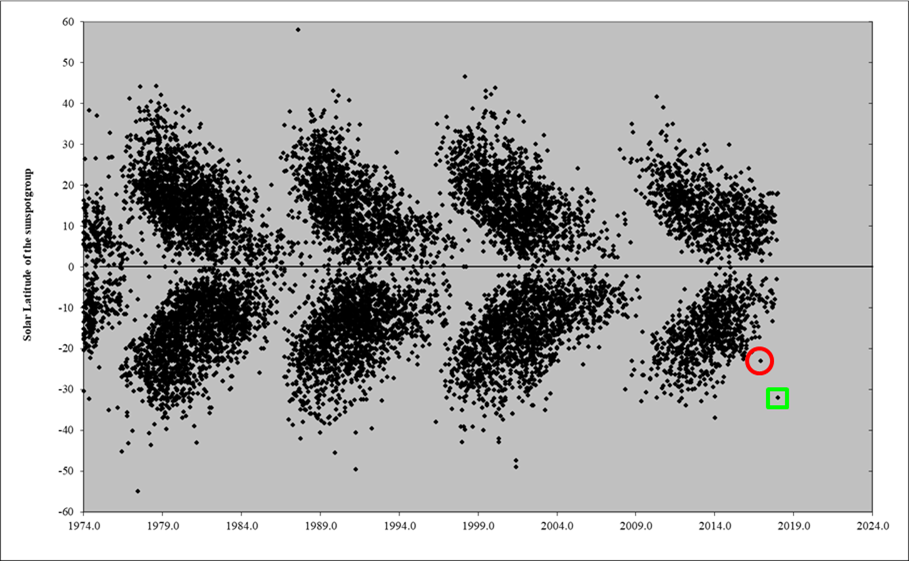
It is a well-known feature of a solar cycle that its first sunspot groups appear at high solar latitudes. These sunspots appear around 25-30 degrees away from the solar equator about 10-20 months prior to the solar cycle minimum, i.e. before the start of the new cycle. As this new solar cycle further unfolds, the sunspot groups gradually appear closer to the solar equator, with -during maximum- a heliographic latitude of about 15 degrees. As the solar cycle heads for the next minimum, the sunspot groups appear even closer to the solar equator, gradually becoming smaller and disappearing while the sunspots of the new solar cycle manifest themselves again at high latitudes. This movement of sunspots can also be followed in a diagram showing the latitude of sunspot groups over time. As it resembles the wings of a butterfly, it is called a butterfly-diagram (see figure underneath and http://www.stce.be/news/234/welcome.html for more info). It is believed this butterfly-diagram is a manifestation of the solar dynamo, but the precise mechanism still eludes scientists.
Sunspots of a new solar cycle can also be recognized by their magnetic polarity, which is opposite to that of the ongoing ("old") cycle. Nonetheless, these reversed polarity groups need to have a sufficiently high latitude too , because it has been shown that during a solar cycle, about 3% of all sunspot groups have such a reversed polarity, probably a consequence of the dynamics inside the Sun (see http://www.stce.be/news/286/welcome.html for more info and examples).
When in December 2016 a reversed polarity group appeared in the southern solar hemisphere at a latitude well beyond 20 degrees, it was considered as the first group of the new solar cycle (SC25; see http://www.stce.be/node/359 for more info). The magnetogram, revealing the magnetic polarities of the sunspot groups, can be seen underneath left. The sunspot group was numbered as NOAA 2620 and appears as a red encircled dot in the butterfly diagram above. As can be seen, this dot is still relatively close to the southern "wing" of the ongoing solar cycle (SC24), so there is a small possibility that this region was actually a reversed polarity region.
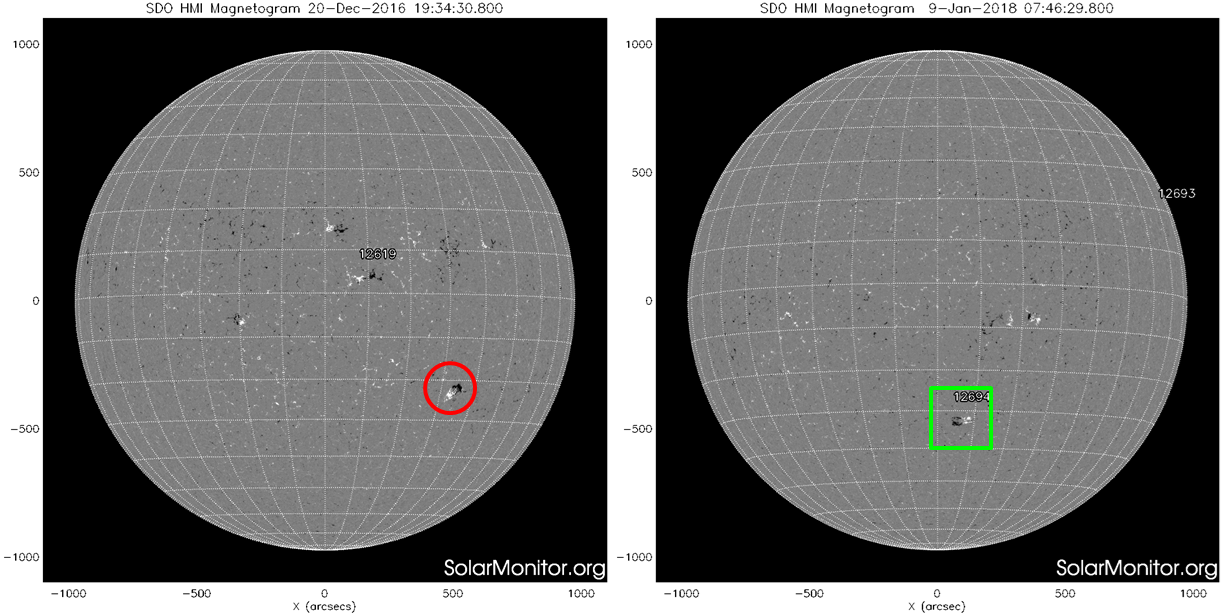
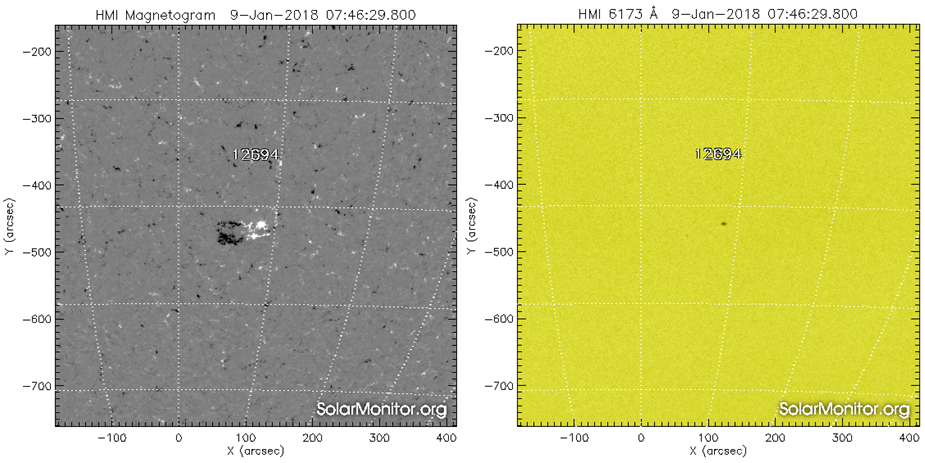
No high-latitude regions appeared in 2017 until 8 January 2018, when a small sunspot group NOAA 2694 appeared with a latitude of -32 degrees. That's a perfect latitude for a new cycle region, but... there was a caveat! Indeed, the sunspot region had the *same* magnetic polarity as the sunspot groups on the southern hemisphere of the *old* solar cycle (SC24; see the magnetogram above right). In the butterfly diagram, this sunspot group is highlighted as a dot embedded in a green square. Clearly, this dot suggests much better that the group is part of the tip of the southern "wing" of upcoming SC25, it's just too bad that the magnetic polarity is still that of the ongoing solar cycle. So, is this region indeed a SC24 group with an exceptionally high latitude at this phase of the cycle, or is this region a genuine SC25 group which happens to have a reversed polarity (3% chance)? Time will tell, but for now it remains a sunspot oddity.
PROBA2 Observations (1 Jan 2018 - 7 Jan 2018)
Solar Activity
Solar flare activity remained very low during the week.
In order to view the activity of this week in more detail, we suggest to go to the following website from which all the daily (normal and difference) movies can be accessed: http://proba2.oma.be/ssa
This page also lists the recorded flaring events.
A weekly overview movie can be found here (SWAP week 406): http://proba2.oma.be/swap/data/mpg/movies/weekly_movies/weekly_movie_2018_01_01.mp4
Details about some of this week's events, can be found further below.
If any of the linked movies are unavailable they can be found in the P2SC movie repository here: http://proba2.oma.be/swap/data/mpg/movies/
Sunday Jan 07
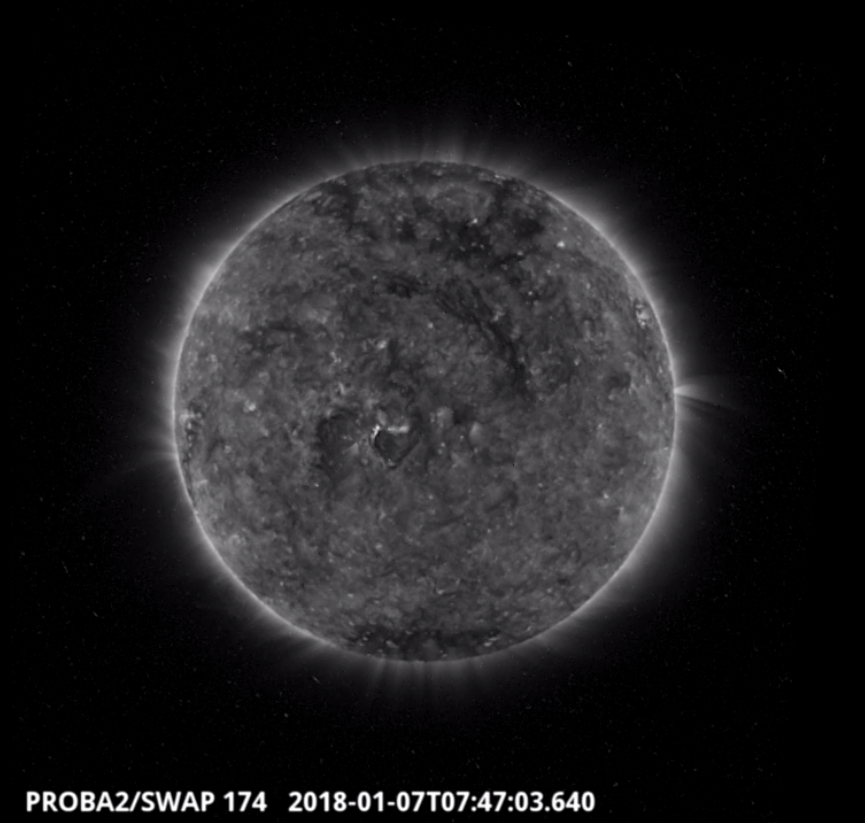
Flows along a coronal loop are visible in the centre of the solar disk in the SWAP image above at 07:47 UT on 2018-Jan-07.
Find a movie of the event here http://proba2.oma.be/swap/movies/20180107_swap_movie.mp4 (SWAP movie) and here http://proba2.oma.be/swap/movies/20180107_swap_diff.mp4 (SWAP difference movie)
Review of solar and geomagnetic activity
SOLAR ACTIVITY
The solar activity was low. The visible solar disc was mostly spotless and no flare has been recorded. On Jan 06 a small sunspot (NOAA active region 2693) has emerged in the north-west quadrant of the visible disc, but rapidly decayed on the second day.
No Earth directed Coronal Mass Ejection has been observed and the greater than 10 MeV solar protons flux remained at nominal levels over the week.
GEOMAGNETIC ACTIVITY
The solar wind at L1 was dominated by a fast solar wind associated with the extension of a northern coronal hole (which reached the central meridian on Dec 28). The interplanetary magnetic field suddenly increased when the Corotating Interaction Region passed the L1 point on Dec 31 around 18:00 UT and reached magnitudes of 12 nT with a Bz component fluctuated between -11 and 10 nT. The solar wind reached a maximum speed of around 490 km/s on Jan 01 afternoon, then the speed decreased slowly and reached 300 km/s on Jan 08. The northern polar coronal hole had an extension down to latitude 20 degree. The extension crossed the central meridian during the second part of Jan 04.
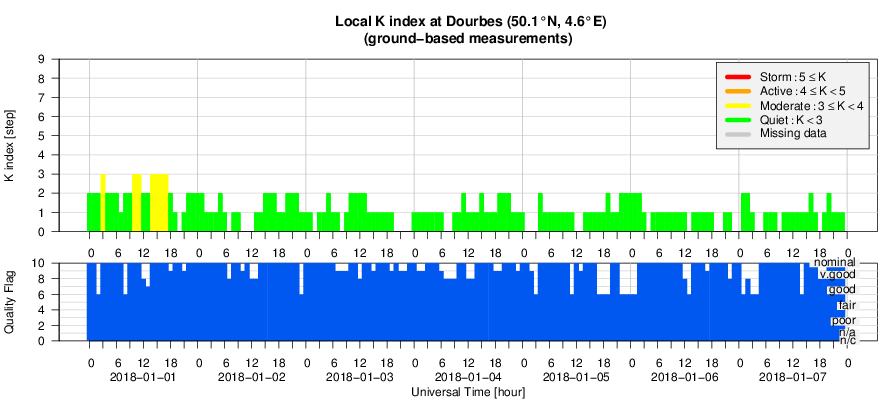
The solar wind associated with the coronal hole which was at the central meridian on Dec 28, slightly disturbed the geomagnetic field on Jan 01. NOAA reported active conditions (Kp=4) for the second 3h time interval on Jan 01, while Dourbes stations observed only unsettle conditions (K=3) on Jan 01. From Dec 02, the geomagnetic field returned to nominal conditions until the end of the week.
The SIDC Space weather Briefing
The Space Weather Briefing presented by the forecaster on duty from Jan 1 to 8. It reflects in images and graphs what is written in the Solar and Geomagnetic Activity report.
Solar active region evolution, movie: http://www.stce.be/briefings/20180108_JHV.mp4
Pdf version of the briefing: http://www.stce.be/briefings/SIDCbriefing-20180108.pdf
The International Sunspot Number
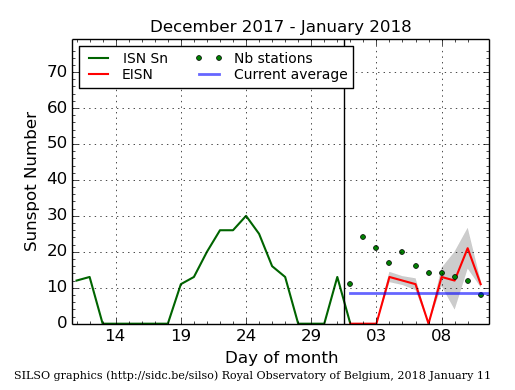
The daily Estimated International Sunspot Number (EISN, red curve with shaded error) derived by a simplified method from real-time data from the worldwide SILSO network. It extends the official Sunspot Number from the full processing of the preceding month (green line). The plot shows the last 30 days (about one solar rotation). The horizontal blue line shows the current monthly average, while the green dots give the number of stations included in the calculation of the EISN for each day.
Geomagnetic Observations at Dourbes (1 Jan 2018 - 7 Jan 2018)
Review of ionospheric activity (1 Jan 2018 - 7 Jan 2018)
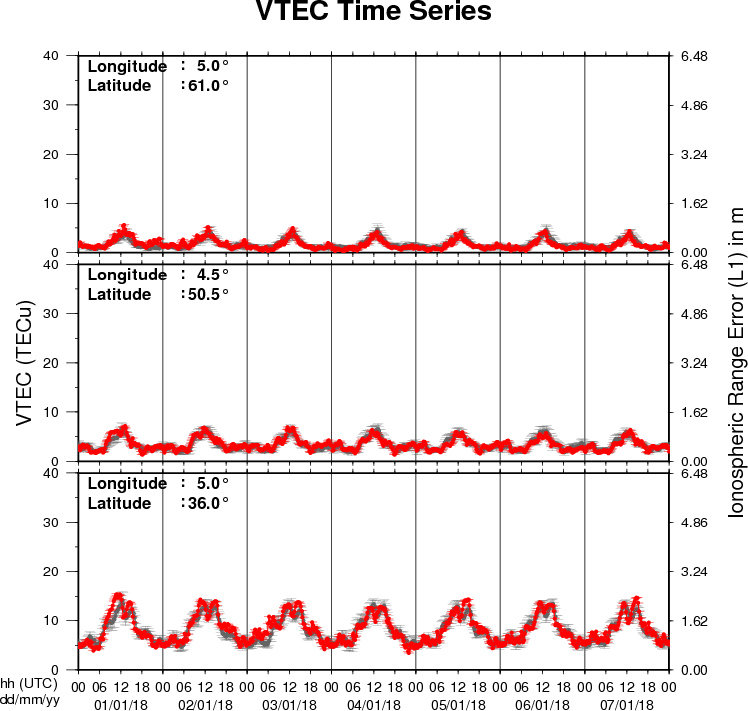
The figure shows the time evolution of the Vertical Total Electron Content (VTEC) (in red) during the last week at three locations:
a) in the northern part of Europe(N61°, 5°E)
b) above Brussels(N50.5°, 4.5°E)
c) in the southern part of Europe(N36°, 5°E)
This figure also shows (in grey) the normal ionospheric behaviour expected based on the median VTEC from the 15 previous days.
The VTEC is expressed in TECu (with TECu=10^16 electrons per square meter) and is directly related to the signal propagation delay due to the ionosphere (in figure: delay on GPS L1 frequency).
The Sun's radiation ionizes the Earth's upper atmosphere, the ionosphere, located from about 60km to 1000km above the Earth's surface.The ionization process in the ionosphere produces ions and free electrons. These electrons perturb the propagation of the GNSS (Global Navigation Satellite System) signals by inducing a so-called ionospheric delay.
See http://stce.be/newsletter/GNSS_final.pdf for some more explanations ; for detailed information, see http://gnss.be/ionosphere_tutorial.php