- Table of Content
- 1.Valentine's au...
- 2.PROBA2 Observa...
- 3.Review of sola...
- 4.The SIDC Space...
- 5.The Internatio...
- 6.Geomagnetic Ob...
- 7.Review of iono...
2. PROBA2 Observations (5 Feb 2018 - 11 Feb 2018)
3. Review of solar and geomagnetic activity
4. The SIDC Space Weather Briefing
5. The International Sunspot Number
6. Geomagnetic Observations at Dourbes (5 Feb 2018 - 11 Feb 2018)
7. Review of ionospheric activity (5 Feb 2018 - 11 Feb 2018)
Valentine's aurora?
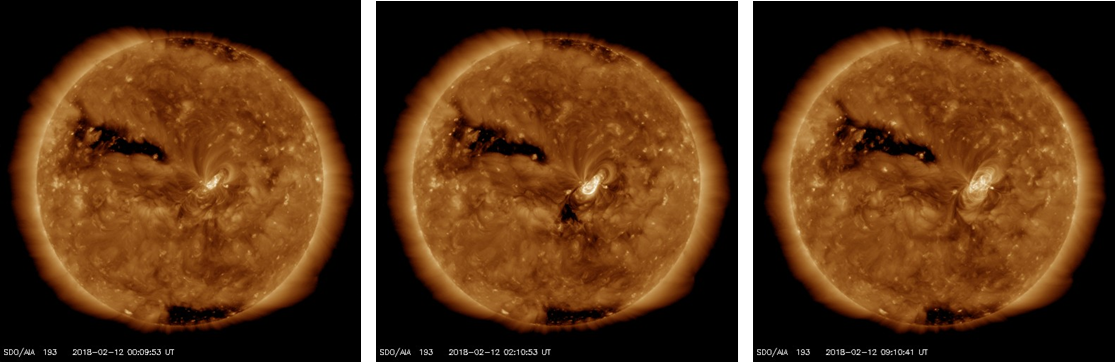
Just after midnight on 12 February, NOAA 2699 was the source of a long duration C1.5 flare. The x-ray event started at 00:15UT, peaked at 01:35UT, and ended at 03:21UT, hence lasting for more than 3 hours! Coronal dimming, also known as a transient ("temporary") coronal hole, was observed close to the solar disk's centre. This can be seen in SDO's extreme ultraviolet imagery (AIA 193) underneath around 00UT (before the flare's onset), around 02UT (during the flare), and around 09UT (after the flare). The coronal dimming indicated that the event was very likely associated with a coronal mass ejection which -in view of the source's position- may be en route to Earth.
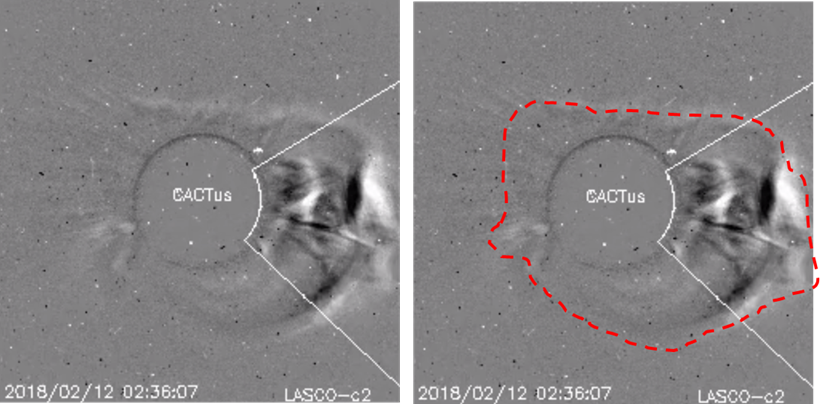
The associated coronal mass ejection (CME) was first observed in the SOHO/LASCO C2 field of view at 01:25UT (CACTus: http://www.sidc.oma.be/cactus/ ). It concerned an asymmetric halo CME (see coronagraphic image underneath; the CME is outlined by red dashes) which had a speed slightly in excess of 500 km/s. Most of the space weather forecast centres predict its arrival at Earth sometime between late 14 (18UT) and 15 (24UT) February, with minor to moderate geomagnetic storming possible. This means that aurora will most likely be limited to the Scandinavian countries, Scotland, Alaska, Canada and the Great Lakes. Just imagine sipping hot chocolate together with your loved one in a sledge in a pristine snowy white landscape illuminated by the deep-red hues from the aurora... That would surely classify as a great Valentine's gift!
PROBA2 Observations (5 Feb 2018 - 11 Feb 2018)
Solar Activity
Solar flare activity fluctuated between very low and low during the week.
In order to view the activity of this week in more detail, we suggest to go to the following website from which all the daily (normal and difference) movies can be accessed: http://proba2.oma.be/ssa
This page also lists the recorded flaring events.
A weekly overview movie can be found here (SWAP week 411): http://proba2.oma.be/swap/data/mpg/movies/weekly_movies/weekly_movie_2018_02_05.mp4
Details about some of this week's events, can be found further below.
If any of the linked movies are unavailable they can be found in the P2SC movie repository here: http://proba2.oma.be/swap/data/mpg/movies/
Wednesday Feb 07
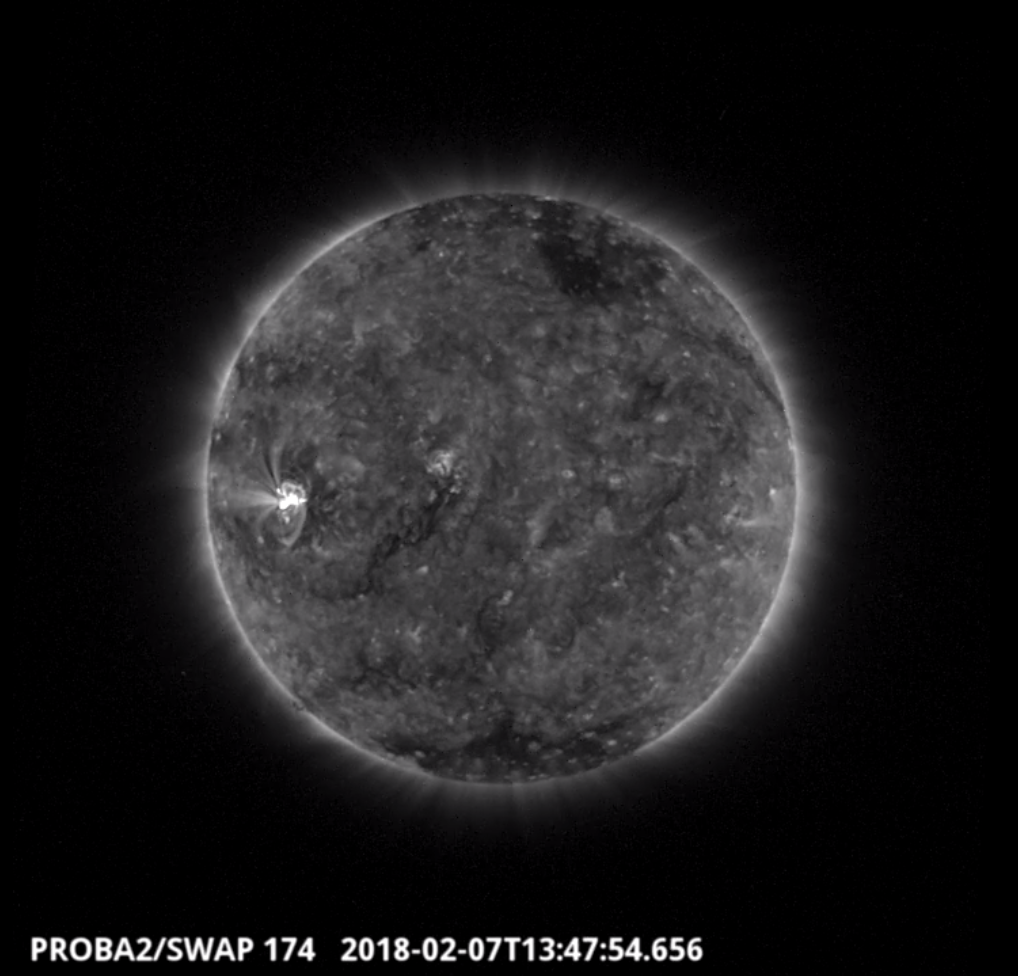
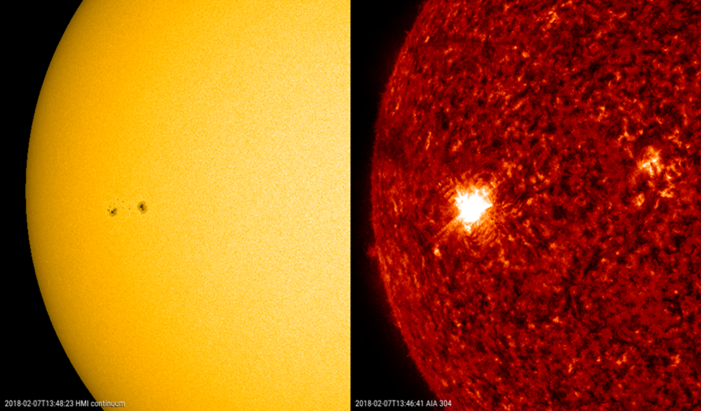
The largest flare of the week was a C-class (C8.1) flare, associated with NOAA AR 2699 and was observed by SWAP on 2018-Feb-07. The flare is visible towards the east of the solar disk in the SWAP image above at 13:47 UT.
Find a movie of the event here (SWAP movie): http://proba2.oma.be/swap/movies/20180207_swap_movie.mp4
Saturday Feb 10
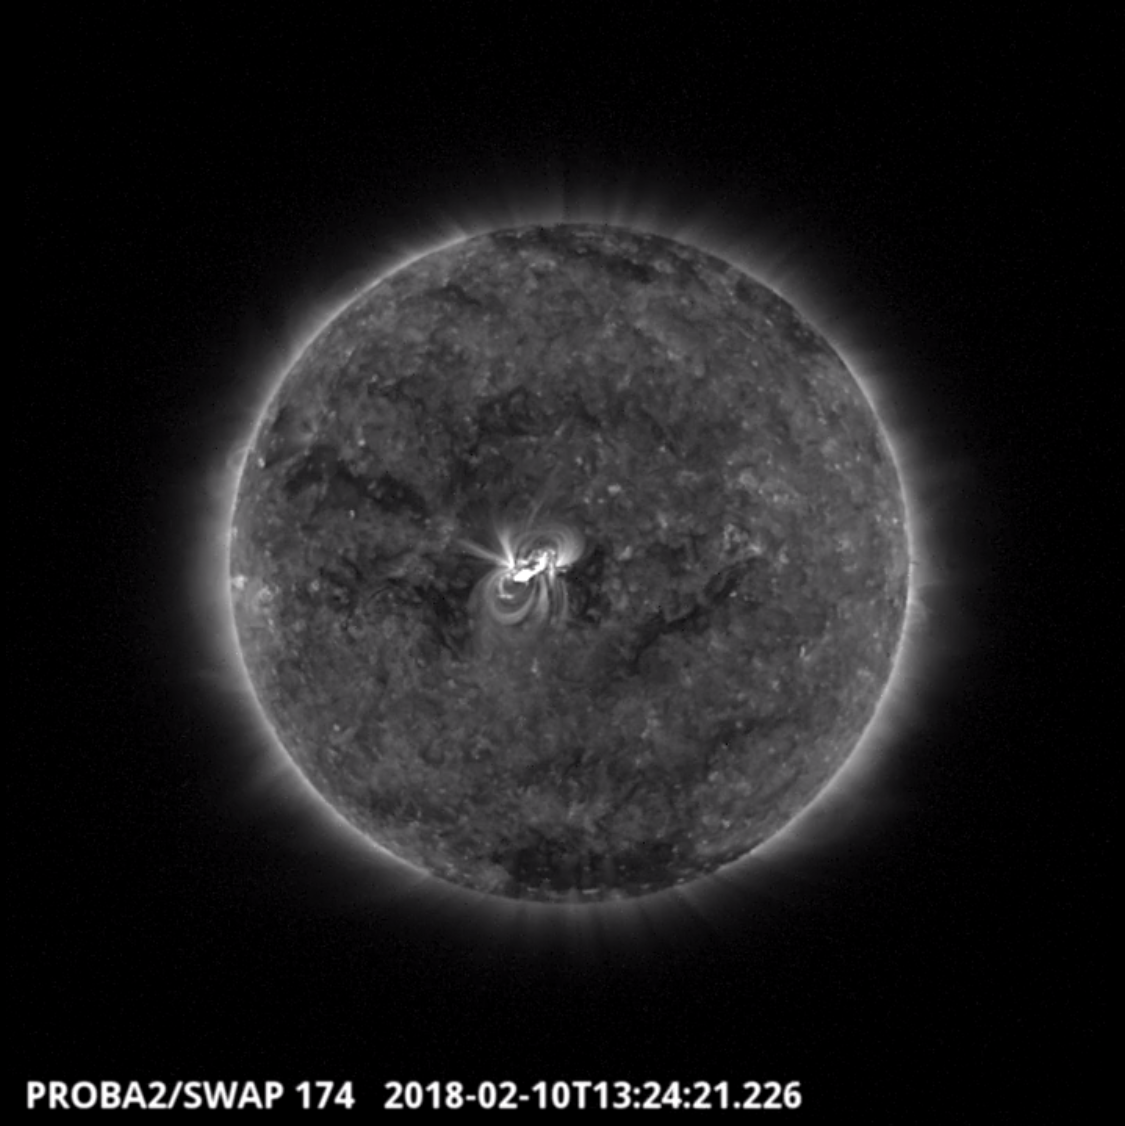
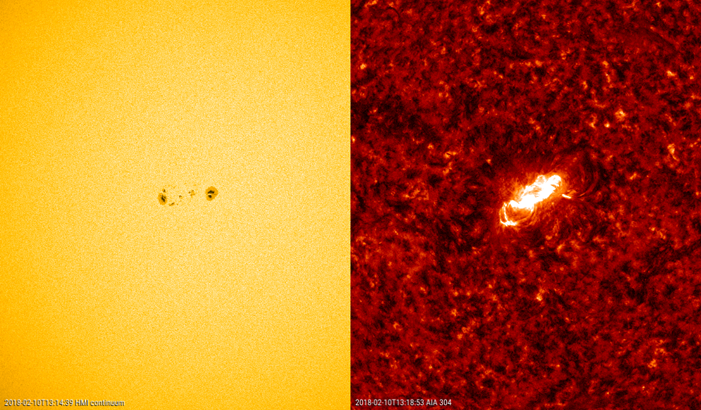
The second largest flare of the week was a C-class (C4.6) flare, also associated with NOAA AR 2699 and was observed by SWAP on 2018-Feb-10. The flare is visible in the centre of the solar disk in the SWAP image above at 13:24 UT.
Find a movie of the event here (SWAP movie): http://proba2.oma.be/swap/movies/20180210_swap_movie.mp4
Review of solar and geomagnetic activity
SOLAR ACTIVITY
Solar activity was at low levels, driven by NOAA active region (AR) 2699 which had just rounded the east limb by the end of the previous period (4 February). This moderately sized sunspot group developed into a beta-gamma magnetic configuration (Hale classification) by 8 February before simplifying into a beta magnetic configuration on 11 February. NOAA AR 2699 produced 4 C-class flares during the period. The two largest flares were a C8.1 flare peaking on 7 February at 13:47UT, and a C4.6 flare peaking on 10 February at 13:21UT. See the SDO imagery in white light and extreme ultraviolet (AIA 304) underneath. Several small diffuse coronal holes (CH) and the extension of the positive northern polar CH transited the central meridian. No earth-directed coronal mass ejections (CMEs) were observed throughout the week. The greater than 10 MeV proton flux was at nominal levels.
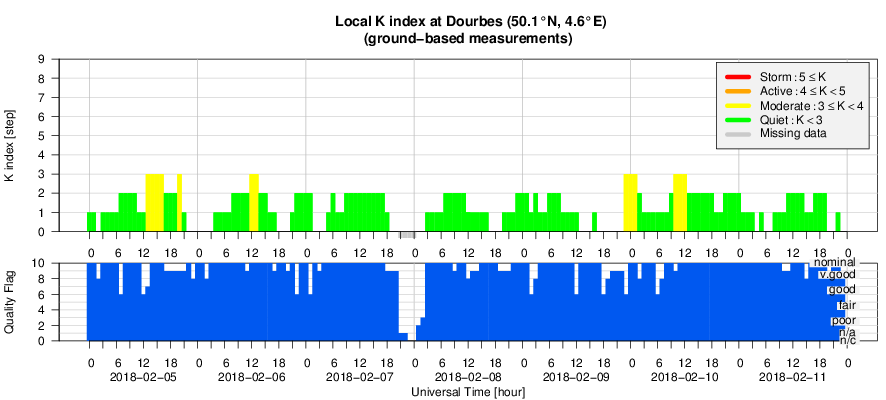
GEOMAGNETIC ACTIVITY
The earth environment was under the influence of a weak moderate speed solar wind stream till 7 February. The solar wind speed was slightly elevated at 430 km/s and Bt at 6 nT, producing only unsettled geomagnetic conditions (K = 3). Solar wind parameters then returned to nominal conditions, with wind speed mostly between 315 and 350 km/s from 8 February onwards. Mostly quiet geomagnetic conditions were observed, with two brief unsettled episodes on 9 and 10 February related to small perturbations in the solar wind.
The SIDC Space Weather Briefing
The Space Weather Briefing presented by the forecaster on duty from 5 till 11 February. It reflects in images and graphs what is written in the Solar and Geomagnetic Activity report.
A running movie of this presentation can be found at http://www.stce.be/movies/SIDCbriefing-20180212.wmv , with the pdf version at http://www.stce.be/movies/SIDCbriefing-20180212pdf.pdf
The International Sunspot Number
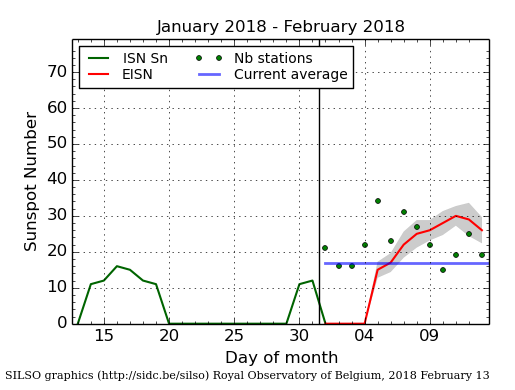
The daily Estimated International Sunspot Number (EISN, red curve with shaded error) derived by a simplified method from real-time data from the worldwide SILSO network. It extends the official Sunspot Number from the full processing of the preceding month (green line). The plot shows the last 30 days (about one solar rotation). The horizontal blue line shows the current monthly average, while the green dots give the number of stations included in the calculation of the EISN for each day.
Geomagnetic Observations at Dourbes (5 Feb 2018 - 11 Feb 2018)
Review of ionospheric activity (5 Feb 2018 - 11 Feb 2018)
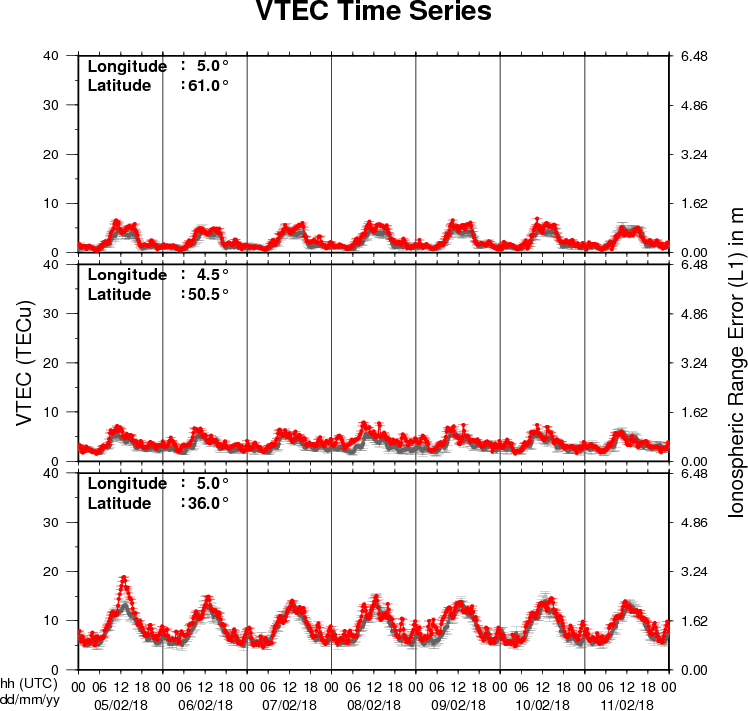
The figure shows the time evolution of the Vertical Total Electron Content (VTEC) (in red) during the last week at three locations:
a) in the northern part of Europe(N61°, 5°E)
b) above Brussels(N50.5°, 4.5°E)
c) in the southern part of Europe(N36°, 5°E)
This figure also shows (in grey) the normal ionospheric behaviour expected based on the median VTEC from the 15 previous days.
The VTEC is expressed in TECu (with TECu=10^16 electrons per square meter) and is directly related to the signal propagation delay due to the ionosphere (in figure: delay on GPS L1 frequency).
The Sun's radiation ionizes the Earth's upper atmosphere, the ionosphere, located from about 60km to 1000km above the Earth's surface.The ionization process in the ionosphere produces ions and free electrons. These electrons perturb the propagation of the GNSS (Global Navigation Satellite System) signals by inducing a so-called ionospheric delay.
See http://stce.be/newsletter/GNSS_final.pdf for some more explanations ; for detailed information, see http://gnss.be/ionosphere_tutorial.php