- Table of Content
- 1.A new SC25 gro...
- 2.PROBA2 Observa...
- 3.Review of sola...
- 4.The SIDC space...
- 5.The Internatio...
- 6.Geomagnetic Ob...
- 7.Review of iono...
2. PROBA2 Observations
3. Review of solar and geomagnetic activity
4. The SIDC space weather Briefing
5. The International Sunspot Number
6. Geomagnetic Observations at Dourbes
7. Review of ionospheric activity
A new SC25 group?
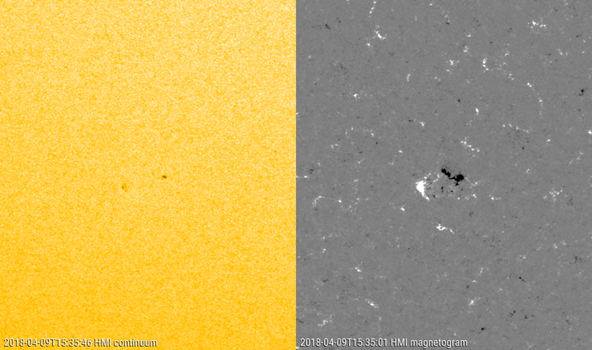
A sunspot group of the new solar cycle (SC25) emerged around noon on 9 April, and had disappeared by noon of the next day. It concerned a tiny region at a latitude of -31° (i.e. in the southern hemisphere), and has not received a NOAA number yet. It was observed by the Mount Wilson Observatory on 9 April (ftp://howard.astro.ucla.edu/pub/obs/drawings ) and by a number of observers from the SILSO network (http://sidc.oma.be/silso/eisnplot ) on 10 April.
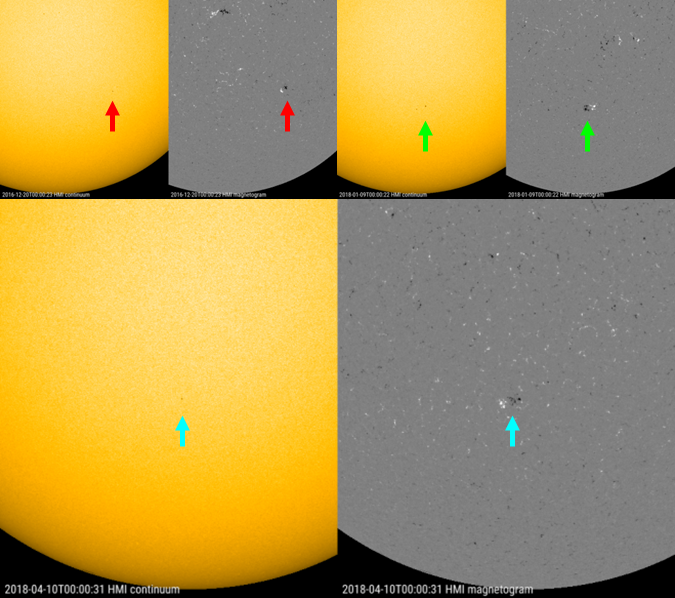
It would have been only the third numbered sunspot region of the new solar cycle (see images underneath), and the first SC25 group at high latitude with the correct magnetic orientation. Indeed, the previous SC25 groups were observed in December 2016 at a rather moderate -23° (NOAA 2620), and in January this year there was NOAA 2694 at a high latitude (-32°) but with the "wrong" (SC24) magnetic orientation. More on this odd configuration in the STCE Newsitem at http://www.stce.be/news/414/welcome.html In all three cases, it concerned tiny sunspot groups lasting only a day or so.
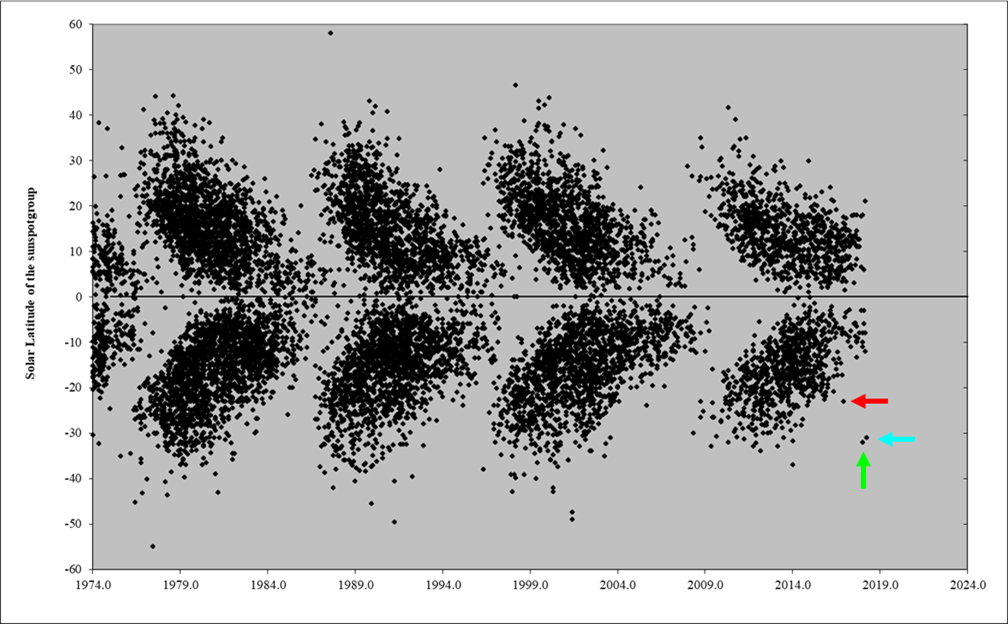
The diagram underneath displays for each month since 1974 the latitude of every individual sunspot group (NOAA number) that has appeared. It clearly shows that as a solar cycle is heading for the next minimum, the sunspot groups appear ever closer to the solar equator, gradually becoming smaller and disappearing while the sunspots of the new solar cycle manifest themselves again at high latitudes. As the pattern resembles the wings of a butterfly, it is called a butterfly-diagram. The first such butterfly-diagram was published by E. Walter Maunder in 1904 (http://adsabs.harvard.edu/abs/1904MNRAS..64..747M ). The position of the three SC25 groups have been indicated by colored arrows.
Though it is not so easy to observe these tiny sunspot regions in white light, they can quite easily be identified in a magnetogram of the solar disk. A magnetogram shows the locations on the Sun with a strong magnetic field, white being a location where the magnetic field is coming out of the Sun, and black where the magnetic field is returning to it. Well-known features are that sunspot regions are bipolar (i.e. they usually consist of a "black" and a "white" portion), that sunspot regions in the northern hemisphere have opposite polarities than those in the southern hemisphere, and that sunspot regions of a new solar cycle have magnetic polarities opposite to those of the old solar cycle. This is illustrated in the sketch underneath.
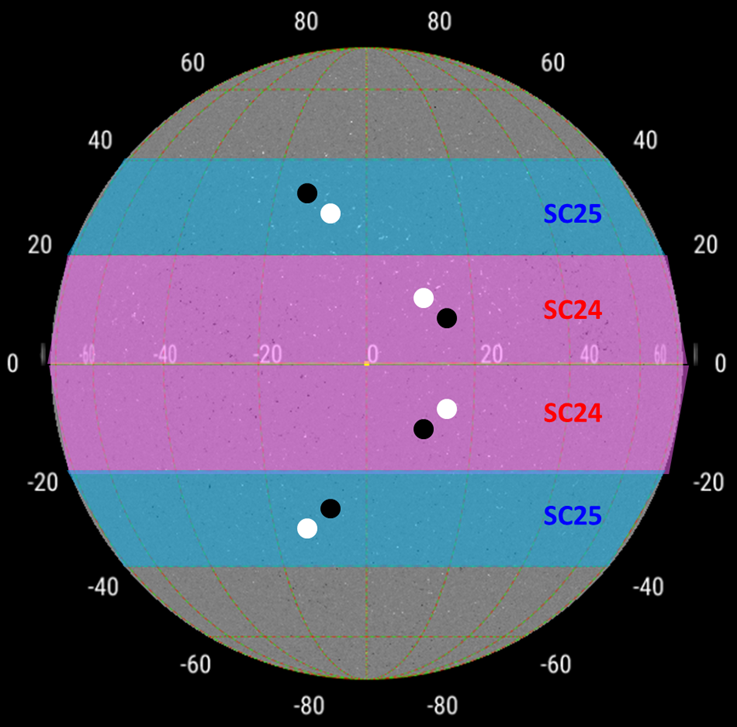
Sunspots of the old cycle (SC24) are still appearing in the pink-shaded region close to the solar equator (on the average about 10° away). The leading spots in the northern hemisphere have a negative ("black") magnetic polarity, opposite to the leading spots of the SC24 sunspot regions in the southern hemisphere which have a positive ("white") polarity. Meanwhile, the sunspot groups of the new solar cycle (SC25) appear at much higher latitudes in the light-blue shaded region, i.e. mostly between 20° to 40° away from the solar equator. Within the same solar hemisphere, the SC25 groups have a magnetic polarity opposite to those of SC24, e.g. in the northern hemisphere resp. "white" leading spot vs. "black" leading spot. Note that the pink and light-blue areas are indicative only and do not represent cut-in-stone barriers.
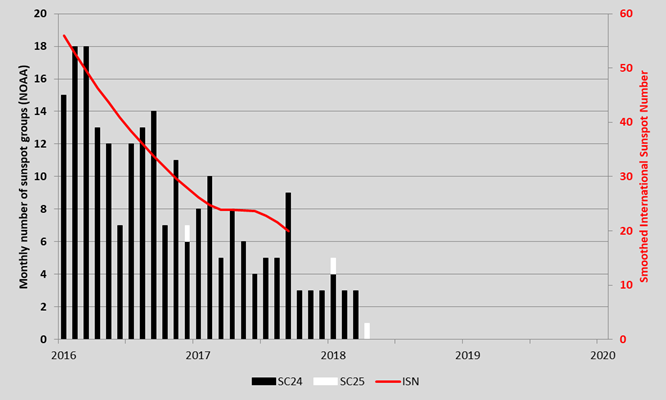
As the solar cycle minimum is getting near, the number of sunspot groups from the old cycle (SC24) will gradually decrease, whereas the number of SC25 sunspot regions will gradually increase. The graph above shows the monthly number of sunspot groups (having received a NOAA number) from SC24 (black) and from SC25 (white; here the 9-10 April region is considered as a SC25 group) since 2016. The red curve represents the smoothed monthly international sunspot number (SILSO). While the number of regions is low so close to the solar minimum, SC25 sunspot regions will gradually become more numerous than the SC24 regions. The cycle minimum usually occurs within just a few months of this "break-even". With the current evolution, it looks like this may happen within the next year, making SC24 both a small and short solar cycle (see also the STCE Newsitem at http://www.stce.be/news/417/welcome.html ).
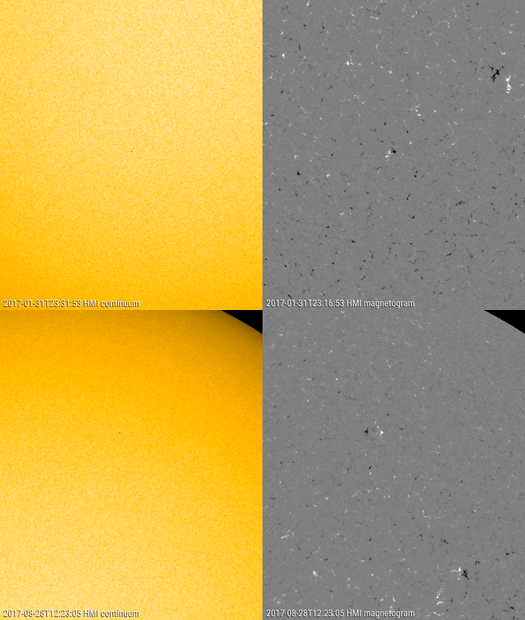
Meanwhile, the tiny sunspot group from 9-10 April has disappeared and will most likely not go down in the NOAA archives of numbered sunspot regions. It is not the first region nor will it be the last that suffers such a fate. Other examples were the tiny and ephemeral regions that appeared on 31 January 2017 (-25°) and on 28 August 2017 (+43°), resp. top and bottom in the figure above. These regions were visible for only a few hours, significantly less than the 9-10 April region. During the previous solar cycle minimum, the solar observing community came up with a (non-official) name for these really small and short-lived groups: "Tiny Tims". If you have to wipe your PC / laptop screen to verify if the feature you see is a true sunspot or a dust particle, then it just may qualify as a Tiny Tim. As the magnetic fields of SC25 gradually strengthen, the Tiny Tims will eventually give way to genuine (numbered) sunspot groups, and the new solar cycle will have truly started.
PROBA2 Observations
Solar Activity
Solar flare activity was very low during the week.
In order to view the activity of this week in more detail, we suggest to go to the following website from which all the daily (normal and difference) movies can be accessed: http://proba2.oma.be/ssa
This page also lists the recorded flaring events.
A weekly overview movie can be found here (SWAP week 419).
http://proba2.oma.be/swap/data/mpg/movies/weekly_movies/weekly_movie_2018_04_02.mp4
Details about some of this week’s events, can be found further below.
If any of the linked movies are unavailable they can be found in the P2SC movie repository here.
http://proba2.oma.be/swap/data/mpg/movies/
Tuesday Apr 03
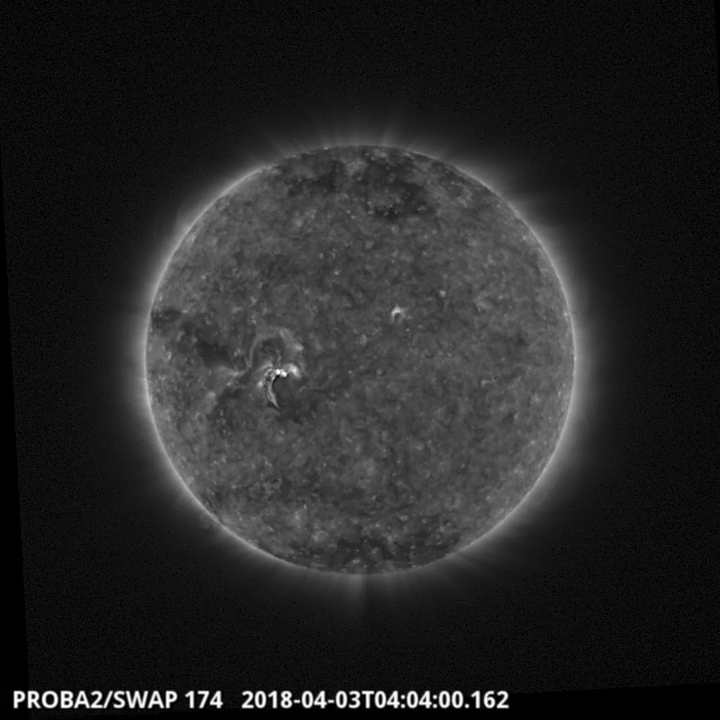
A B2.1 class flare from NOAA Active Region 2703 (South-East part of the Sun) erupted and interacted with the nearby filament on 2018-Apr-03. It was observed by SWAP at 04:04 UT and it is shown in the SWAP image above. Find a movie of the events here (SWAP movie)
http://proba2.oma.be/swap/data/mpg/movies/20180403_swap_movie.mp4
Thursday Apr 05
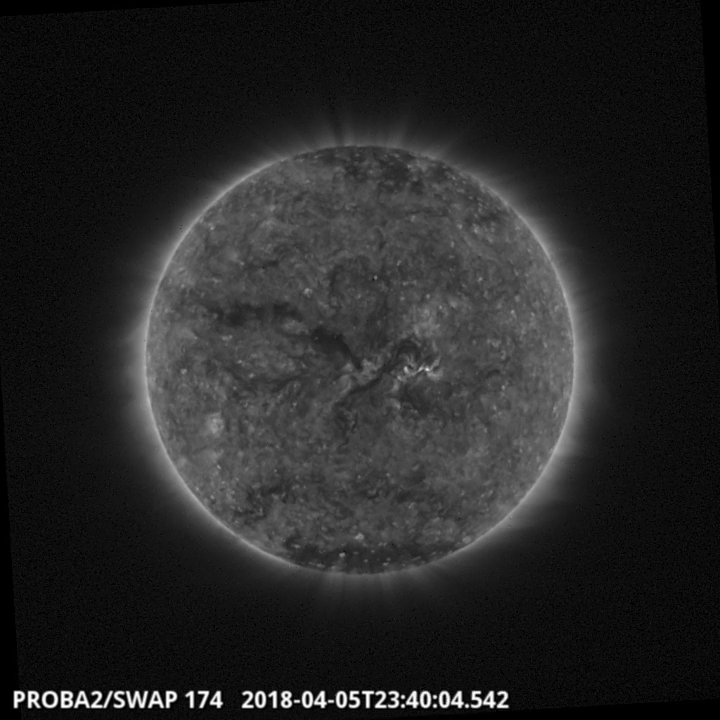
The SWAP image above shows an elongated coronal hole which transited the central meridian at the end of 2018-Apr-05. Find a movie of the event here (SWAP movie)
http://proba2.oma.be/swap/data/mpg/movies/20180405_swap_movie.mp4
Review of solar and geomagnetic activity
SOLAR ACTIVITY
Over the past week solar activity was very low. NOAA active region (AR) 2703 appeared on 30 March with an alpha magnetic field configuration and decayed into an H-alpha plage on 2 April producing only few B flares.
A low latitude negative polarity coronal hole has crossed the central meridian on 6 April.
There were no filament eruptions nor Earth-directed CMEs.
The greater than 10MeV proton flux remained at background levels throughout the week.
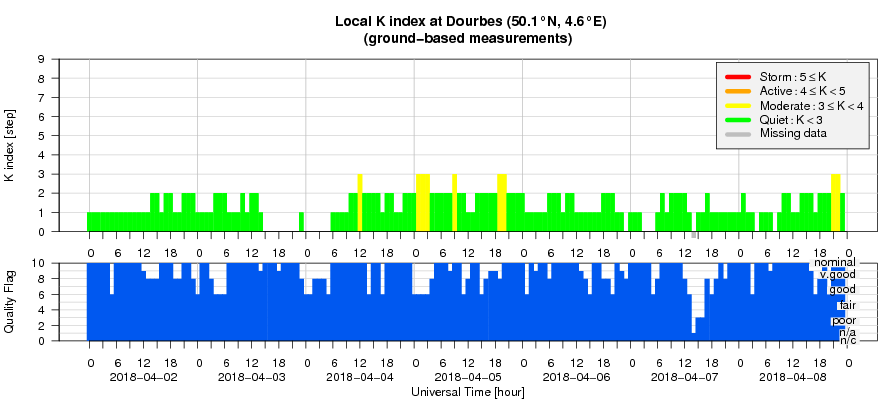
GEOMAGNETIC ACTIVITY
The solar wind speed fluctuated between 320 km/s and 440 km/s over the past week. The total magnetic field strength has fluctuated around 4.5 nT. The Bz component ranged between -4nt and +4 nT.
Geomagnetic conditions ranged between Kp index 0-3 (NOAA) and local K index 0-3 (Dourbes) over the past week.
The SIDC space weather Briefing
The Space Weather Briefing presented by the forecaster on duty from April 2 to 8. It reflects in images and graphs what is written in the Solar and Geomagnetic Activity report.
The pdf version: http://www.stce.be/briefings/SIDCbriefing-20180409.pdf
The International Sunspot Number
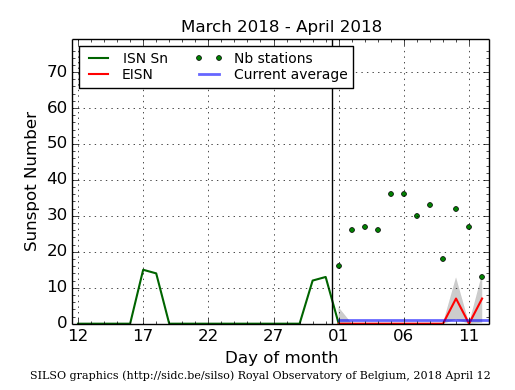
The daily Estimated International Sunspot Number (EISN, red curve with shaded error) derived by a simplified method from real-time data from the worldwide SILSO network. It extends the official Sunspot Number from the full processing of the preceding month (green line). The plot shows the last 30 days (about one solar rotation). The horizontal blue line shows the current monthly average, while the green dots give the number of stations included in the calculation of the EISN for each day.
Geomagnetic Observations at Dourbes
Review of ionospheric activity
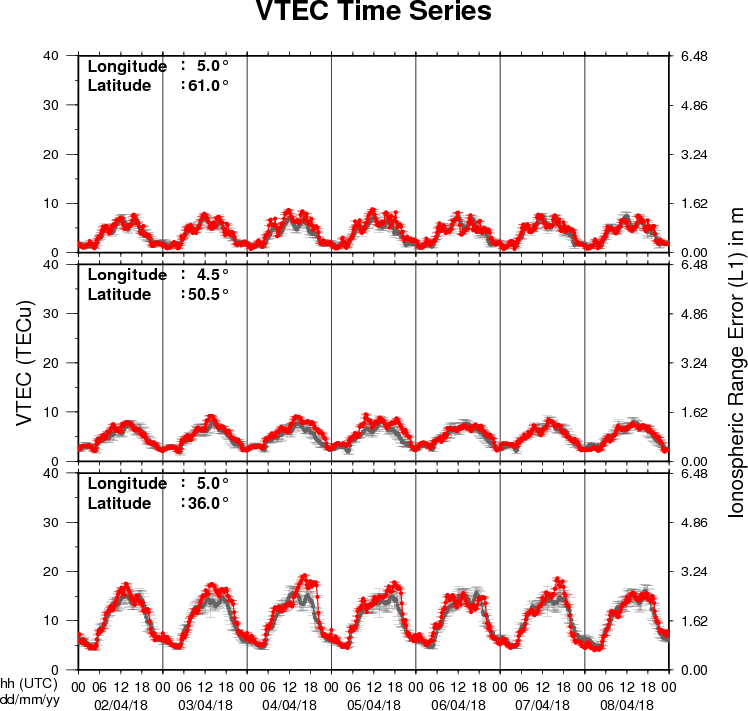
The figure shows the time evolution of the Vertical Total Electron Content (VTEC) (in red) during the last week at three locations:
a) in the northern part of Europe(N61°, 5°E)
b) above Brussels(N50.5°, 4.5°E)
c) in the southern part of Europe(N36°, 5°E)
This figure also shows (in grey) the normal ionospheric behaviour expected based on the median VTEC from the 15 previous days.
The VTEC is expressed in TECu (with TECu=10^16 electrons per square meter) and is directly related to the signal propagation delay due to the ionosphere (in figure: delay on GPS L1 frequency).
The Sun's radiation ionizes the Earth's upper atmosphere, the ionosphere, located from about 60km to 1000km above the Earth's surface.The ionization process in the ionosphere produces ions and free electrons. These electrons perturb the propagation of the GNSS (Global Navigation Satellite System) signals by inducing a so-called ionospheric delay.
See http://stce.be/newsletter/GNSS_final.pdf for some more explanations ; for detailed information, see http://gnss.be/ionosphere_tutorial.php