- Table of Content
- 1.The amazing co...
- 2.PROBA2 Observa...
- 3.Review of sola...
- 4.Review of geom...
- 5.The SIDC space...
- 6.The Internatio...
- 7.Geomagnetic Ob...
- 8.Review of iono...
2. PROBA2 Observations (9 Apr 2018 - 15 Apr 2018)
3. Review of solar activity
4. Review of geomagnetic activity
5. The SIDC space weather Briefing
6. The International Sunspot Number
7. Geomagnetic Observations at Dourbes (9 Apr 2018 - 15 Apr 2018)
8. Review of ionospheric activity (9 Apr 2018 - 15 Apr 2018)
The amazing coronal holes
Coronal holes are regions in the hot solar atmosphere ("corona") where the density of the plasma (i.e. charged particles) at that temperature is very low compared to its surroundings, and thus they look like dark shapes in the corona as imaged in extreme ultraviolet (EUV) or in x-ray. Linked to unipolar, open magnetic fields stretching into space, they are the source of the high-speed solar wind which can create geomagnetic disturbances. One such equatorial coronal hole was in a geo-effective position around 6-8 April (image underneath), and the associated wind stream was the source of a short-lived minor geomagnetic storm on 11 April.
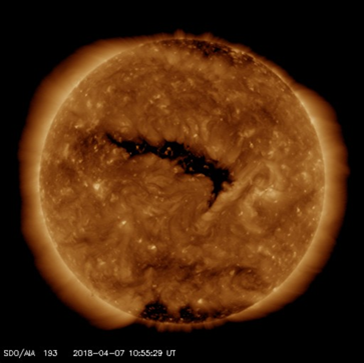
Coronal holes are best observed in EUV wavelengths near 19.3nm, corresponding to temperatures in the corona of more than 1 million degrees. Daily images of the solar corona are made by SDO's AIA instrument, and also with the two STEREO spacecraft as both are equipped with an EUV Imager (EUVI, 19.5nm). STEREO-A and -B image the farside of the Sun, though ST-B is no longer operational after a failure just prior to its superior conjunction (i.e. its passage behind the Sun) back in 2015. See e.g. these STCE news items at http://www.stce.be/news/315/welcome.html and http://www.stce.be/news/253/welcome.html
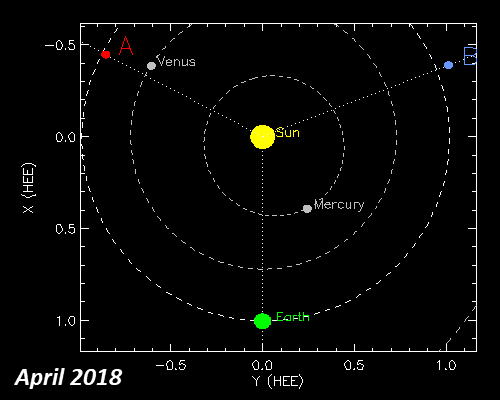
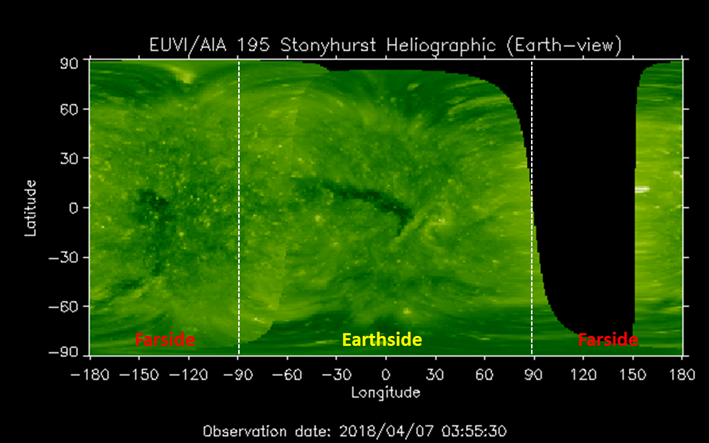
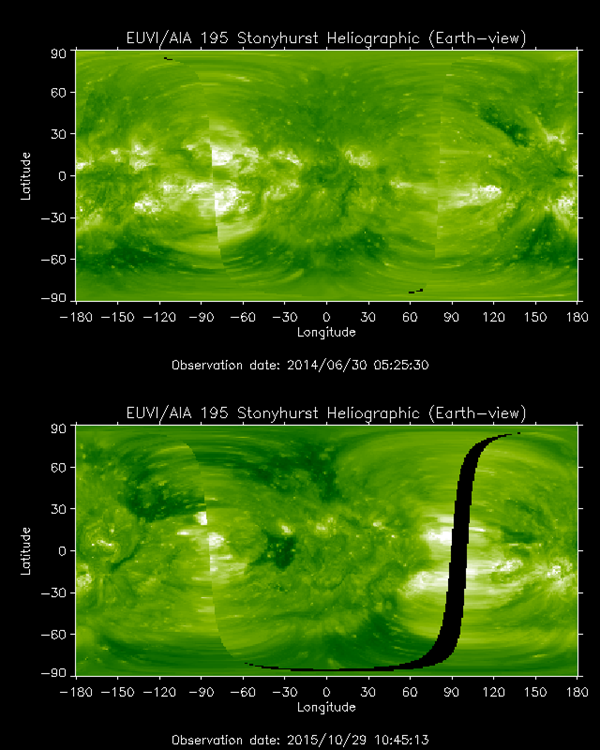
The current position of the three spacecraft can be seen in the sketch above, with SDO orbiting the Earth (the green dot) and A and B representing resp. ST-A and ST-B. Because they make several images every hour, the different points-of-view allow to create an EUV image of the entire Sun every day. These are called "synoptic maps", and are available at the STEREO website https://stereo-ssc.nascom.nasa.gov/beacon/beacon_secchi.shtml Such a map can be seen underneath, showing the coronal hole from 6-8 April right in the middle of the earth-facing solar hemisphere near 0 degrees longitude and 0 degrees latitude. The black area between longitude 90 and 150 degrees is the area not covered by the combination of the SDO and ST-A images, and would have been visible if ST-B was operational.
Nonetheless, complete synoptic maps were available from February 2011 till September 2014, and reasonably well-covered synoptic maps for pretty much the entire solar cycle 24 (SC24), starting from January 2009 onwards. Hence a movie (see the news item at http://www.stce.be/news/423/welcome.html) was created showing one synoptic map per solar rotation (27 days) from the start of SC24 till present (April 2018). As can be seen, coronal holes can appear everywhere on the solar surface, contrary to the active (sunspot) regions (bright areas) which are restricted to a band of roughly 30 degrees on each site of the solar equator. One can also observe the much slower rotation at the poles (more than 30 days), with extensions of the coronal holes "trailing" and moving eastward (to the left) compared to the equatorial features.
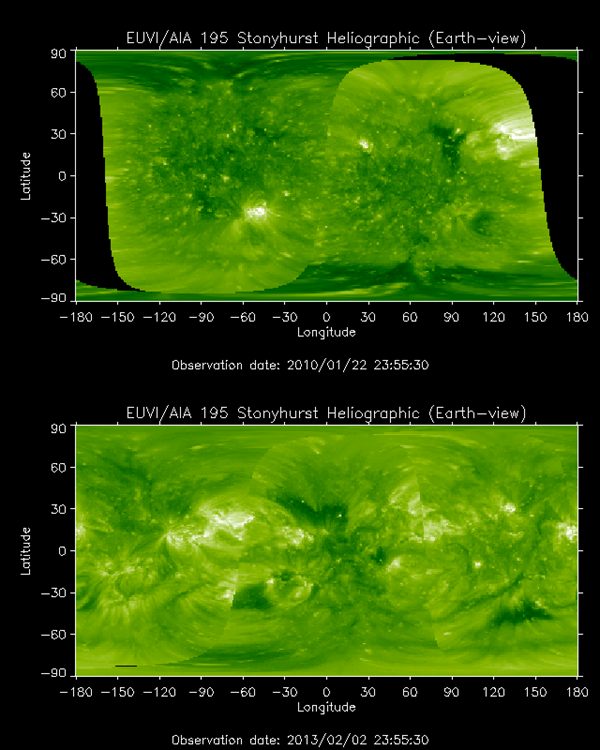
SC24 started with two well-formed polar coronal holes, as shown in image above (top). As the cycle progressed and solar activity started to increase, the polar coronal holes gradually disappeared and small but usually short-lived isolated coronal holes started to emerge between active regions and outside the active region belt. By 2011, the northern polar coronal hole had gone, with the southern polar coronal hole following a year later. The close spacing between and continuous emerging of the active regions during the years of solar cycle maximum limited the widths of the coronal holes and rapidly changed their boundaries (Wang 2017, http://adsabs.harvard.edu/abs/2017ApJ...841...94W ). See image above (bottom) showing only some isolated coronal holes at latitudes below about 45 degrees.
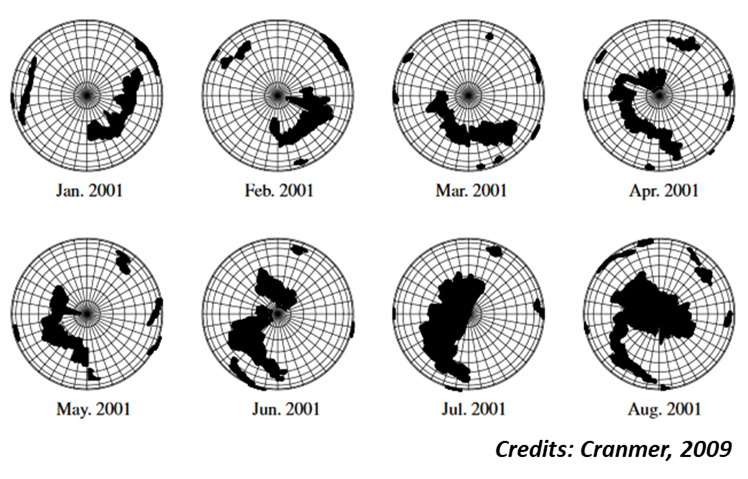
Some researchers have also indicated that polar coronal holes evolve from this interaction between equatorial coronal holes and decaying active region complexes (e.g. Golubeva et al. 2016, http://adsabs.harvard.edu/abs/2016SoPh..291.3605G ). Indeed, shortly after solar cycle maximum, polar coronal holes started to gradually develop from some high-latitude (about 60 degrees) coronal holes, first in the southern hemisphere and then in the northern hemisphere. This evolution is not so new, as it has e.g. also been observed during SC23 (see sketch above from the Sun's north pole, by Cranmer 2009, http://adsabs.harvard.edu/abs/2009LRSP....6....3C , Figure 3). Quite peculiar during SC24 was that the southern polar coronal hole reformed first, though it had dissolved *after* the northern polar coronal hole (imagery below).
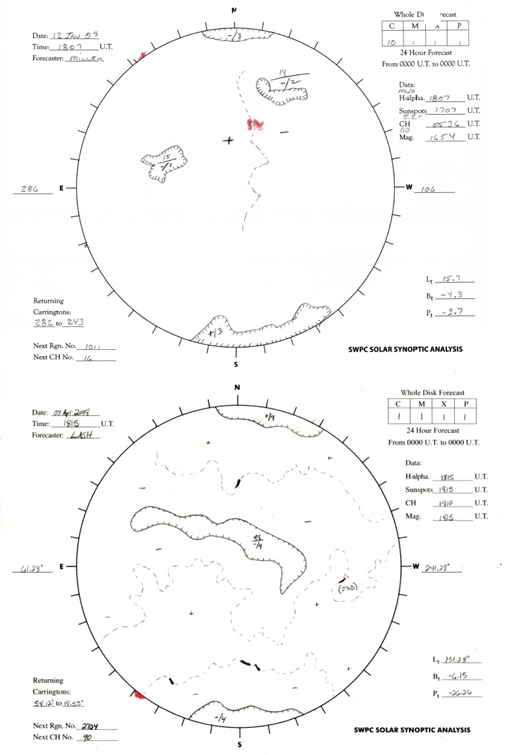
As the solar cycle progressed, some big coronal holes were seen in 2015 and 2016 (see the annual STCE reviews at http://www.stce.be/highlights ), with the equatorial extensions of the polar coronal holes becoming somewhat smaller and less pronounced during 2017. The polar coronal holes are again well reformed now, but they differ from their predecessors at the beginning of the solar cycle at one crucial point: they are of opposite magnetic polarity, as can be seen in these drawings from NOAA/SWPC (https://www.swpc.noaa.gov/products/solar-synoptic-map ; Top: January 2009; Bottom: April 2018), testifying again of the polar magnetic field reversal. Surely, those coronal holes have their say in the solar cycle!
PROBA2 Observations (9 Apr 2018 - 15 Apr 2018)
Solar Activity
Solar flare activity remained very low during the week.
In order to view the activity of this week in more detail, we suggest to go to the following website from which all the daily (normal and difference) movies can be accessed: http://proba2.oma.be/ssa
This page also lists the recorded flaring events.
A weekly overview movie can be found here (SWAP week 420): http://proba2.oma.be/swap/data/mpg/movies/weekly_movies/weekly_movie_2018_04_09.mp4
Details about some of this week's events, can be found further below.
If any of the linked movies are unavailable they can be found in the P2SC movie repository here:
http://proba2.oma.be/swap/data/mpg/movies/
Wednesday Apr 11
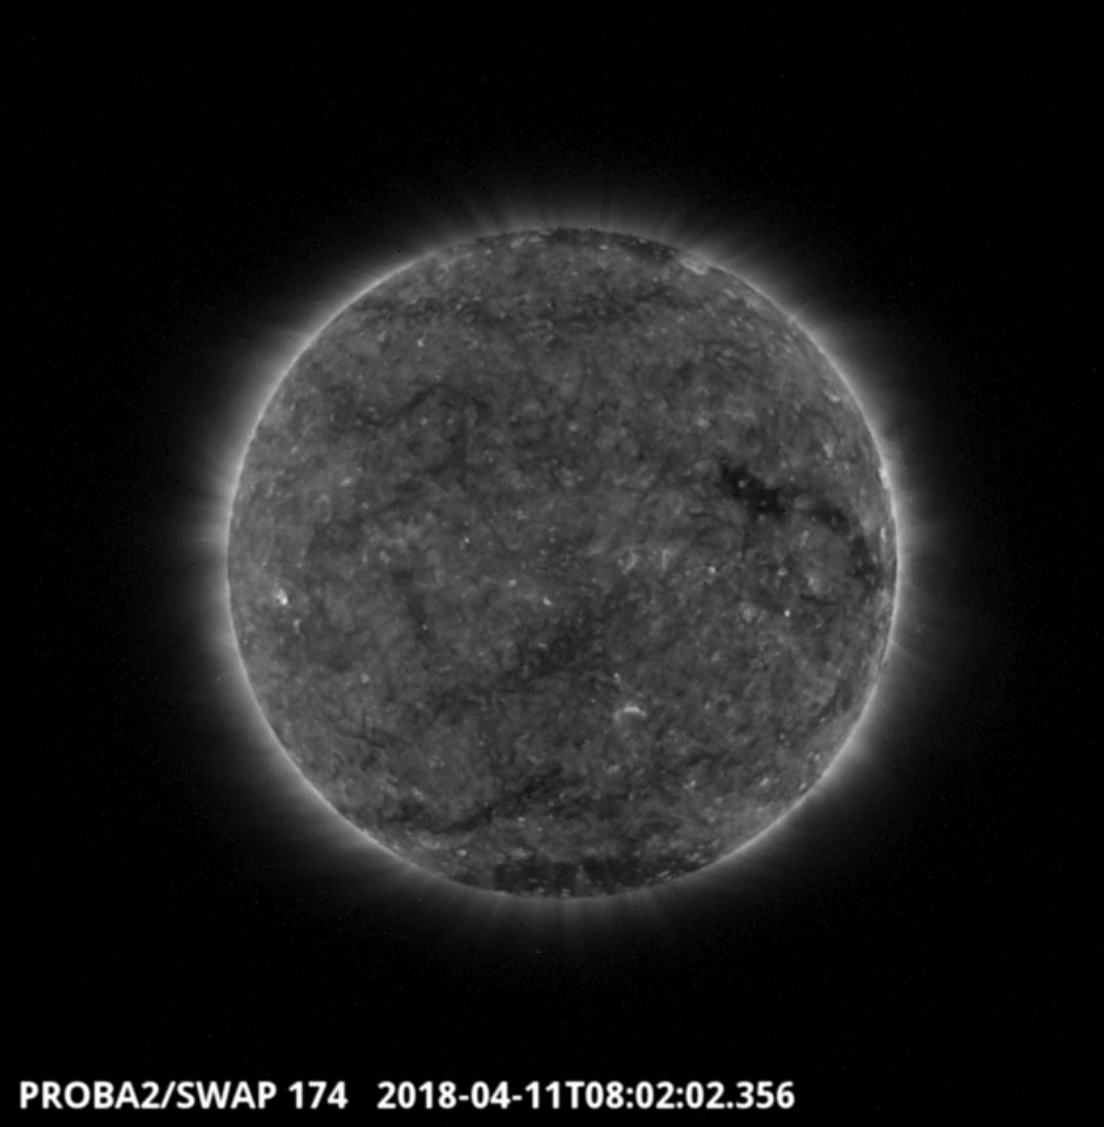
Flows on the west limb of of the Sun were observed by SWAP on 2018-Apr-11, shown in the SWAP image above at 08:02 UT.
Find a movie of the event here (SWAP movie): http://proba2.oma.be/swap/movies/20180411_swap_movie.mp4 and here (SWAP difference movie): http://proba2.oma.be/swap/movies/20180411_swap_diff.mp4
Sunday Apr 15
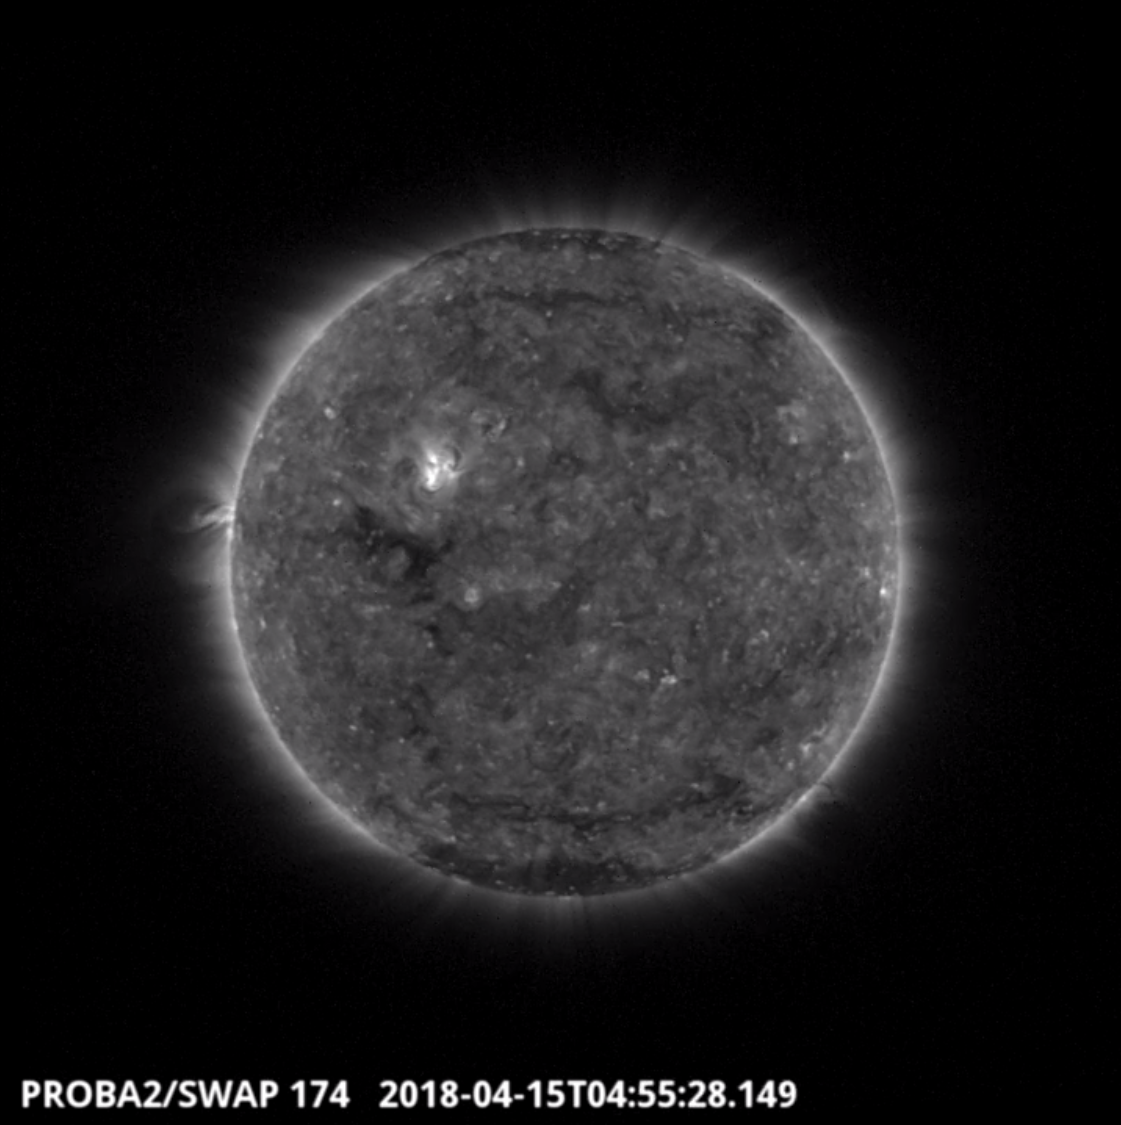
An eruption was observed by SWAP on the east limb of of the Sun on 2018-Apr-15, shown in the SWAP image above at 04:55 UT.
Find a movie of the event here (SWAP movie): http://proba2.oma.be/swap/movies/20180415_swap_movie.mp4
Review of solar activity
The solar activity was low over the past week. The visible solar disc was mostly spotless and no significant flare has been recorded.
On April 13, a small sunspot (NOAA active region 2704) emerged in the North-East quadrant of the visible disc. It already started to decay on its second day on April 15.
On April 9, a bipolar sunspot appeared for a very short time (less than a day) at high latitude (31 degree) in the South of the hemisphere. This sunspot showed an opposite polarity with respect to the current solar cycle, which indicate that it belonged to the next solar cycle (SC 25). For more information on this sunspot, see http://www.stce.be/newsletter/html/2018/STCEnews20180413.html#1.
No Earth directed Coronal Mass Ejection has been observed and the greater than 10 MeV solar protons flux remained at nominal levels over the week.
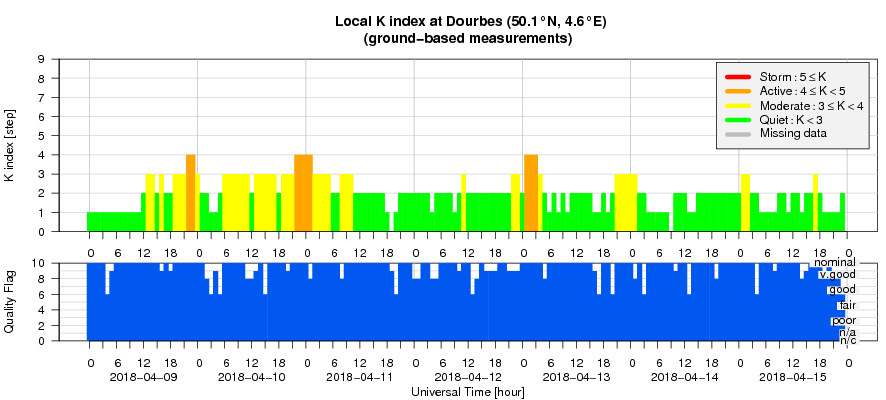
Review of geomagnetic activity
Space weather impacts were dominated by the arrival of the solar wind associated with the equatorial Coronal Hole (which reached the central meridian on April 05). The interplanetary magnetic field increased suddenly due to the arrival of a Co-rotating Interaction Region on April 09. The magnetic field reached magnitudes of 9.5 nT at 02:25 UT on April 10 and the Bz component fluctuated between -8.2 and +7.5 nT with prolonged periods of southward direction between 13:10 and 21:30 UT on April 09, and between 01:45 and 09:28 UT on April 10. The solar wind speed reached a maximum of 610 km/s on April 09 at 08:20 UT, then it showed a long and slow decay and reached the nominal values around 300 km/s at the end of the week on April 15.
The geomagnetic field was disturbed due to the arrival of the solar wind associated with the Coronal Hole on April 09. NOAA reported active conditions and a minor storm (Kp=5) on April 11, while Dourbes stations observed several short active periods (K=4) on April 09, 10 and 12. From April 13 the geomagnetic conditions returned to nominal.
The SIDC space weather Briefing
The Space Weather Briefing presented by the forecaster on duty from April 9 to 15. It reflects in images and graphs what is written in the Solar and Geomagnetic Activity report.
movie of CME, 11/04, 01:48 UT: http://www.stce.be/briefings/1_CME.mp4
movie of CME, 14/04, 19:24 UT: http://www.stce.be/briefings/2_CME2c3.mp4
movie of CME, 15/04, 00:12 UT: http://www.stce.be/briefings/3_CMEc4.mp4
movie of CME, 15/04, 05:12 UT: http://www.stce.be/briefings/4_CMEc5.mp4
pdf version of the briefing: http://www.stce.be/briefings/SIDCbriefing-20180416.pdf
The International Sunspot Number
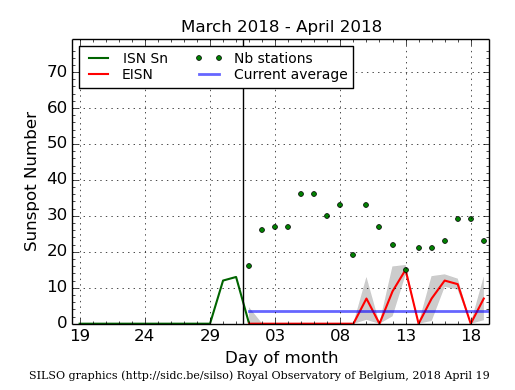
The daily Estimated International Sunspot Number (EISN, red curve with shaded error) derived by a simplified method from real-time data from the worldwide SILSO network. It extends the official Sunspot Number from the full processing of the preceding month (green line). The plot shows the last 30 days (about one solar rotation). The horizontal blue line shows the current monthly average, while the green dots give the number of stations included in the calculation of the EISN for each day.
Geomagnetic Observations at Dourbes (9 Apr 2018 - 15 Apr 2018)
Review of ionospheric activity (9 Apr 2018 - 15 Apr 2018)
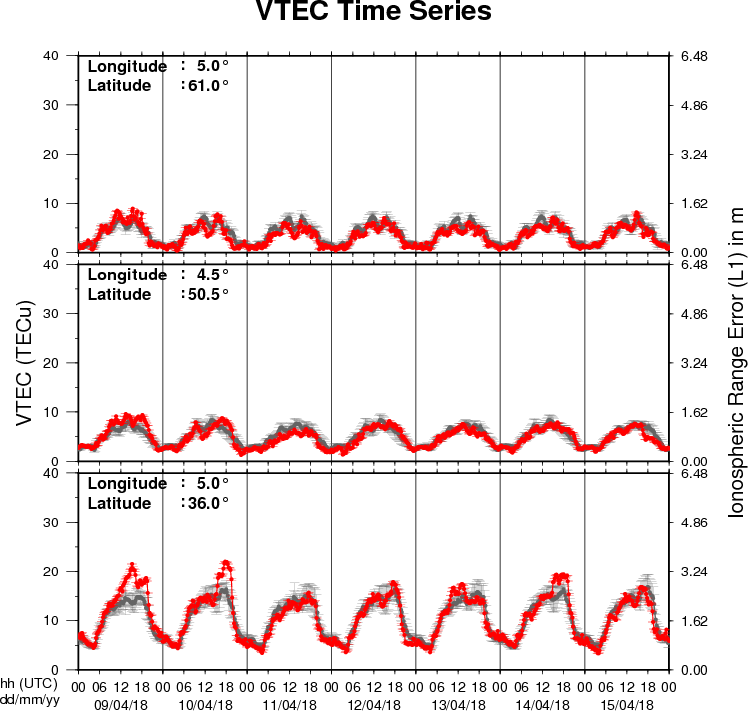
The figure shows the time evolution of the Vertical Total Electron Content (VTEC) (in red) during the last week at three locations:
a) in the northern part of Europe(N61°, 5°E)
b) above Brussels(N50.5°, 4.5°E)
c) in the southern part of Europe(N36°, 5°E)
This figure also shows (in grey) the normal ionospheric behaviour expected based on the median VTEC from the 15 previous days.
The VTEC is expressed in TECu (with TECu=10^16 electrons per square meter) and is directly related to the signal propagation delay due to the ionosphere (in figure: delay on GPS L1 frequency).
The Sun's radiation ionizes the Earth's upper atmosphere, the ionosphere, located from about 60km to 1000km above the Earth's surface.The ionization process in the ionosphere produces ions and free electrons. These electrons perturb the propagation of the GNSS (Global Navigation Satellite System) signals by inducing a so-called ionospheric delay.
See http://stce.be/newsletter/GNSS_final.pdf for some more explanations ; for detailed information, see http://gnss.be/ionosphere_tutorial.php