- Table of Content
- 1.CMEs and their...
- 2.Review of sola...
- 3.PROBA2 Observa...
- 4.The Internatio...
- 5.Review of geom...
- 6.Geomagnetic Ob...
- 7.The SIDC Space...
- 8.Review of iono...
2. Review of solar activity
3. PROBA2 Observations (2 Jul 2018 - 8 Jul 2018)
4. The International Sunspot Number
5. Review of geomagnetic activity
6. Geomagnetic Observations at Dourbes (2 Jul 2018 - 8 Jul 2018)
7. The SIDC Space Weather Briefing
8. Review of ionospheric activity (2 Jul 2018 - 8 Jul 2018)
CMEs and their stories
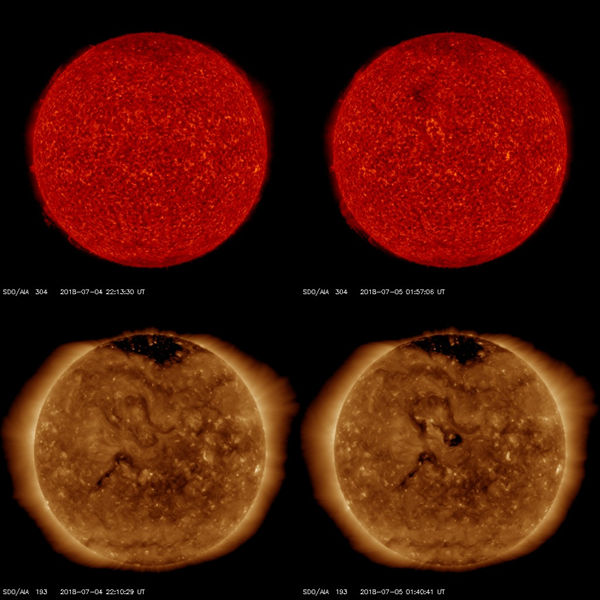
Late on 4 July, a filament eruption took place near the solar disk centre. No x-ray flare was recorded, but SDO/AIA 304 imagery (temperatures of about 80.000 degrees; inner solar atmosphere) showed some weak flare ribbons, whereas the SDO/AIA 193 images (temperatures of about 1.25 million degrees; hot outer solar atmosphere) revealed post-eruption coronal loops, as well as obvious coronal dimmings ("transient coronal holes") indicating that a plasma cloud had been ejected. See the images underneath about 1.5 hours before and after the start of the eruption.
The coronagraphs onboard the SOHO spacecraft (https://sohowww.nascom.nasa.gov/ ) did not catch the associated coronal mass ejection (CME). However, thanks to STEREO-A (https://stereo-ssc.nascom.nasa.gov/ ), a satellite currently observing the Sun from about 21 degrees behind the eastern solar limb as seen from Earth (see chart underneath for location of STEREO-A ("A") and Earth), a very slow and narrow CME could be seen leaving the Sun starting at around 03:24UT on 5 July. According to CACTus (https://secchi.nrl.navy.mil/cactus/ ), the CME had a plane-of-the-sky speed of only 183 km/s and a width of 36 degrees. It is very likely this weak CME had an earth-directed component.
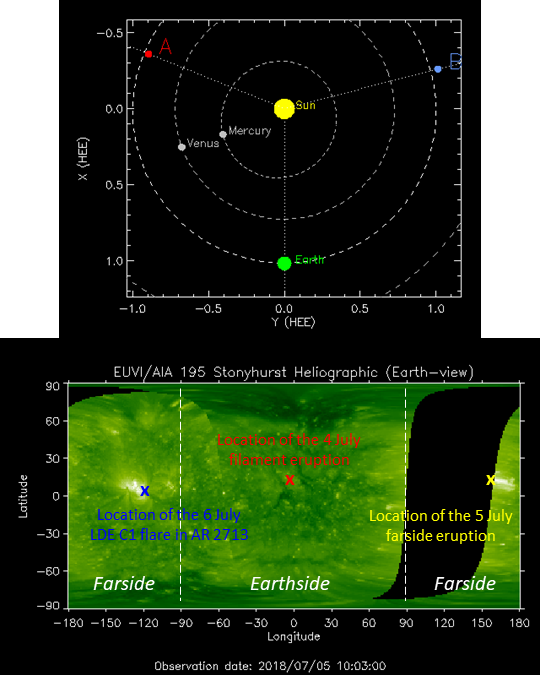
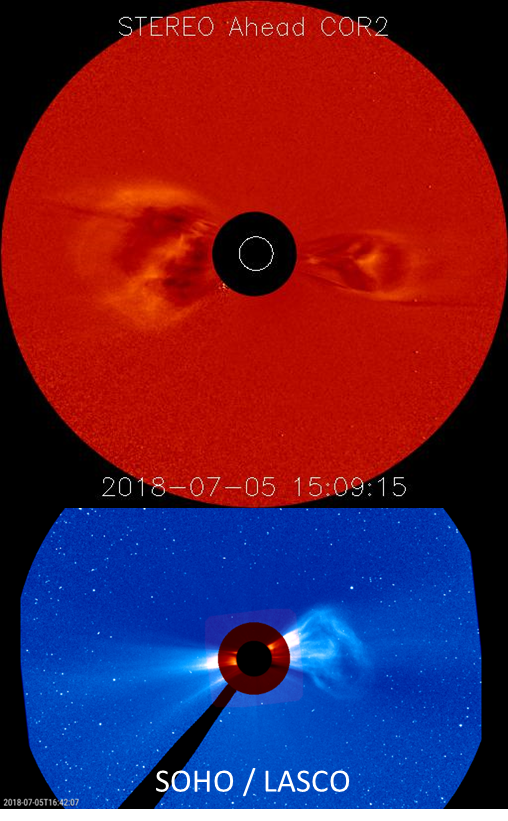
Around 10:30UT on the same day (5 July), the EUVI (Extreme Ultraviolet Imager) onboard STEREO-A recorded some coronal dynamics near its east limb. This position clearly indicated that this was a farside event (see map above), explaining why the event left no x-ray signature in the x-ray flux as observed by the GOES satellite. The associated CME was the most obvious of the week, with a plane-of-the-sky speed around 400 km/s and a width of about 90 degrees (CACTus: http://www.sidc.oma.be/cactus/ ). This CME was clearly not directed to Earth. In the coronagraphic imagery underneath, this CME can be seen in ST-A images (top) moving to the left, and in SOHO/LASCO images (bottom) moving to the right. The CME moving to the right in the STEREO-A image is the slow-moving CME from early on 5 July which is still in the coronagraph's field-of-view.
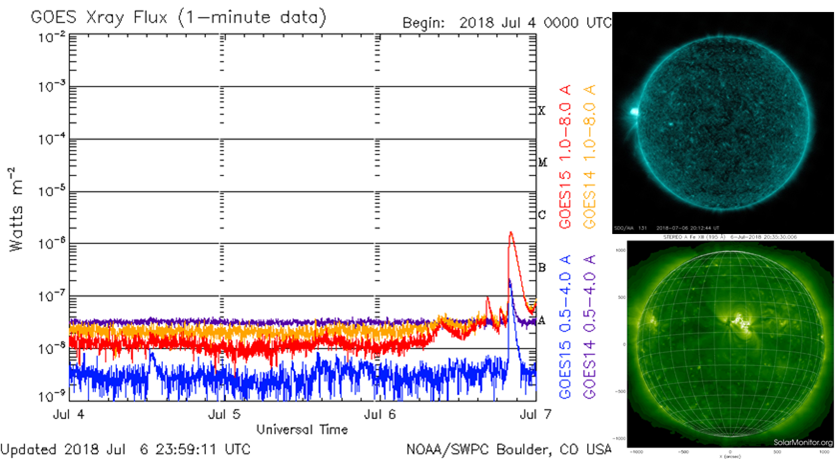
On 6 July, the GOES spacecraft (https://www.swpc.noaa.gov/products/goes-x-ray-flux ) registered a long duration C1 flare, the first C-class flare since 6 June. SDO images (https://sdo.gsfc.nasa.gov/ ) indicated the flare having its source behind the east limb, and this was indeed confirmed by STEREO-A which shows some brightening in the leading portion of a bright active region. This was decaying active region NOAA 2713, which had nearly completed its farside transit at that time, but was still some 10 to 20 degrees behind the east limb as seen from Earth. As seen from STEREO-A, the eruption took place near its central meridian.
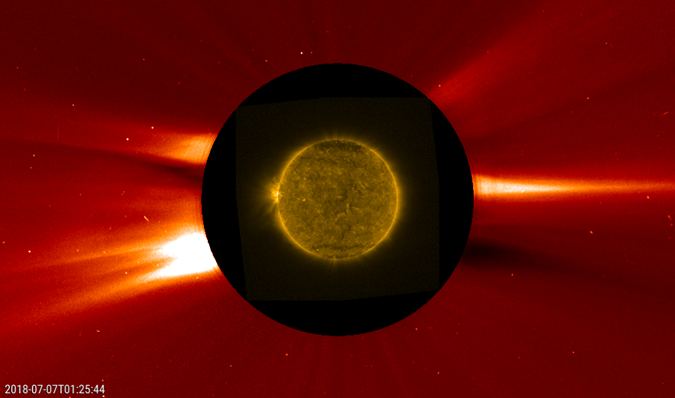
No obvious coronal dimming seems to have been associated with this C1 flare, but a faint CME was observed in LASCO coronagraphic imagery (not detected by LASCO). The picture underneath combines PROBA2/SWAP imagery (http://proba2.oma.be/ssa ) with SOHO/LASCO-C2 images. The CME is best visible in the short movie clip at http://www.stce.be/news/430/welcome.html , which contains several other animations on the aforementioned events. The slow-moving CME is faintly visible from around 00UT till 03UT on 7 July, moving to the east (to the left in the images).
Review of solar activity
Over the past week solar activity was very low to low. No significant flares have been recorded. No numbered Active Regions (ARs) were seen on the solar disk. However, a recurrent AR started to rotate onto the east solar limb on 07 July 2018. It had produced a C1.6 class flare peaking at 20:07UT on 6 July (the largest of the week). The greater than 10 MeV proton flux remained at background levels throughout the week. There was one small earth-directed coronal mass ejection (CME) seen in STEREO COR2-A observations (not in LASCO). Its source was a filament eruption near the earth-facing disk-centre late on 4 July. The eruption is expected to have a negligible impact on the Earth system. The approximate arrival will be on 10 July 2018. There were no significant coronal holes on the solar disk, however a region of small "patchy" coronal holes was located at low latitudes. The recurrent AR has the potential to produce further low-level flaring activity throughout the coming week.
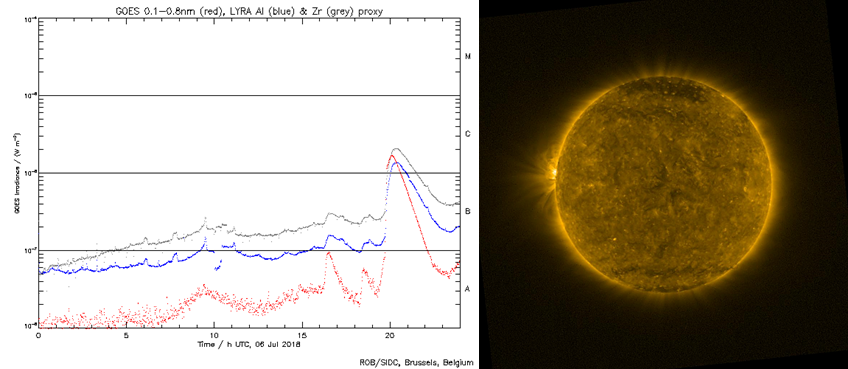
The picture underneath on the left shows the C1 flare as recorded by the PROBA2/LYRA instrument (grey and blue curves; the red data points are GOES). On the right is an image by PROBA2/SWAP showing the coronal loops from the active region (old NOAA 2713) while it was still behind the east limb.
PROBA2 Observations (2 Jul 2018 - 8 Jul 2018)
Solar Activity
Solar flare activity fluctuated between very low and low during the week.
In order to view the activity of this week in more detail, we suggest to go to the following website from which all the daily (normal and difference) movies can be accessed: http://proba2.oma.be/ssa
This page also lists the recorded flaring events.
A weekly overview movie can be found here (SWAP week 432): http://proba2.oma.be/swap/data/mpg/movies/weekly_movies/weekly_movie_2018_07_02.mp4
Details about some of this week's events, can be found further below.
If any of the linked movies are unavailable they can be found in the P2SC movie repository here: http://proba2.oma.be/swap/data/mpg/movies/
Friday Jul 06
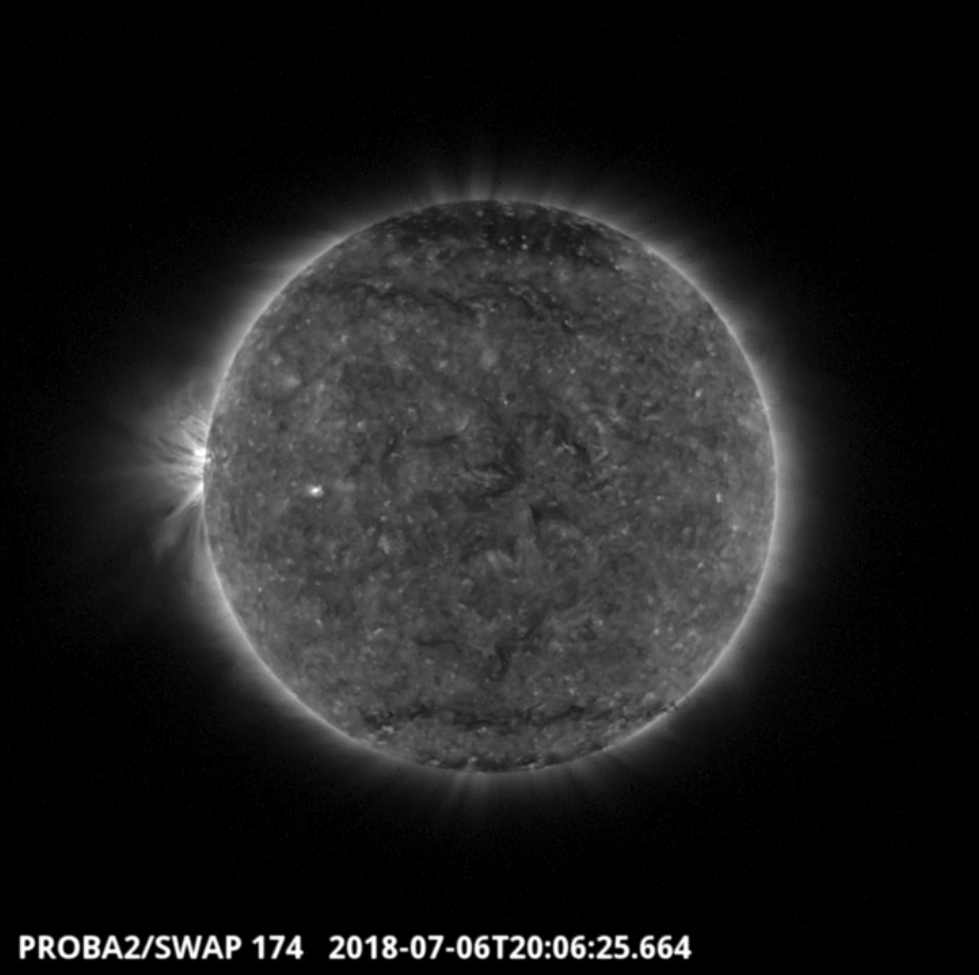
The largest flare of the week (C1.6) was observed by SWAP on the east limb of the Sun on 2018-Jul-06. This is shown in the SWAP image above at 20:06 UT.
Find a movie of the event here (SWAP movie): http://proba2.oma.be/swap/movies/20180706_swap_movie.mp4
The International Sunspot Number
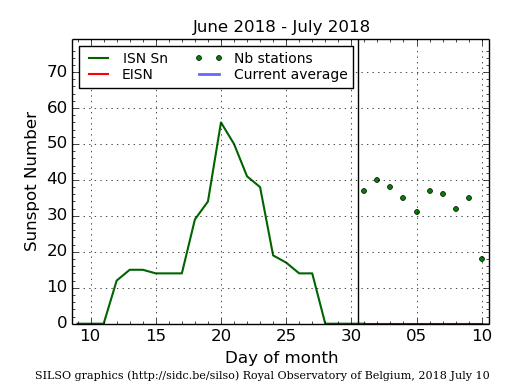
The daily Estimated International Sunspot Number (EISN, red curve with shaded error) derived by a simplified method from real-time data from the worldwide SILSO network. It extends the official Sunspot Number from the full processing of the preceding month (green line). The plot shows the last 30 days (about one solar rotation). The horizontal blue line shows the current monthly average, while the green dots give the number of stations included in the calculation of the EISN for each day.
Review of geomagnetic activity
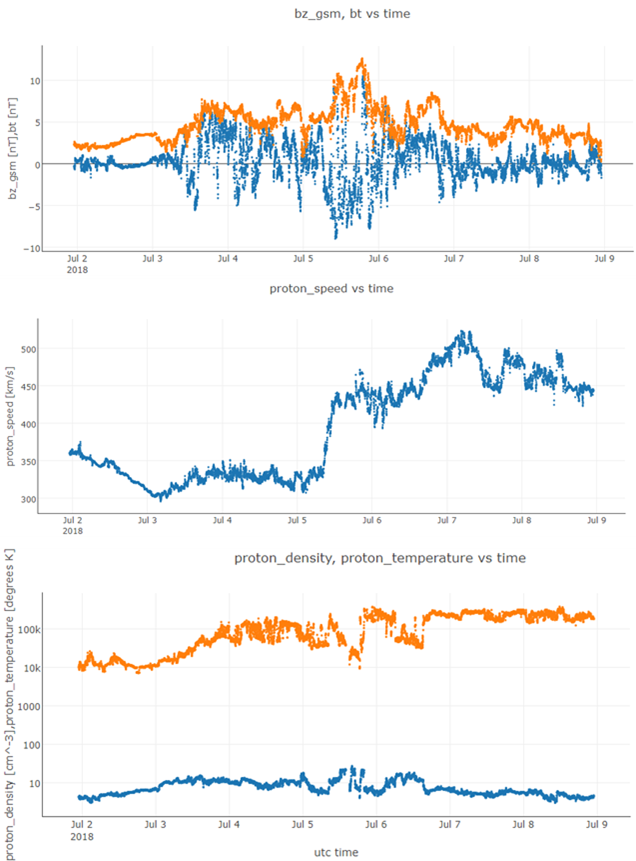
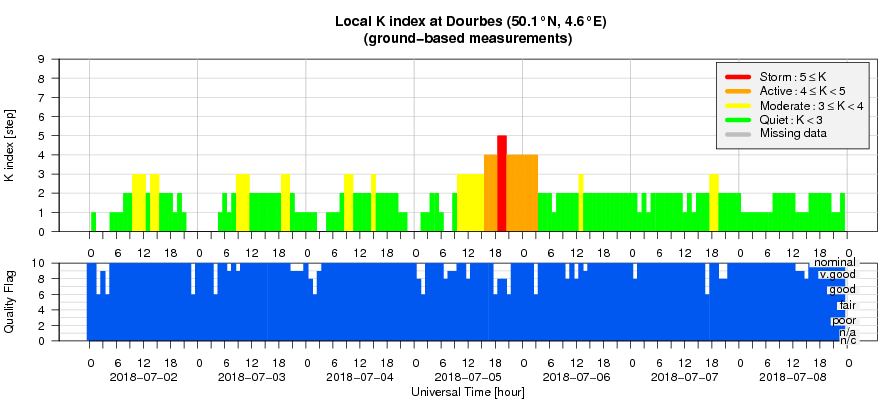
At the start of the week the solar wind speed fluctuated around 330 km/s but jumped to around 450 km/s on 5 July 2018. The jump is believed to be attributed to a region of small "patchy" coronal holes and a possible sector boundary crossing that resulted in fluctuating solar wind conditions. The total magnetic field strength fluctuated between 2 and 12 nT, peaking on 5 July 2018. The Bz component has fluctuated mostly between -7 and +10 nT. Geomagnetic conditions ranged between Kp index 0-5 (NOAA) and local K index 0-5 (Dourbes), peaking on 5 July 2018 with the enhanced solar wind speeds and negative Bz. Solar wind conditions are expected to be quiet next week, with possible small enhancements from small low latitude coronal holes.
The plots underneath show the solar wind parameters as observed by DSCOVR for the week from 2 till 8 July (Bz and Bt, solar wind speed, temperature and density). They were created at the DSCOVR Space Weather Data Portal (https://www.ngdc.noaa.gov/dscovr/portal/index.html#/ ).
Geomagnetic Observations at Dourbes (2 Jul 2018 - 8 Jul 2018)
The SIDC Space Weather Briefing
The Space Weather Briefing presented by the forecaster on duty from 2 July till 8 July. It reflects in images and graphs what is written in the Solar and Geomagnetic Activity reports. A .wmv version can be found at http://stce.be/movies/20180709_SWbriefing_FINAL.wmv A pdf version is available at http://stce.be/movies/20180709_SWbriefing_FINAL.pdf
Review of ionospheric activity (2 Jul 2018 - 8 Jul 2018)
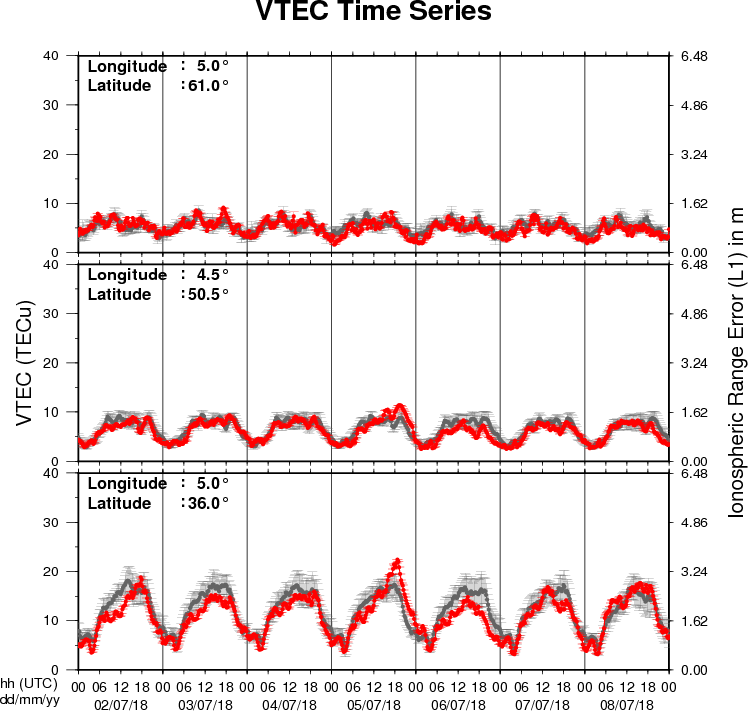
The figure shows the time evolution of the Vertical Total Electron Content (VTEC) (in red) during the last week at three locations:
a) in the northern part of Europe(N61°, 5°E)
b) above Brussels(N50.5°, 4.5°E)
c) in the southern part of Europe(N36°, 5°E)
This figure also shows (in grey) the normal ionospheric behaviour expected based on the median VTEC from the 15 previous days.
The VTEC is expressed in TECu (with TECu=10^16 electrons per square meter) and is directly related to the signal propagation delay due to the ionosphere (in figure: delay on GPS L1 frequency).
The Sun's radiation ionizes the Earth's upper atmosphere, the ionosphere, located from about 60km to 1000km above the Earth's surface.The ionization process in the ionosphere produces ions and free electrons. These electrons perturb the propagation of the GNSS (Global Navigation Satellite System) signals by inducing a so-called ionospheric delay.
See http://stce.be/newsletter/GNSS_final.pdf for some more explanations ; for detailed information, see http://gnss.be/ionosphere_tutorial.php