- Table of Content
- 1.On spotless st...
- 2.Review of sola...
- 3.The Internatio...
- 4.PROBA2 Observa...
- 5.Review of geom...
- 6.Geomagnetic Ob...
- 7.The SIDC Space...
- 8.Review of iono...
2. Review of solar activity
3. The International Sunspot Number
4. PROBA2 Observations (16 Jul 2018 - 22 Jul 2018)
5. Review of geomagnetic activity
6. Geomagnetic Observations at Dourbes (16 Jul 2018 - 22 Jul 2018)
7. The SIDC Space Weather Briefing
8. Review of ionospheric activity (16 Jul 2018 - 22 Jul 2018)
On spotless stretches
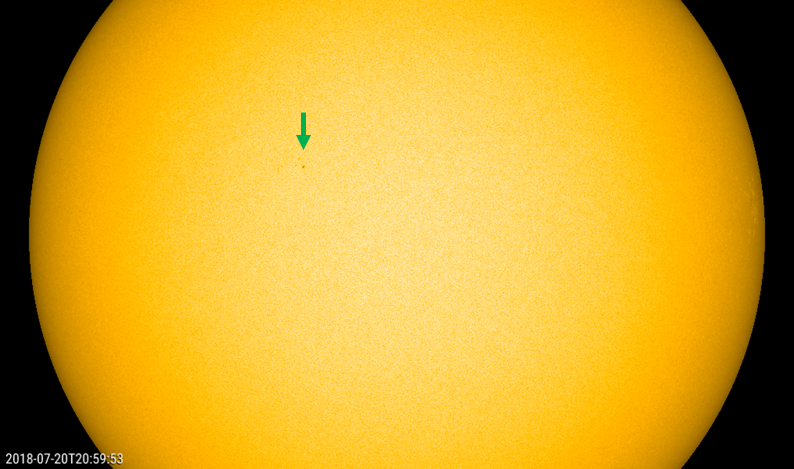
A genuine sunspot seems to have been observed on 21 July by a number of solar observers such as at USET (http://www.sidc.be/uset/ ), Kanzelhöhe (http://cesar.kso.ac.at/ ) and Mount Wilson (http://obs.astro.ucla.edu/intro.html ). The spot was numbered by NOAA as active region NOAA 2716, but the current estimated international sunspot number (EISN - http://sidc.oma.be/silso/ ) is still 0. This indicates that a number of observers with smaller instruments did not observe it, despite the spot being significantly larger and darker than similar features observed on 13-14-15 July (see the previous STCE Newsitem at http://www.stce.be/news/431/welcome.html ). NOAA 2716 was visible for about a day, from about 18UT on 20 July till 21UT on 21 July, being best observable late on 20 and early on 21 July.
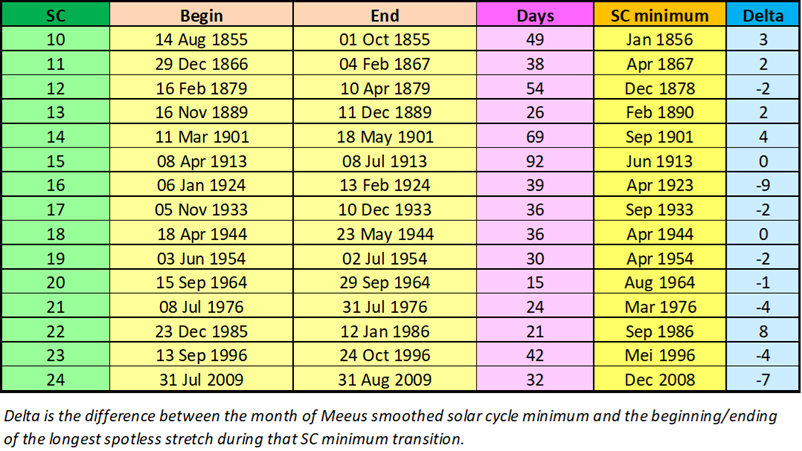
If the final international sunspot number is not 0 for 21 July, then it will end a spotless stretch that started on 28 June and as such would have lasted for 23 days. This would be the longest interval with no sunspots for the current solar cycle transition, with the 15 days from 6-20 March 2017 being the previous record holder (see this STCE Newsitem at http://www.stce.be/news/382/welcome.html ). It is an interesting feature of solar cycles that the longest spotless stretch takes place within about 3-4 months of the actual solar cycle minimum, with an uncertainty of 3 months (see the table underneath). It means that IF the observed stretch is indeed the longest one of the current solar cycle transition, then solar cycle minimum can be expected somewhere in 2018, confirming previous signs that we may be in for an early minimum (see e.g. this STCE Newsitem at http://www.stce.be/news/417/welcome.html ). Of course, we don't know if this was the longest stretch until solar cycle 25 (SC25) is really on the rise, so the foregoing prediction is only valid until the next even longer spotless stretch...
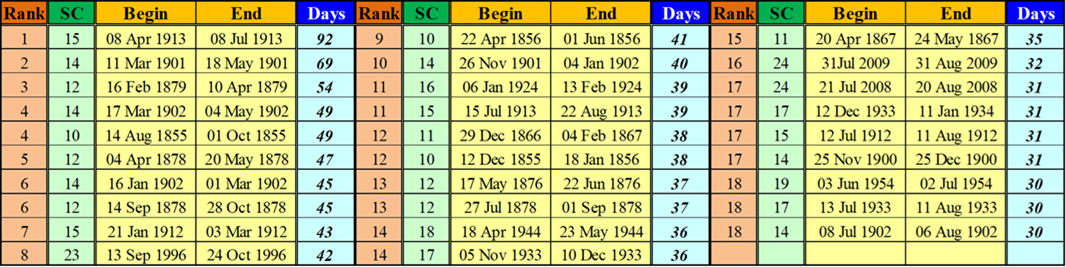
The table below shows all periods with 30 or more consecutive spotless days since 1849. The current solar cycle transition has no entries (yet) in this table. The data are from the SILSO network (http://sidc.oma.be/silso/ ), and may differ from other observational networks. It is interesting to note that the longest spotless stretch during the SC23-SC24 transition was the most recent one to make it into this table. It is also clear that during the current transition, we are still far from the record set in 1913, when there were 92 consecutive spotless days!
Review of solar activity
During this week, there was only one active region observed on the visible side of the solar disk. Active region NOAA 2716 emerged late on 20 July, and was numbered by NOAA on 22 July. The region had already decayed by the end of 21 July without being a source of significant flaring activity. Solar flaring activity was extremely low this week with no C-class flares and not even B-class flares reported. There were no wide or earth-directed coronal mass ejections (CMEs) observed and the solar proton flux was at the background level for the entire week.
Two equatorial coronal holes were observed this week. The first equatorial coronal hole was patchy and seemed to be connected to the low latitude extension of the northern polar coronal hole. It reached the central meridian in the morning of 16 July. The second coronal hole was larger, located near the equator, and appeared to have connections with the southern polar coronal hole. It reached the central meridian in the early morning of 21 July. The associated fast solar wind is expected to arrive at the Earth around noon of 24 July.
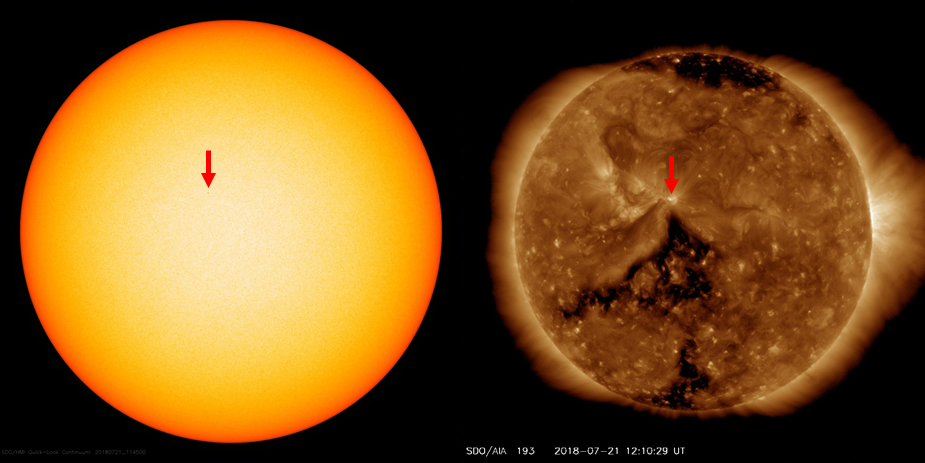
In the SDO imagery underneath, NOAA 2716 is a barely visible speck in white light on 21 July (left; indicated by the red arrow) and appears to be located just north of the negative polarity equatorial coronal hole (right; extreme ultraviolet image by SDO/AIA 193).
The International Sunspot Number
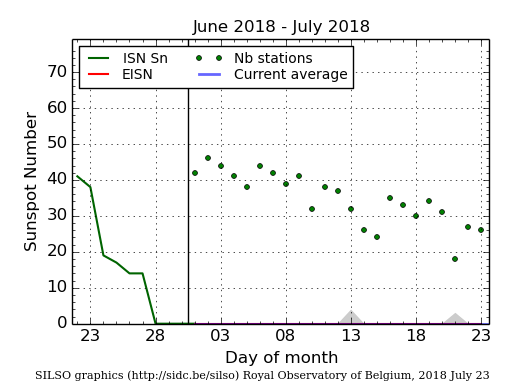
The daily Estimated International Sunspot Number (EISN, red curve with shaded error) derived by a simplified method from real-time data from the worldwide SILSO network. It extends the official Sunspot Number from the full processing of the preceding month (green line). The plot shows the last 30 days (about one solar rotation). The horizontal blue line shows the current monthly average, while the green dots give the number of stations included in the calculation of the EISN for each day. Due to the persistent low solar activity so far in July, the red and blue curves coincide (sunspot number = 0).
PROBA2 Observations (16 Jul 2018 - 22 Jul 2018)
Solar Activity
Solar flare activity remained very low during the week.
In order to view the activity of this week in more detail, we suggest to go to the following website from which all the daily (normal and difference) movies can be accessed: http://proba2.oma.be/ssa .
This page also lists the recorded flaring events.
A weekly overview movie can be found here (SWAP week 434): http://proba2.oma.be/swap/data/mpg/movies/weekly_movies/weekly_movie_2018_07_16.mp4
Details about some of this week's events, can be found further below.
If any of the linked movies are unavailable they can be found in the P2SC movie repository here: http://proba2.oma.be/swap/data/mpg/movies/
Friday Jul 20
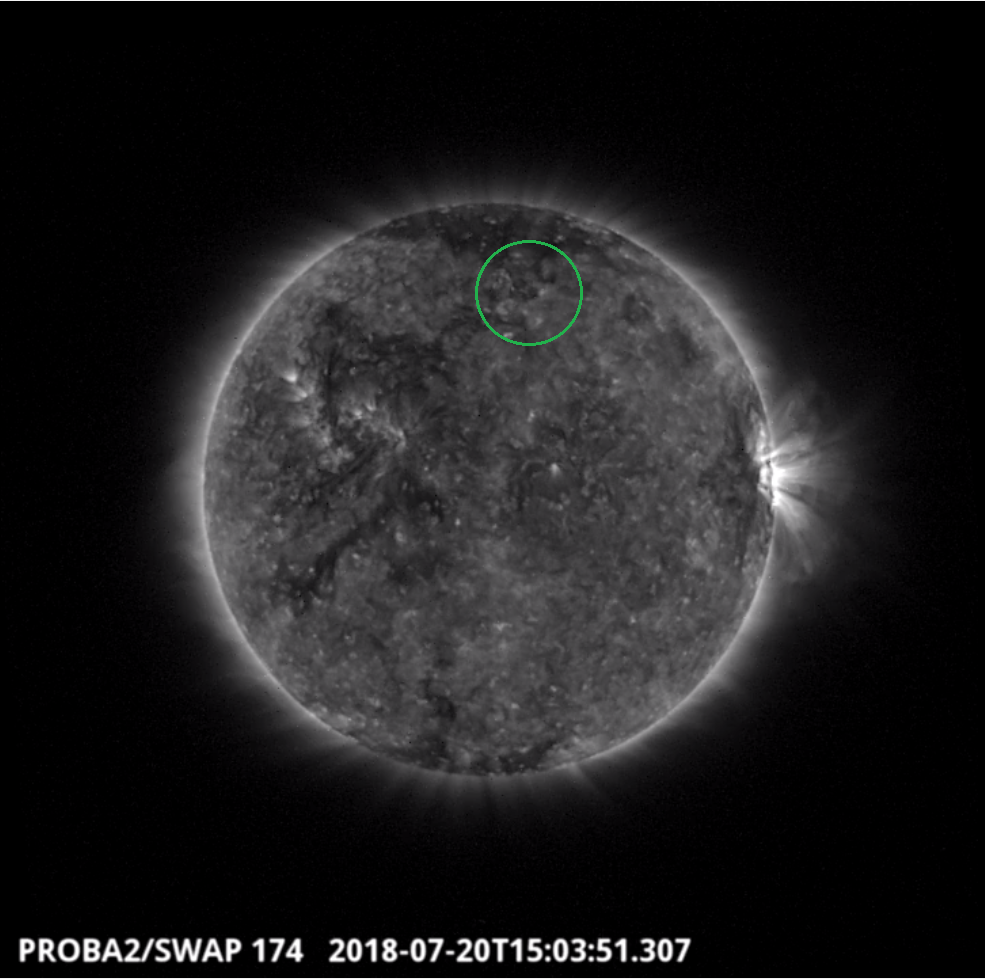
The growth of a small dimming was observed by SWAP in the north of the solar disk on 2018-Jul-20. This is shown in the SWAP image above at 15:03 UT.
Find a movie of the event here (SWAP movie): http://proba2.oma.be/swap/movies/20180720_swap_movie.mp4
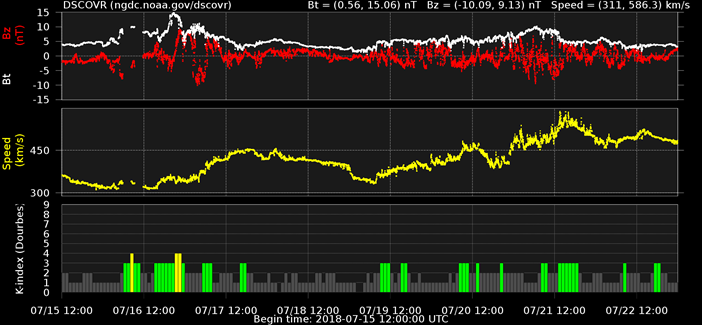
Review of geomagnetic activity
In the beginning of the week, on 16 and 17 July, the interplanetary magnetic field magnitude was somewhat elevated (up to 15 nT). The observed changes in the in situ parameters indicated the arrival of a sector boundary accompanied with the magnetic structure having low variance of the magnetic field. The associated longer interval of the negative value of the Bz component of the interplanetary magnetic field (down to -10 nT) induced disturbed geomagnetic conditions on 16 July. The local station at Dourbes reported two intervals of K = 4, while NOAA reported only unsettled geomagnetic conditions (Kp = 3).
The fast solar wind associated with the equatorial coronal hole which reached the central meridian on 16 July, arrived at Earth in the evening of 20 July. Maximum solar wind speed of about 580 km/s was reached on 21 July around 16:00 UT. Except for the isolated intervals of disturbed geomagnetic conditions on 16 July, during the rest of the week mostly quiet geomagnetic conditions were recorded with several unsettled intervals.
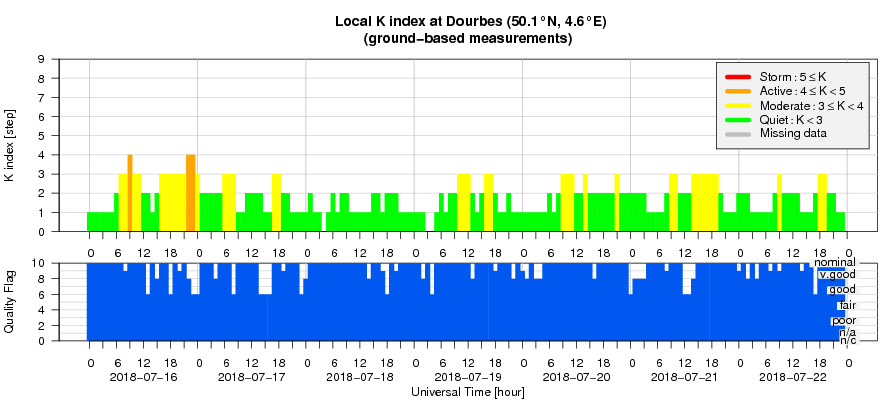
Geomagnetic Observations at Dourbes (16 Jul 2018 - 22 Jul 2018)
The SIDC Space Weather Briefing
The Space Weather Briefing presented by the forecaster on duty from 16 July till 8 July. It reflects in images and graphs what is written in the Solar and Geomagnetic Activity reports. A .wmv version can be found at http://stce.be/movies/SIDCbriefing_20180716_0722.wmv A pdf version is available at http://stce.be/movies/SIDCbriefing_20180716_0722.pdf

Review of ionospheric activity (16 Jul 2018 - 22 Jul 2018)
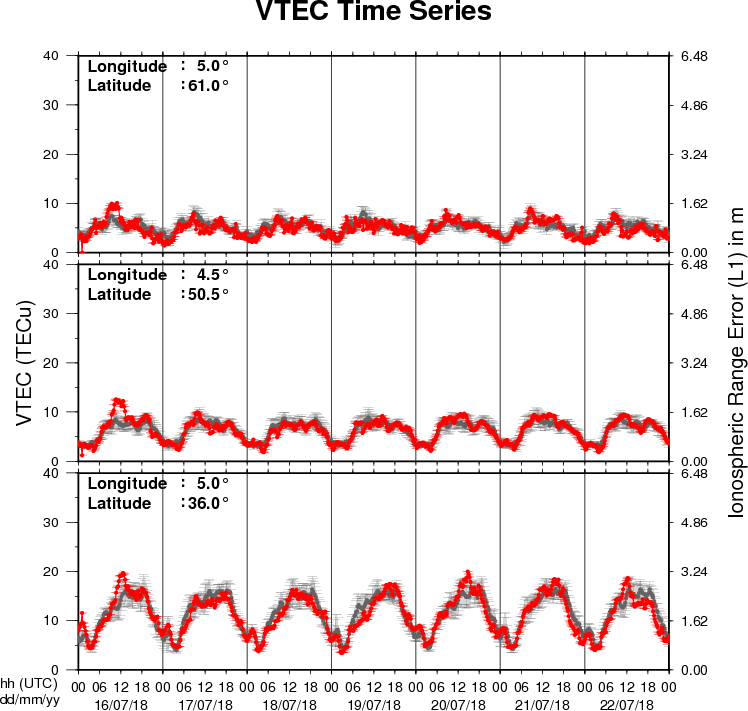
The figure shows the time evolution of the Vertical Total Electron Content (VTEC) (in red) during the last week at three locations:
a) in the northern part of Europe(N61°, 5°E)
b) above Brussels(N50.5°, 4.5°E)
c) in the southern part of Europe(N36°, 5°E)
This figure also shows (in grey) the normal ionospheric behaviour expected based on the median VTEC from the 15 previous days.
The VTEC is expressed in TECu (with TECu=10^16 electrons per square meter) and is directly related to the signal propagation delay due to the ionosphere (in figure: delay on GPS L1 frequency).
The Sun's radiation ionizes the Earth's upper atmosphere, the ionosphere, located from about 60km to 1000km above the Earth's surface.The ionization process in the ionosphere produces ions and free electrons. These electrons perturb the propagation of the GNSS (Global Navigation Satellite System) signals by inducing a so-called ionospheric delay.
See http://stce.be/newsletter/GNSS_final.pdf for some more explanations ; for detailed information, see http://gnss.be/ionosphere_tutorial.php