- Table of Content
- 1.Spectacular so...
- 2.Talking about ...
- 3.PROBA2 Observa...
- 4.Review of sola...
- 5.The SIDC space...
- 6.The Internatio...
- 7.Geomagnetic Ob...
- 8.Review of iono...
2. Talking about solar eclipses
3. PROBA2 Observations (30 Jul 2018 - 5 Aug 2018)
4. Review of solar and geomagnetic activity
5. The SIDC space weather Briefing
6. The International Sunspot Number
7. Geomagnetic Observations at Dourbes (30 Jul 2018 - 5 Aug 2018)
8. Review of ionospheric activity (30 Jul 2018 - 5 Aug 2018)
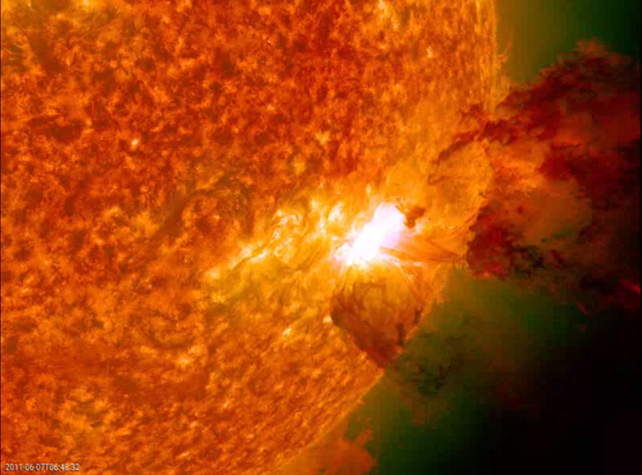
Spectacular solar eruptions during solar cycle 24
The Open Door days at the Space Pole will take place on 29 and 30 September 2018 (see the webpage at http://www.oma.be/index.php/en/open-days-2018 ). In preparation for this event, a movie has been created showing the most spectacular solar eruptions of solar cycle 24. A selection was made from the yearly highlights pages (http://www.stce.be/highlights ), and some movies were re-created using the advanced JHelioviewer software (http://www.jhelioviewer.org/ ). No less than 33 events were integrated in the movie, and most events are featuring several clips. The movie lasts for about 20 minutes, and its size is about 877 MB.
The movie can be found at:
- The website of the STCE: http://stce.be/movies/OD2018_v2_Movie.wmv
- This YouTube link: https://youtu.be/_5cf6Ai7ZA0
We hope that you enjoy watching this movie, and that we see you during the Open Door days!
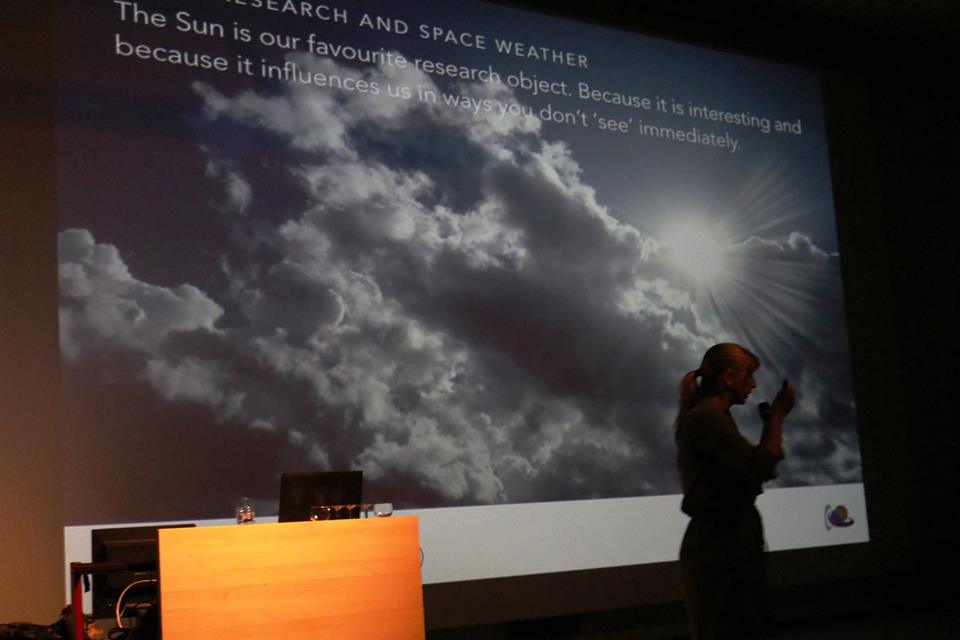
Talking about solar eclipses
The Solar Eclipse Conference 2018 was held in the cosmodrome in Genk, Belgium (http://www.sec2018.be). Sunday evening, it closed its doors after 3 days of enthusiastic people sharing their experience and knowledge on that amazing natural phenomena caused by solar and lunar teamwork.
The STCE was happy to tell how we want to dive into the hidden secrets of the atmosphere of our favourite study object, the Sun. With the ultimate coronagraph 'ASPIICS' onboard of Proba-3 and the EUV imager 'EUI' onboard Solar Orbiter we want to go into the solar corona where no researcher could look before.
PROBA2 Observations (30 Jul 2018 - 5 Aug 2018)
Solar Activity
Solar flare activity remained very low during the week.
In order to view the activity of this week in more detail, we suggest to go to the following website from which all the daily (normal and difference) movies can be accessed: http://proba2.oma.be/ssa
This page also lists the recorded flaring events.
A weekly overview movie can be found here (SWAP week 436): http://proba2.oma.be/swap/data/mpg/movies/weekly_movies/weekly_movie_2018_07_30.mp4
Details about some of this week's events, can be found further below.
If any of the linked movies are unavailable they can be found in the P2SC movie repository here: http://proba2.oma.be/swap/data/mpg/movies/
Thursday Aug 02
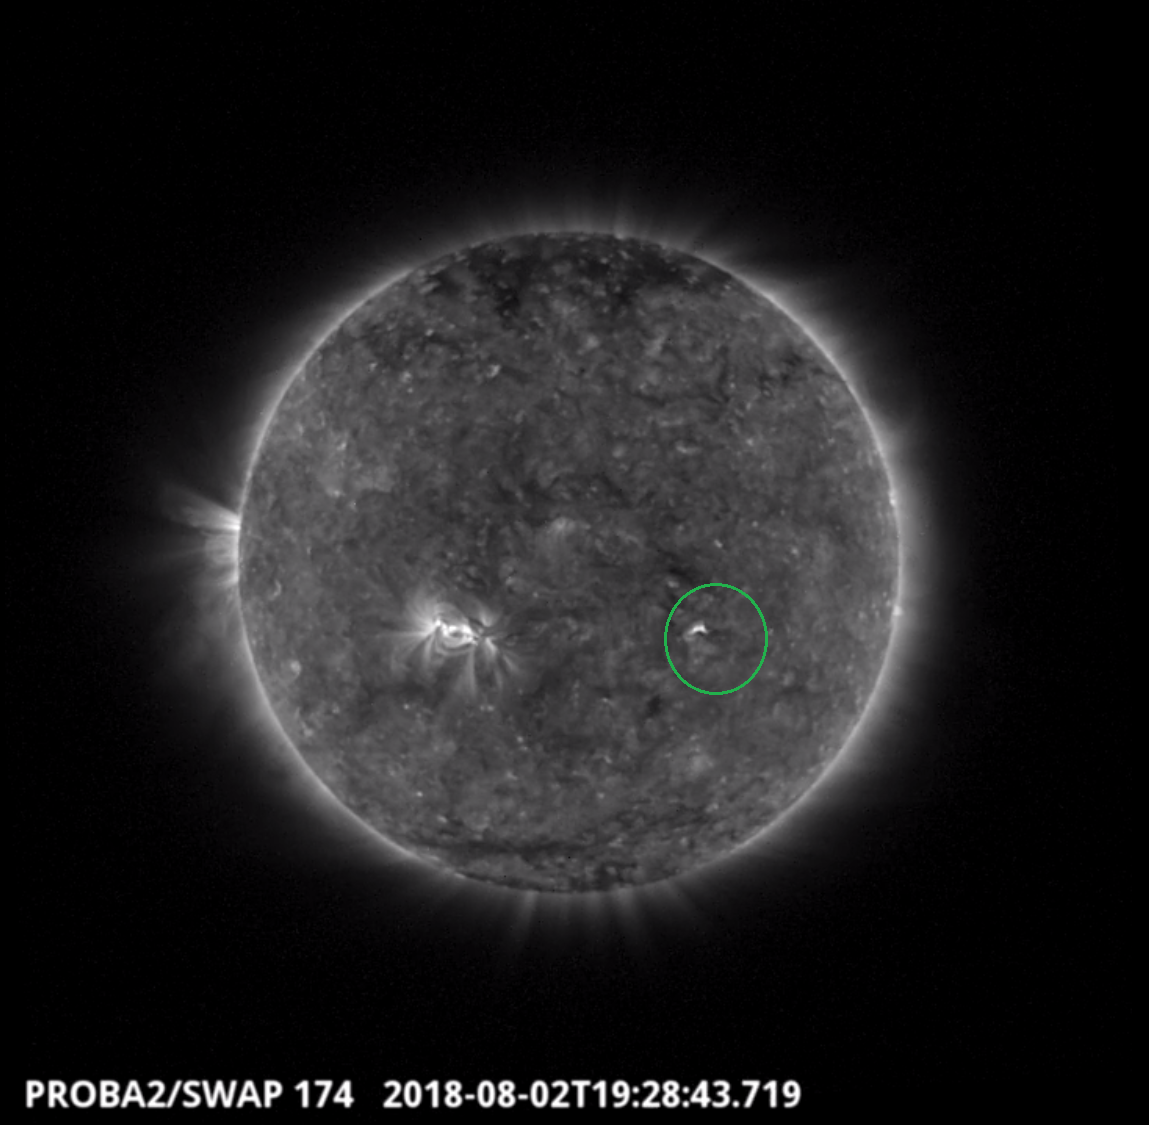
The growth of a small dimming was observed by SWAP in the south west of the solar disk on 2018-Aug-02. This is shown in the SWAP image above at 19:28 UT.
Find a movie of the event here (SWAP movie): http://proba2.oma.be/swap/movies/20180802_swap_movie.mp4
Review of solar and geomagnetic activity
Solar Activity
Solar activity was at very low levels. Only one small sunspot group was observed: NOAA 2717 on 1 and 2 August.
A small filament erupted near N10E20 on 31 July between 04 and 07UT, but the event was not associated with any coronal mass ejection (CME). No earth-directed CMEs were observed throughout the period.
The greater than 10 MeV proton flux was at nominal levels.
A small negative polarity coronal hole (CH) transited the central meridian on 31 July-01 August. A small positive polarity coronal hole (CH) transited the central meridian on 3-4 August.
Geomagnetic Activity
Solar wind speed varied between mostly 280 and 320 km/s until noon on 1 August, then between 330 and 450 km/s for the rest of the week. Bz varied between -8 and +8 nT. The direction of the interplanetary magnetic field (IMF) varied between 'towards' and 'away' from the Sun. Earth crossed the sector boundary on 5 August around 05UT, ending in a sector with a negative (towards the Sun) and more steady IMF. The geomagnetic conditions were quiet to unsettled throughout the period.
The SIDC space weather Briefing
The Space Weather Briefing presented by the forecaster on duty from July 30 to 5. It reflects in images and graphs what is written in the Solar and Geomagnetic Activity report.
A pdf: http://www.stce.be/briefings/SIDCbriefing-20180806.pdf
A movie: http://www.stce.be/briefings/SIDCbriefing_20180806.m4v
The International Sunspot Number
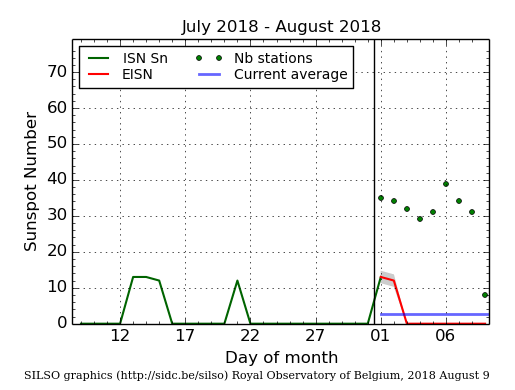
The daily Estimated International Sunspot Number (EISN, red curve with shaded error) derived by a simplified method from real-time data from the worldwide SILSO network. It extends the official Sunspot Number from the full processing of the preceding month (green line). The plot shows the last 30 days (about one solar rotation). The horizontal blue line shows the current monthly average, while the green dots give the number of stations included in the calculation of the EISN for each day.
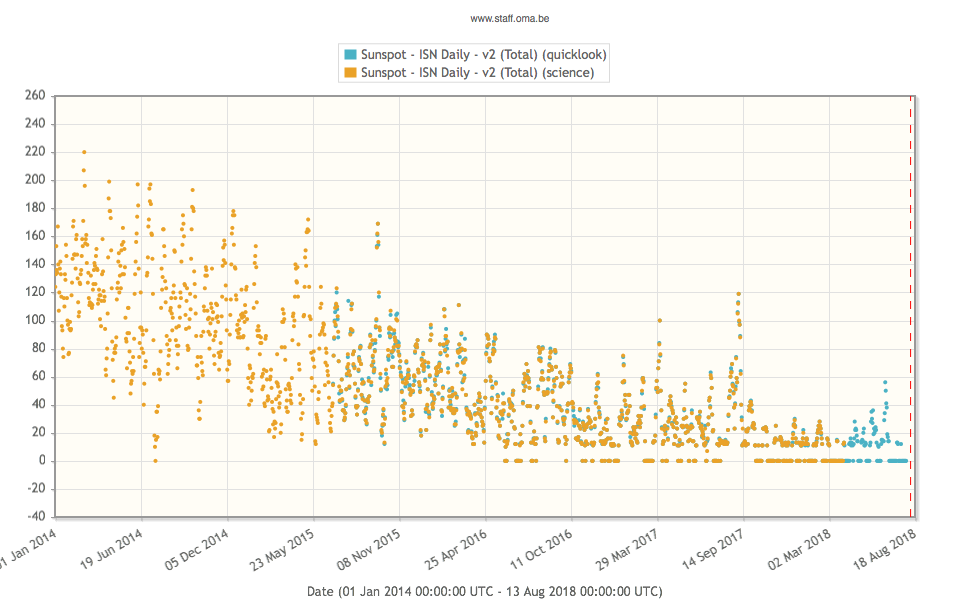
The graph below gives a broader time view. The dots represent the daily International Sunspot Number from January 1 2014 up to July 31, 2018: 1 dot a day. Some days have 2 dots: 1 for the quicklook data and 1 for the science data. Of course, as soon as the science data are there, there is no need anymore to put the quicklook in the graph, but the graph was just produced on the fly.
The thing that we want to show is that the zero-line (Y-axis) becomes more and more crowded in the right part.
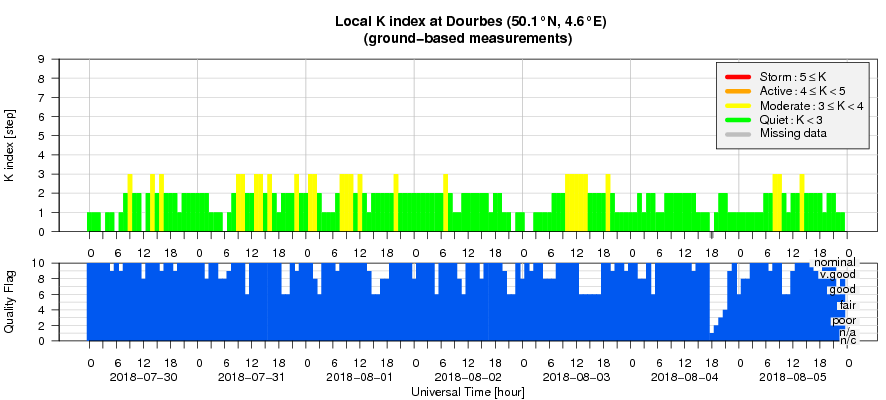
Geomagnetic Observations at Dourbes (30 Jul 2018 - 5 Aug 2018)
Review of ionospheric activity (30 Jul 2018 - 5 Aug 2018)
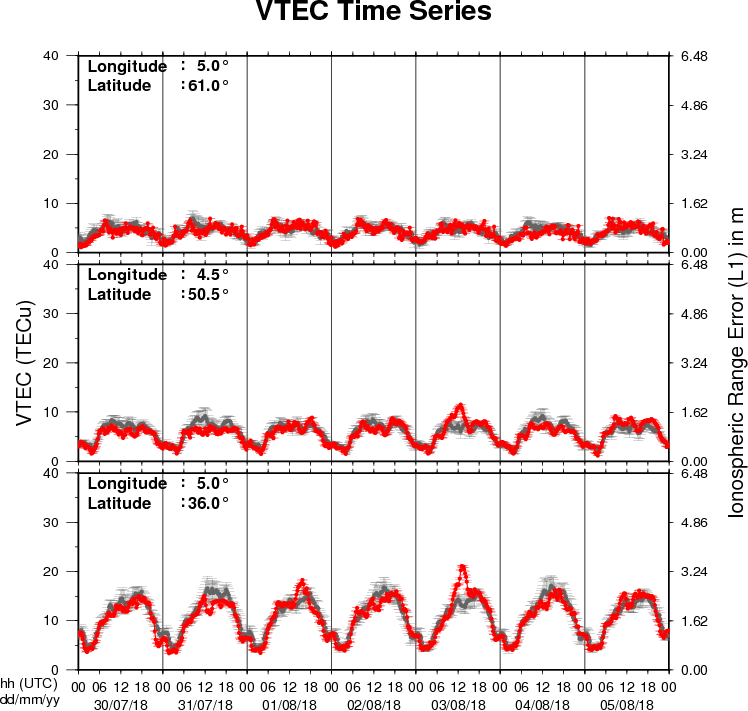
The figure shows the time evolution of the Vertical Total Electron Content (VTEC) (in red) during the last week at three locations:
a) in the northern part of Europe(N61°, 5°E)
b) above Brussels(N50.5°, 4.5°E)
c) in the southern part of Europe(N36°, 5°E)
This figure also shows (in grey) the normal ionospheric behaviour expected based on the median VTEC from the 15 previous days.
The VTEC is expressed in TECu (with TECu=10^16 electrons per square meter) and is directly related to the signal propagation delay due to the ionosphere (in figure: delay on GPS L1 frequency).
The Sun's radiation ionizes the Earth's upper atmosphere, the ionosphere, located from about 60km to 1000km above the Earth's surface.The ionization process in the ionosphere produces ions and free electrons. These electrons perturb the propagation of the GNSS (Global Navigation Satellite System) signals by inducing a so-called ionospheric delay.
See http://stce.be/newsletter/GNSS_final.pdf for some more explanations ; for detailed information, see http://gnss.be/ionosphere_tutorial.php