- Table of Content
- 1.Extremely seve...
- 2.PROBA2 Observa...
- 3.Review of sola...
- 4.The Internatio...
- 5.Review of geom...
- 6.Geomagnetic Ob...
- 7.Review of iono...
2. PROBA2 Observations (1 Oct 2018 - 7 Oct 2018)
3. Review of solar activity
4. The International Sunspot Number
5. Review of geomagnetic activity
6. Geomagnetic Observations at Dourbes (1 Oct 2018 - 7 Oct 2018)
7. Review of ionospheric activity (1 Oct 2018 - 7 Oct 2018)
Extremely severe geomagnetic storms
As already pointed out in previous STCE Newsitems (e.g. http://www.stce.be/news/419/welcome.html and http://www.stce.be/news/366/welcome.html ), the current solar cycle (SC24) is really weak in terms of geomagnetic activity. To illustrate this once more, we can make a comparison with previous cycles. To do this, the final Kp index (WDC Kyoto - http://wdc.kugi.kyoto-u.ac.jp/ ) was examined with data going back to 1932. Details on the Kp can also be found in the STCE Newsitem at http://www.stce.be/news/243/welcome.html For each day until 30 September 2018 (more than 85 years!), the maximum Kp was determined. The focus of this article is on the extremely severe geomagnetic storms, i.e. Kp = 9 (or G5 on the NOAA scales: https://www.swpc.noaa.gov/noaa-scales-explanation ). However, as there have been only 26 such days, in this article also the days with a maximum Kp = 9- have been taken into account. Though technically Kp=9- belongs to the severe storming category (G4), these 56 additional days provide some much needed extra data points. For the rest of this article, all 82 days are labelled as extremely disturbed days, i.e. days with extremely severe geomagnetic activity.
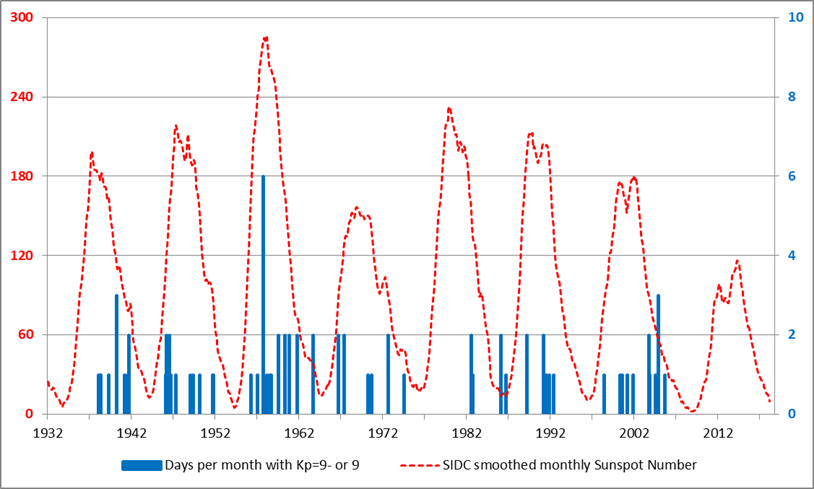
In the graph above, the number of days with Kp=9 or 9- per month is shown and compared with the SIDC smoothed monthly international sunspot number (ISN, as provided by SILSO at http://sidc.oma.be/silso/datafiles ). There are exactly 0 (zero) such days for SC24. In fact, it's more than 13 years ago since the last Kp=9- day, and for the last Kp=9 day we have to go back to the good old Halloween period in October 2003. The period is obviously much longer than the previous record-holder, an 8-year interval from 1974-1982. Also, with the minimum still to come, the currently ongoing stretch does not seem to come to an end very soon. Noteworthy are also the 6 days near the maximum of SC19 (September 1957), and -despite the high sunspot numbers- the low number of days with extremely severe geomagnetic storming during SC21.
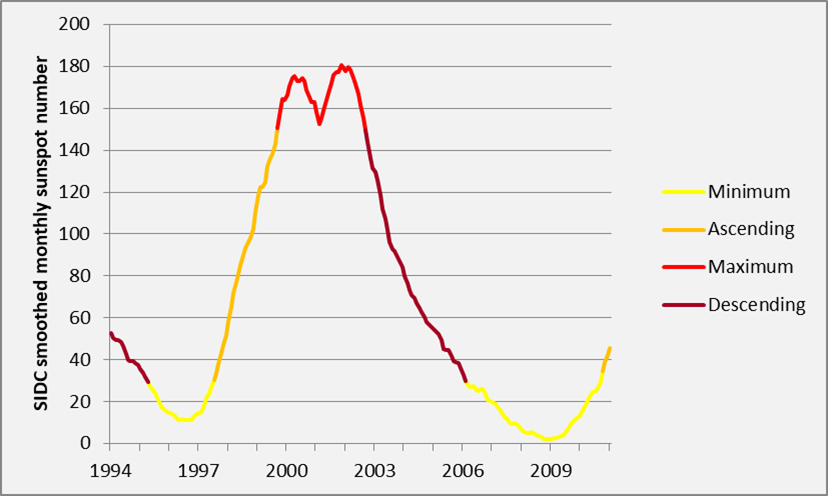
A solar cycle can be split in 4 phases, as shown in the graph above for SC23. The minimum phase can be defined as the period for which the smoothed ISN remains below 30, and during which the solar cycle minimum takes place. The maximum phase can be defined as the period when the smoothed ISN is above 80% of the solar cycle maximum. The ascending phase is then the interval during which the ISN rises, and the descending phase the interval during which the ISN decreases back to the cycle minimum phase.
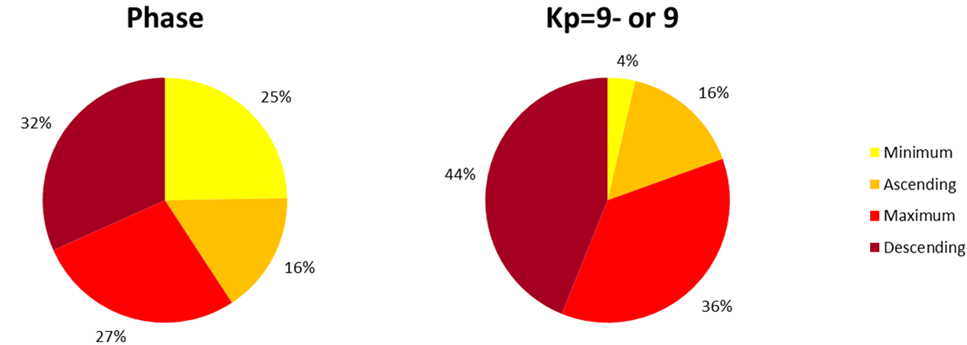
The figure above (left) shows the percentage that each of these phases take in terms of the average solar cycle (average of cycles 17-24). The low percentage for the ascending phase and the high percentage for the descending phase reflect the asymmetry of the average solar cycle, which usually rises much more quickly to its maximum than that it decays back to the minimum. The number of Kp=9- or 9 days is not proportional to these percentages, as the figure above (right) shows. It's of course no surprise that there are almost no extremely disturbed days (not zero!) during the cycle's minimum phase, and that a large percentage occurs during the maximum phase. More interesting is that the largest percentage of extremely disturbed days occurs during the descending phase of the solar cycle. As Kp=9- or 9 days are basically caused by interplanetary coronal mass ejections (CMEs), this high percentage has nothing to do with the high speed wind streams related to coronal holes that are also most numerous during the declining phase of a solar cycle. It's already exceptional when coronal hole wind streams cause a strong (Kp=7 ; G3) geomagnetic storm.
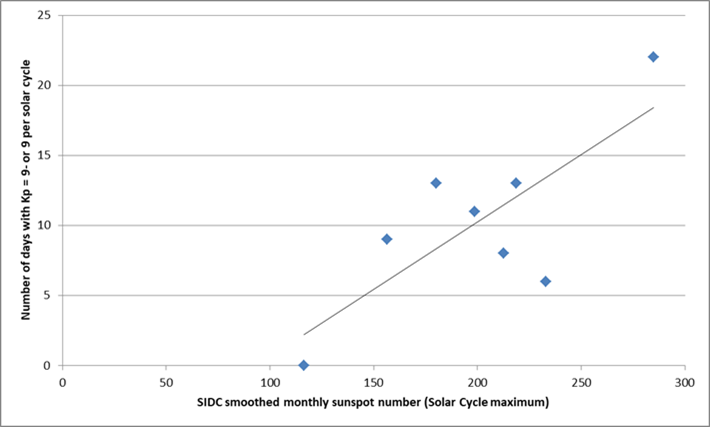
Finally, one could ask if there's a relationship between the maximum smoothed sunspot number of a solar cycle, and the total of Kp=9- or 9 days that occur during that solar cycle. The graph above shows the result for the last 8 cycles (SC17-24), with SC24 the point at the lower left (no Kp=9- or 9 days), and SC19 in the upper right corner (22 such days). There seems to be some relation, but at the same time there's also quite some "noise". As a rule-of-thumb, one could take the maximum of the SC, divide it by 11, and subtract 9. Allowing for a healthy uncertainty margin of 5, this gives a good idea of what can be expected with respect to the number of extremely disturbed geomagnetic storming days. As an example, take SC17 which had a maximum of 198. The rule of thumb would indicate 9 +/-5 extremely disturbed days for this SC, very close to the observed 11 days. There are at least two reasons for the rather large uncertainty. The first is that the ISN is only a measure for the number of sunspots, but does not say anything on the complexity of the sunspot regions. Such complex regions are a requirement for the production of solar eruptions that may be associated with strong earth-directed CMEs. The other reason is precisely that these complex active regions need to be located on the earth-facing solar hemisphere when they produce the eruptions. Indeed, things would have been quite different for SC24 if the famous, Carrington-like 23 July 2012 event (http://www.stce.be/news/394/welcome.html ) had occurred just a week or two earlier!
PROBA2 Observations (1 Oct 2018 - 7 Oct 2018)
Solar Activity
Solar flare activity was very low during the week.
In order to view the activity of this week in more detail, we suggest to go to the following website from which all the daily (normal and difference) movies can be accessed: http://proba2.oma.be/ssa
This page also lists the recorded flaring events.
A weekly overview movie can be found here (SWAP week 445).
http://proba2.oma.be/swap/data/mpg/movies/weekly_movies/weekly_movie_2018_10_01.mp4
Details about some of this week’s events, can be found further below.
If any of the linked movies are unavailable they can be found in the P2SC movie repository here
http://proba2.oma.be/swap/data/mpg/movies/
Thursday Oct 04
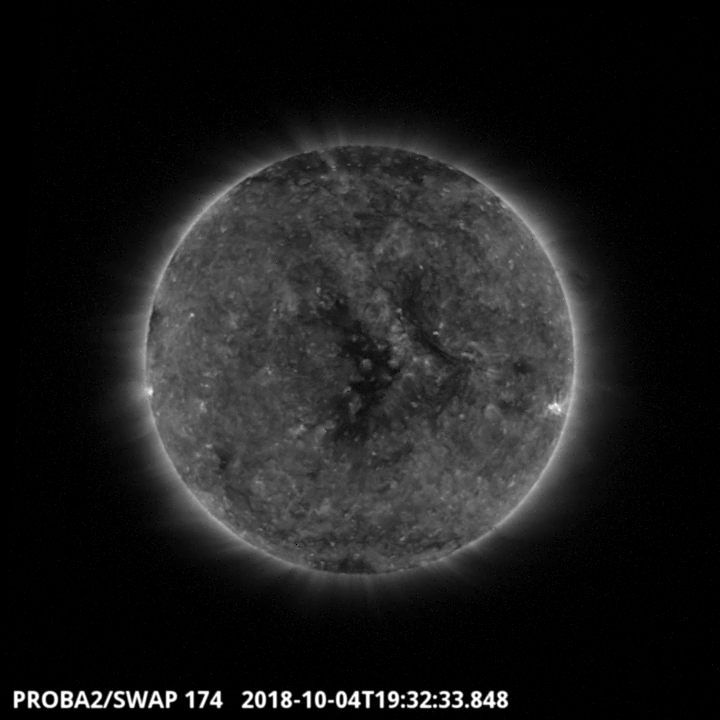
A large positive coronal hole is shown in the SWAP image above. It is connected to
the northern polar coronal hole and traversed the central meridian on October 4.
Find a movie of the event here (SWAP movie)
http://proba2.oma.be/swap/data/mpg/movies/20181004_swap_movie.mp4
Review of solar activity
Only active region NOAA 2327 was present on the disk. On October 5 it rotated behind the west limb.
No C-class flares, no Earth directed CMEs, no proton event were reported.
Two equatorial coronal holes (CH) were seen on the solar disk. A small negative CH crossed the central meridian on September 30. A larger positive CH (connected to the northern polar coronal hole) crossed the central meridian on October 4.
The International Sunspot Number
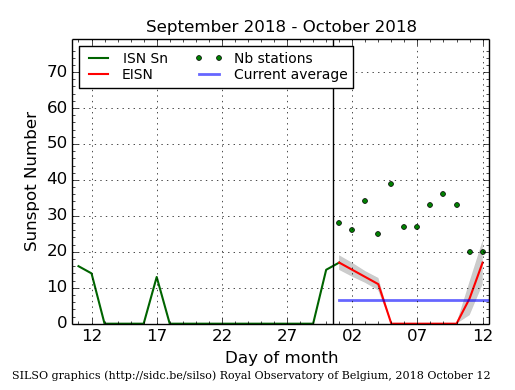
The daily Estimated International Sunspot Number (EISN, red curve with shaded error) derived by a simplified method from real-time data from the worldwide SILSO network. It extends the official Sunspot Number from the full processing of the preceding month (green line). The plot shows the last 30 days (about one solar rotation). The horizontal blue line shows the current monthly average, while the green dots give the number of stations included in the calculation of the EISN for each day.
Review of geomagnetic activity
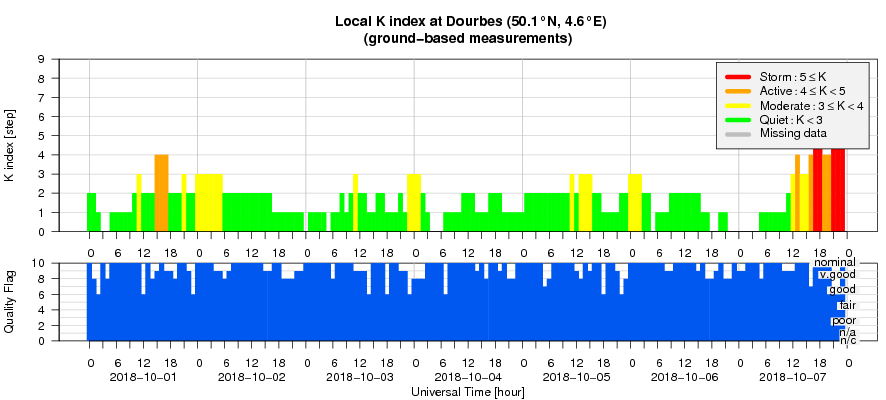
The local - Dourbes - geomagnetic conditions were active on October 1, between 15:00 UT and 17:00 UT. The planetary index Kp reached 4 on October 1 between 12:00 UT and 15:00 UT and on October 2 between 00:00 UT and 03:00 UT. This was due to the speed of 530 km/s of the solar wind and the Bz oscillating between -5 nT and +10 nT. The interplanetary magnetic field (IMF) went up to 10 nT.
The fast solar wind associated with the small negative coronal hole caused only unsettled conditions (Kp = 3 and K at Dourbes = 3) on October 3. The speed was slightly above 500 km/s and the IMF reached 10 nT.
The fast solar wind associated with the positive coronal hole arrived at Earth on October 7. Its speed reached 600 km/s, the IMF 20 nT, Bz went down to -15 nT and caused a minor storm (K = 5, both at local and at planetary levels) starting around 12:00 UT on October 7 and lasting more than a day.
Geomagnetic Observations at Dourbes (1 Oct 2018 - 7 Oct 2018)
Review of ionospheric activity (1 Oct 2018 - 7 Oct 2018)
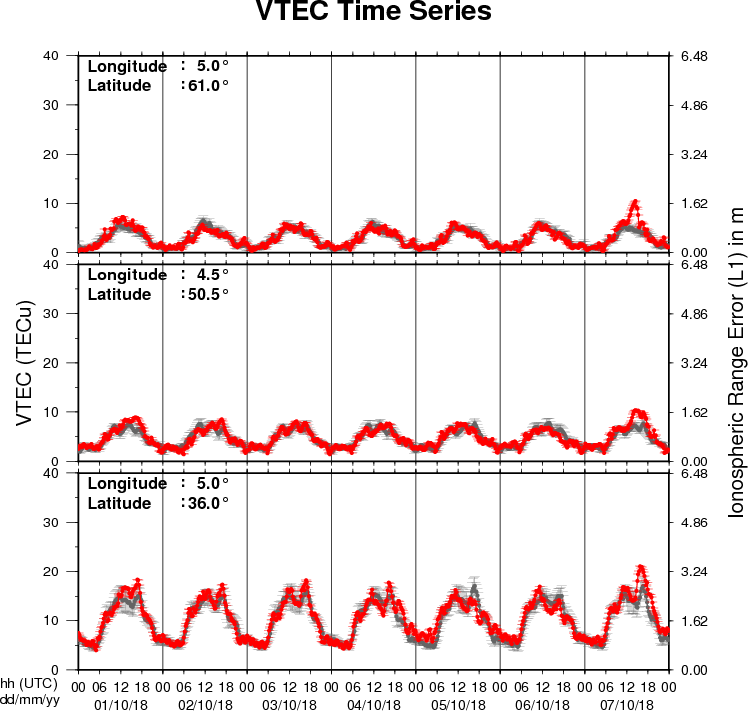
The figure shows the time evolution of the Vertical Total Electron Content (VTEC) (in red) during the last week at three locations:
a) in the northern part of Europe(N61°, 5°E)
b) above Brussels(N50.5°, 4.5°E)
c) in the southern part of Europe(N36°, 5°E)
This figure also shows (in grey) the normal ionospheric behaviour expected based on the median VTEC from the 15 previous days.
The VTEC is expressed in TECu (with TECu=10^16 electrons per square meter) and is directly related to the signal propagation delay due to the ionosphere (in figure: delay on GPS L1 frequency).
The Sun's radiation ionizes the Earth's upper atmosphere, the ionosphere, located from about 60km to 1000km above the Earth's surface.The ionization process in the ionosphere produces ions and free electrons. These electrons perturb the propagation of the GNSS (Global Navigation Satellite System) signals by inducing a so-called ionospheric delay.
See http://stce.be/newsletter/GNSS_final.pdf for some more explanations ; for detailed information, see http://gnss.be/ionosphere_tutorial.php