- Table of Content
- 1.Preliminary pr...
- 2.D-300
- 3.PROBA2 Observa...
- 4.Review of sola...
- 5.The Internatio...
- 6.Review of geom...
- 7.Geomagnetic Ob...
- 8.The SIDC space...
- 9.Review of iono...
2. D-300
3. PROBA2 Observations (1 Apr 2019 - 7 Apr 2019)
4. Review of solar activity
5. The International Sunspot Number by SILSO
6. Review of geomagnetic activity
7. Geomagnetic Observations at Dourbes (1 Apr 2019 - 7 Apr 2019)
8. The SIDC space weather Briefing
9. Review of ionospheric activity (1 Apr 2019 - 7 Apr 2019)
Preliminary prediction for the new solar cycle 25
The Solar Cycle 25 Prediction Panel, an international team of researchers in various solar and geophysical domains, has issued a preliminary prediction for the upcoming solar cycle 25 (SC25) based on a series of predictions that were submitted late January. Of note is that the STCE has contributed with a number of SC25 predictions (advanced sunspot statistics, polar faculae observations,...), and it had a member in the expert panel as well.
The new cycle is expected to start late in 2019 or in 2020, with solar maximum to be reached between 2023 and 2026 and the maximum (smoothed) sunspot number in the 95 to 130 range.
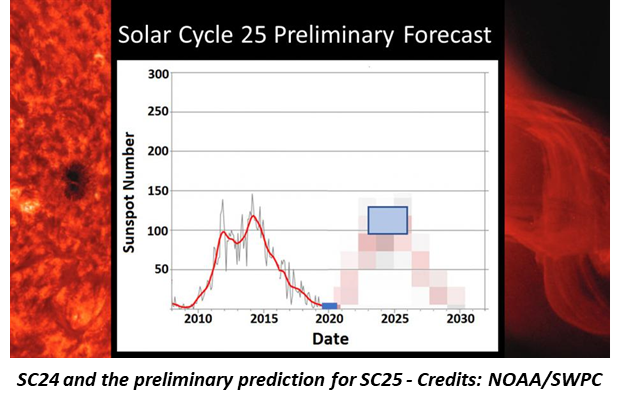
Thus, it seems that the strength of SC25 is going to be very similar to the still ongoing solar cycle 24 (SC24), which reached its maximum in April 2014 with a maximum smoothed sunspot number of 116.4 (SILSO, http://sidc.oma.be/silso/datafiles ), and now nearing its end. This would mean that SC25 would be again a well-below-average solar cycle, the average monthly sunspot number at solar maximum usually varying between 130 and 240 (see this news item at http://www.stce.be/news/312/welcome.html ). At the same time, the prediction excludes a further decline of solar activity towards Maunder minimum like values. The Maunder minimum was a period lasting from about 1645 to 1715 when only very few sunspots were observed.
The importance of solar activity predictions several years ahead cannot be emphasized enough. Indeed, as disturbed space weather conditions can affect a wide variety of our technological systems, operators want to know well in advance if they need to take precautions. For example, a satellite operator wants to know if a soon-to-be-launched satellite is best placed in a lower or higher (costlier) orbit. Because strong solar activity affects the atmospheric drag that such satellite experiences, the solar activity determines the life expectancy of the satellite. Hence, if a strong solar cycle is predicted, operators would do well to put the satellite in a higher orbit to keep it functional as long as intended.
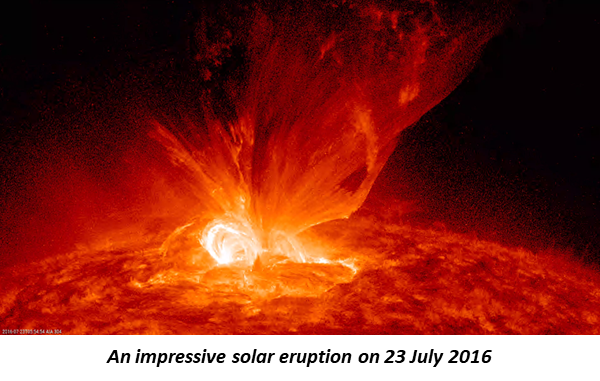
Though SC25 is anticipated to be a weak to moderate cycle, the panel -chaired by Lisa Upton, Ph.D. and Doug Biesecker, Ph.D.- warned that violent eruptions can occur at any time. Indeed, though no severe (X10 or stronger) solar flares and extremely severe geomagnetic storms have been observed during SC24 (see this news item at http://www.stce.be/news/419/welcome.html ), satellite observations have indicated that we were just lucky. For example, on 23 July 2012 a strong, Carrington-like event occurred on the farside of the Sun, therefore having only a small effect on the earth environment. If the event had happened just 7-10 days earlier, when the source region would have been earth-facing, technological damage could have been significant. The Carrington event (1859) is still considered as the godmother of all space weather storms, inflicting worldwide damage to telegraph lines and producing bright polar lights visible as far south as Cuba!
One of the aims of the SC25 panel is also to provide for the first time a prediction of the presence, amplitude, and timing of any differences between the northern and southern hemispheres on the Sun, known as Hemispheric Asymmetry. Therefore, the panel will release an official Sunspot Number curve later this year showing the finetuned predicted number of sunspots during any given year and any expected asymmetry.
Further reading is in the press release from NOAA/SWPC (https://www.weather.gov/news/190504-sun-activity-in-solar-cycle ) and at Phys.org (https://phys.org/news/2019-04-scientists-sun-weak-solar.html ).
D-300
Today, April 12 2019, it is exactly 300 days till 2020-02-06.
If the picture above is not changing, find out what it is about here: http://www.stce.be/briefings/overview.png
PROBA2 Observations (1 Apr 2019 - 7 Apr 2019)
Solar Activity
Solar flare activity remained very low during the week.
In order to view the activity of this week in more detail, we suggest to go to the following website from which all the daily (normal and difference) movies can be accessed: http://proba2.oma.be/ssa .
This page also lists the recorded flaring events.
A weekly overview movie can be found here (SWAP week 471): http://proba2.oma.be/swap/data/mpg/movies/weekly_movies/weekly_movie_2019_04_01.mp4
Details about some of this week's events, can be found further below.
If any of the linked movies are unavailable they can be found in the P2SC movie repository here: http://proba2.oma.be/swap/data/mpg/movies/
Sunday Apr 07
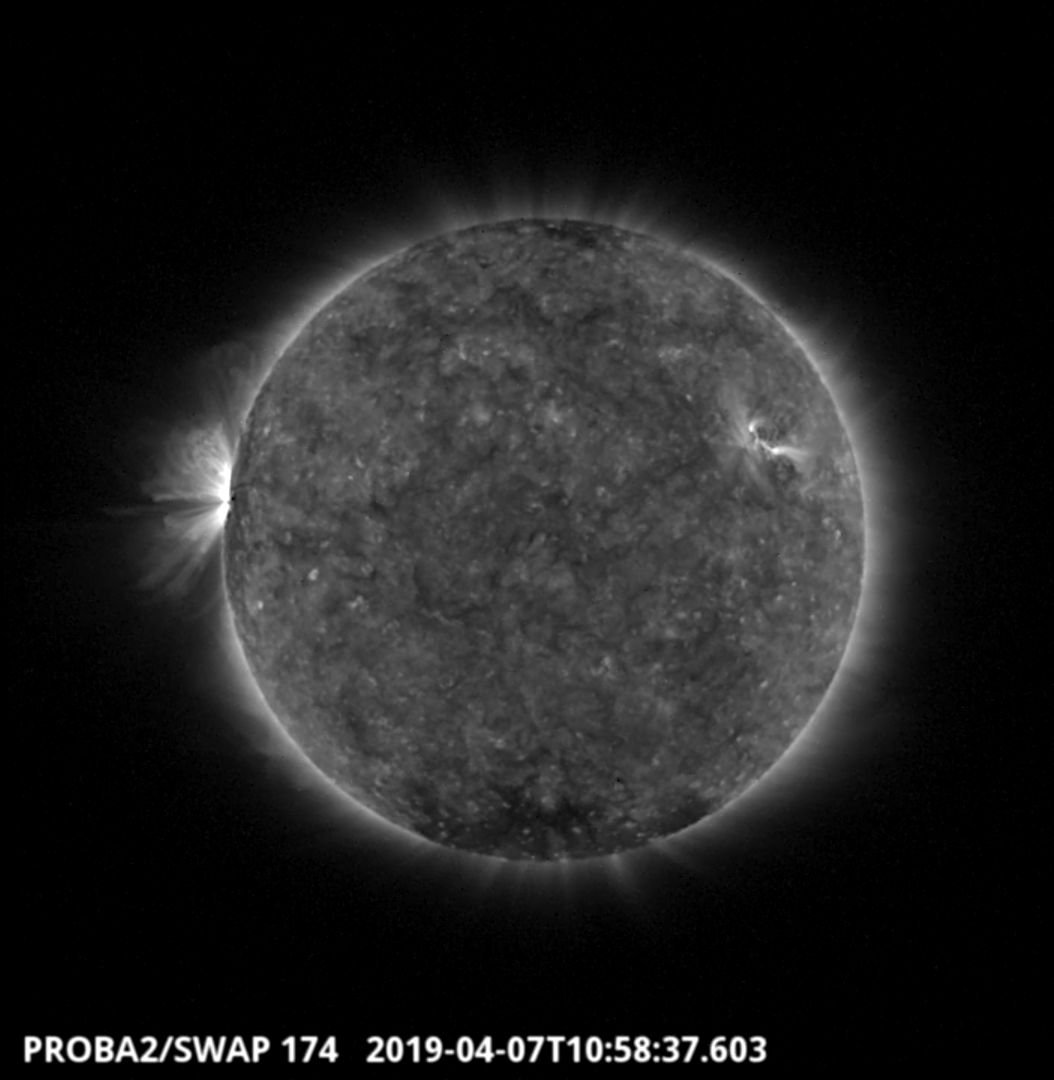
The largest flare of the week (B7.6), associated with NOAA AR 2738, was observed by SWAP and LYRA on 2019-Apr-07 and is visible on the east limb of the Sun in the SWAP image above taken at 10:58 UT.
Find a movie of the event here (SWAP movie): http://proba2.oma.be/swap/data/mpg/movies/20190407_swap_movie.mp4
Review of solar activity
One active region was present during the week. It was assigned as NOAA AR 2737. The corresponding sunspot group turned into a place by April 6. This sunspot group did not produce any flare. On April 7, an old sunspot group turned over the East limb. It was old region NOAA 2736. It produced nine B flares on April 7. The GOES X-ray flux (GOES 15, 0.1-0.8 nm) was below the A level from April 1 to April 5. Only on April 6, it reached the A level.
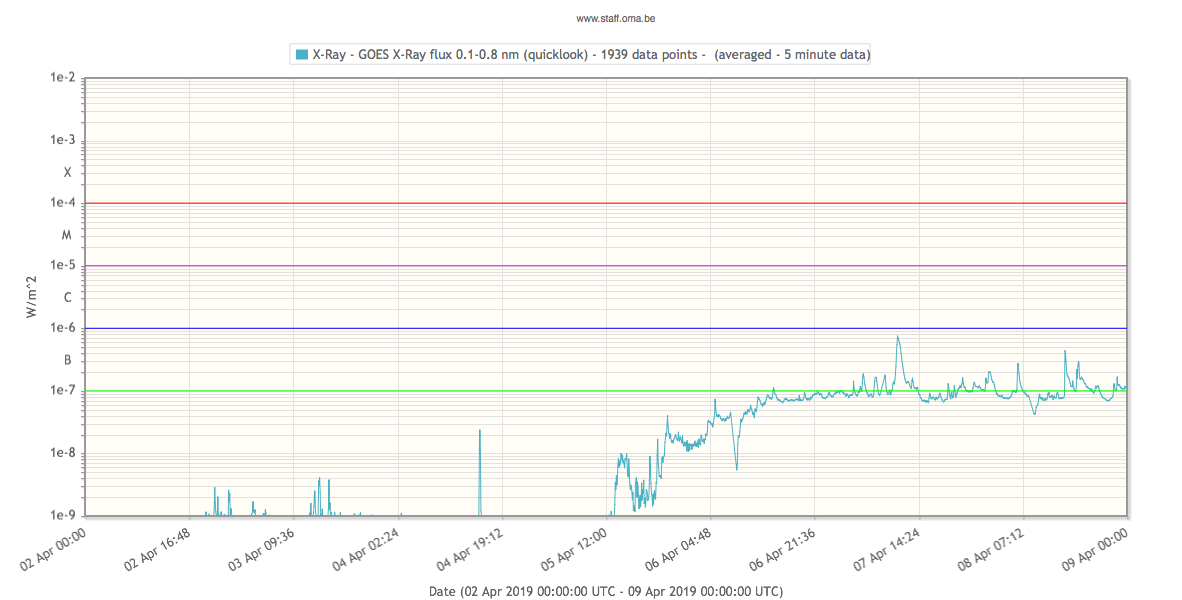
There were no filament eruptions nor Earth-directed CMEs.
The greater than 10 MeV proton flux was at nominal levels throughout the week.
The International Sunspot Number by SILSO
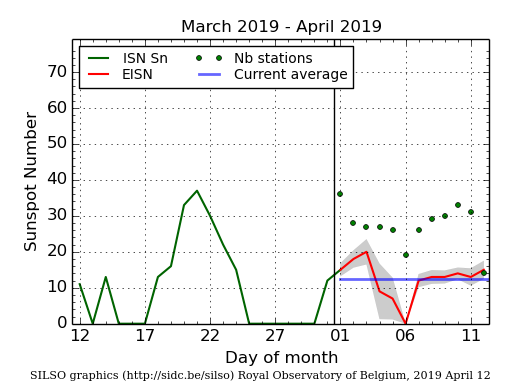
The daily Estimated International Sunspot Number (EISN, red curve with shaded error) derived by a simplified method from real-time data from the worldwide SILSO network. It extends the official Sunspot Number from the full processing of the preceding month (green line). The plot shows the last 30 days (about one solar rotation). The horizontal blue line shows the current monthly average, while the green dots give the number of stations included in the calculation of the EISN for each day.
Review of geomagnetic activity
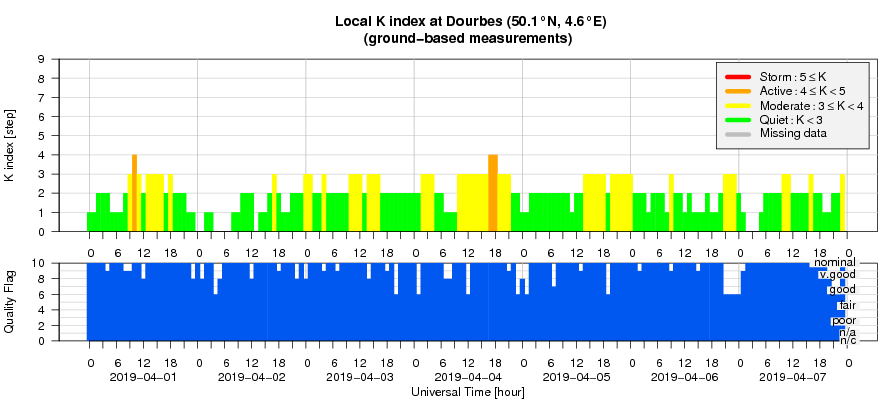
From April 4 onward, the solar wind near Earth was enhanced under the influence of a few isolated, negative polarity coronal holes. The DSCOVR satellite in the L1 point (just ahead of Earth) registered a solar wind speed up to 530 km/s and the magnitude of the Interplanetary Magnetic Field (IMF) around 11 nT.
The impact on the Earth magnetic field was limited. Apart from a few active intervals (K Dourbes = 4), the geomagnetic field was quiet to unsettled (K Dourbes less than 4).
Geomagnetic Observations at Dourbes (1 Apr 2019 - 7 Apr 2019)
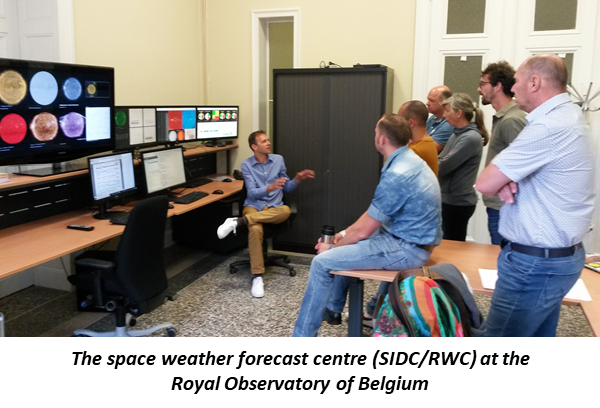
The SIDC space weather Briefing
The Space Weather Briefing presented by the forecaster on duty from April 1 to 7. It reflects in images and graphs what is written in the Solar and Geomagnetic Activity report.
The pdf-version: http://www.stce.be/briefings/20190408_SWbriefing.pdf
The automatically running presentation: http://www.stce.be/briefings/20190408_SWbriefing.ppsm
Review of ionospheric activity (1 Apr 2019 - 7 Apr 2019)
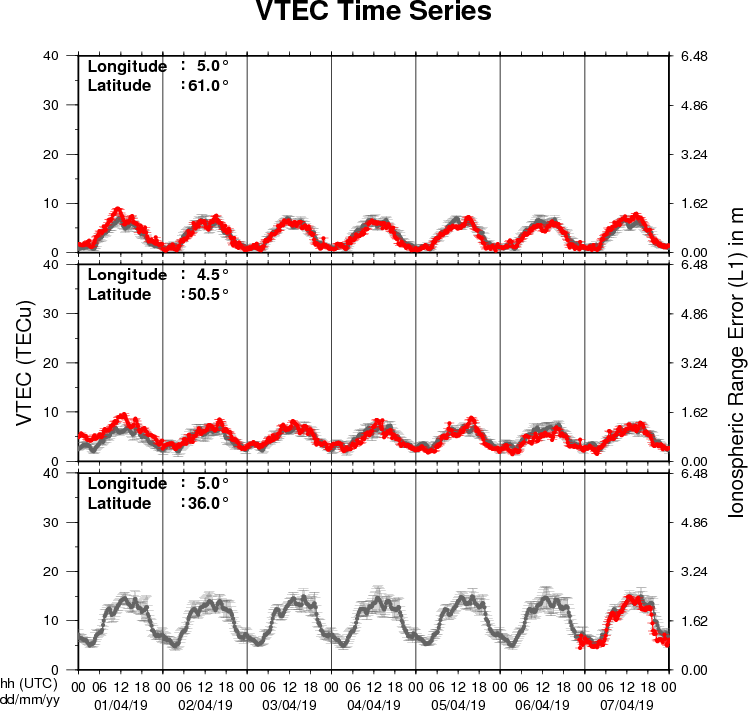
The figure shows the time evolution of the Vertical Total Electron Content (VTEC) (in red) during the last week at three locations:
a) in the northern part of Europe(N61°, 5°E)
b) above Brussels(N50.5°, 4.5°E)
c) in the southern part of Europe(N36°, 5°E)
This figure also shows (in grey) the normal ionospheric behaviour expected based on the median VTEC from the 15 previous days.
The VTEC is expressed in TECu (with TECu=10^16 electrons per square meter) and is directly related to the signal propagation delay due to the ionosphere (in figure: delay on GPS L1 frequency).
The Sun's radiation ionizes the Earth's upper atmosphere, the ionosphere, located from about 60km to 1000km above the Earth's surface.The ionization process in the ionosphere produces ions and free electrons. These electrons perturb the propagation of the GNSS (Global Navigation Satellite System) signals by inducing a so-called ionospheric delay.
See http://stce.be/newsletter/GNSS_final.pdf for some more explanations ; for detailed information, see http://gnss.be/ionosphere_tutorial.php