- Table of Content
- 1.Sweet but a li...
- 2.Space Weather ...
- 3.PROBA2 Observa...
- 4.Review of sola...
- 5.The Internatio...
- 6.Review of geom...
- 7.Geomagnetic Ob...
- 8.The SIDC space...
- 9.Review of iono...
2. Space Weather as an innovative business
3. PROBA2 Observations (29 Apr 2019 - 5 May 2019)
4. Review of solar activity
5. The International Sunspot Number by SILSO
6. Review of geomagnetic activity
7. Geomagnetic Observations at Dourbes (29 Apr 2019 - 5 May 2019)
8. The SIDC space weather Briefing
9. Review of ionospheric activity (29 Apr 2019 - 5 May 2019)
Sweet but a little bit psycho
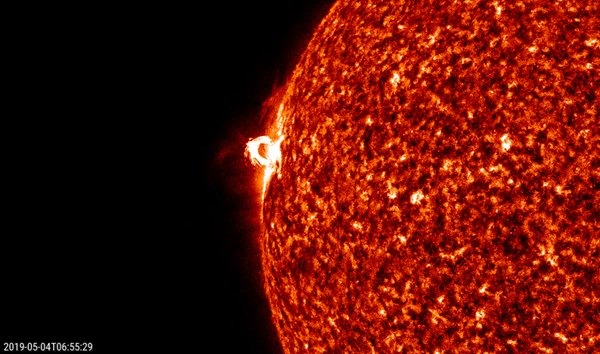
Active region NOAA 2740 became visible on 3 May. It was the second act of this sunspot group, as it had already completed a transit of the solar disk as NOAA 2738 just 2 weeks ago. At the time, it was a somewhat larger-than-usual sunspot, symmetrical and simple, and thus not very flare active (see this STCE newsitem at http://www.stce.be/news/454/welcome.html ). This time however, it announced its second transit with some backside coronal mass ejections (CMEs) and some impressive limb activity, as can be seen in these extreme ultraviolet (EUV) images made on 4 May by SDO (https://sdo.gsfc.nasa.gov/ ) at relatively low temperatures (AIA/304; about 80.000 degrees).
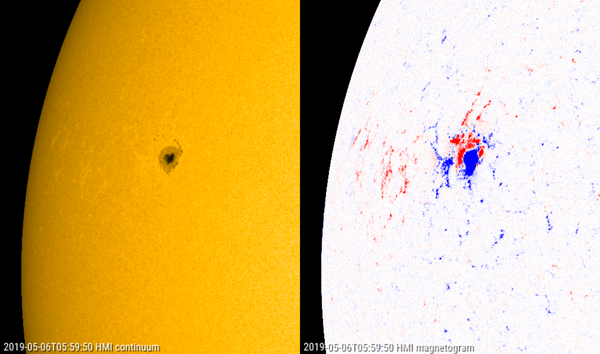
As NOAA 2740 rotated further onto the disk, magnetograms made clear that the main spot had some small satellite sunspots to the north and northwest, which had an opposite magnetic polarity. One of these small spots was actually located at the rim of the main sunspot, forming a delta structure. The SDO/HMI images show the region in white light (left) and its magnetic structure (right). The blue color denotes magnetic field lines returning to the sun ("negative" polarity), the red color is for field lines coming out of the Sun ("positive" polarity). The delta structure can be clearly identified within the northwestern portion of the main sunspot early on 6 May. The reddish hue at the east limb of the spot is mostly a line-of-sight effect (see the STCE newsitem at http://www.stce.be/news/188/welcome.html ).
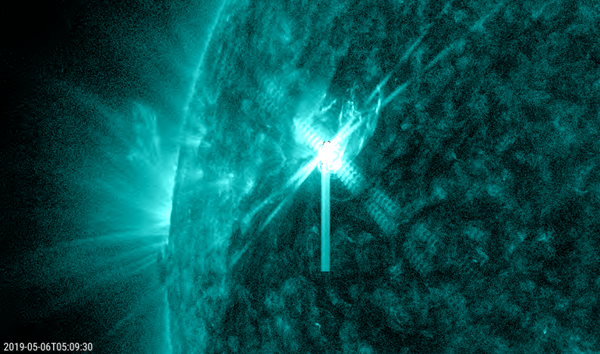
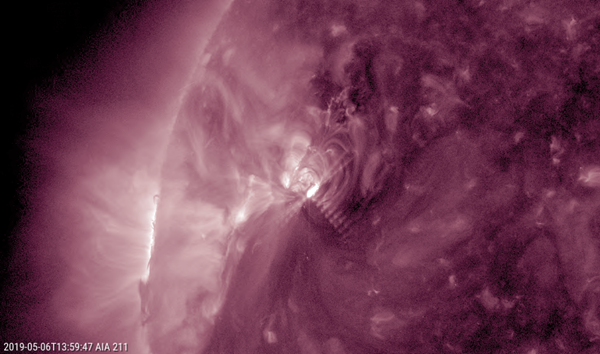
"Delta's" are notorious for their flare production, and this time it was not different. In particular on 6 May, NOAA 2740 produced no less than 7 C-class flares. The strongest of these was a C9.9 flare, making it almost into the M-class group ("medium"). The last M-class flare dates already back from 20 October 2017! SDO's EUV imagery (AIA 131, multi-million degrees) underneath shows the event near its peak time. Coronal dimming (to the southwest) and what appears to be a coronal wave (to the north and northwest) can be seen in the difference images (one picture subtracted from the foregoing picture) based on SDO's AIA/211 imagery (temperatures near 2 million degrees).
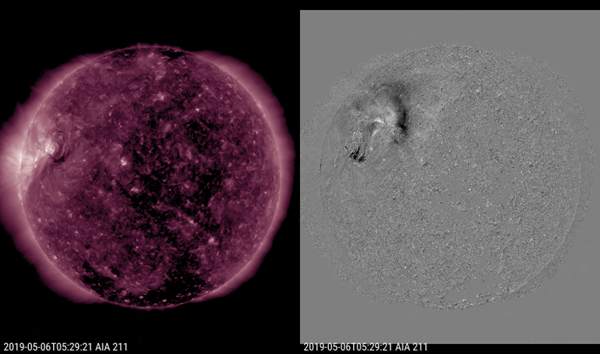
The C9.9 flare was the first of 7 C-class flares on 6 May. Most were low-level events, but there was also a C7.3 flare peaking shortly after noon (see image underneath). So far, none of the coronal mass ejections associated with the frenzy of flaring events in NOAA 2740 seems to be earth-directed. Clips were made with JHelioviewer (http://www.jhelioviewer.org/ ) and can be found at the STCE website http://www.stce.be/news/455/welcome.html
Space Weather as an innovative business
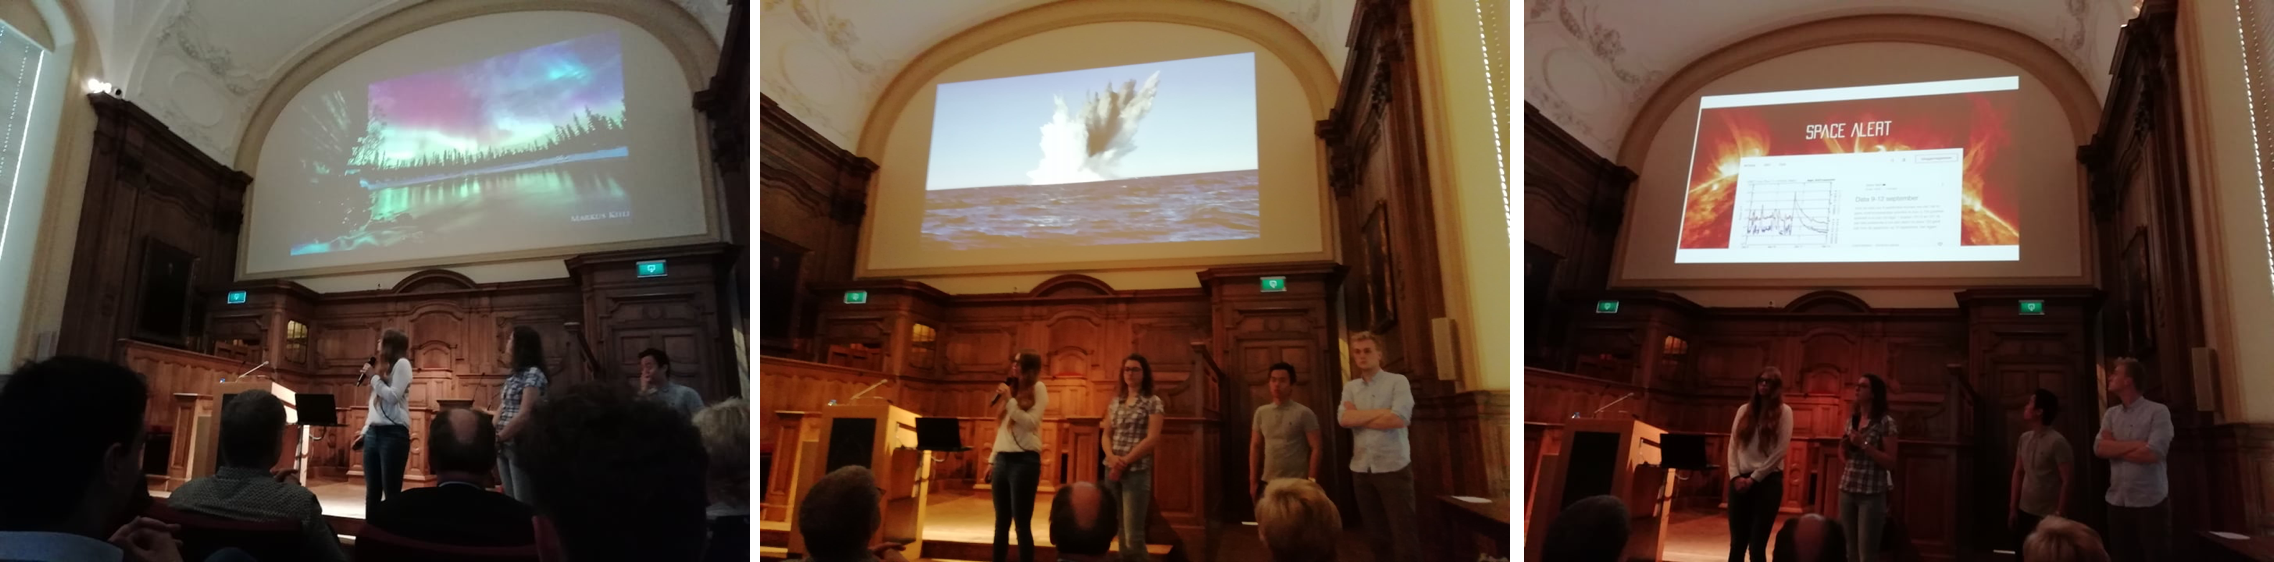
Thomas, Sheila, Joshua and Maité, KULeuven students presented on May 8 their 'Space Alert' project pitch at the Science Innovation Gala.
Their task was to find a business case for Space Weather and write down a financial plan. They would offer an online service 'Space Alert' with a strategy tailed to or the public, or to a company impacted by space weather.
It was an instructive and entertaining evening about innovation with students Science Innovation Project Pitches, the president of Leuven MindGate and the CEO of Google Belgium.
Looking forward to the next edition!
PROBA2 Observations (29 Apr 2019 - 5 May 2019)
Solar Activity
Solar flare activity fluctuated between very low and low during the week.
In order to view the activity of this week in more detail, we suggest to go to the following website from which all the daily (normal and difference) movies can be accessed: http://proba2.oma.be/ssa
This page also lists the recorded flaring events.
A weekly overview movie can be found here (SWAP week 475): http://proba2.oma.be/swap/data/mpg/movies/weekly_movies/weekly_movie_2019_04_29.mp4
Details about some of this week's events, can be found further below.
If any of the linked movies are unavailable they can be found in the P2SC movie repository here: http://proba2.oma.be/swap/data/mpg/movies/
Saturday May 04
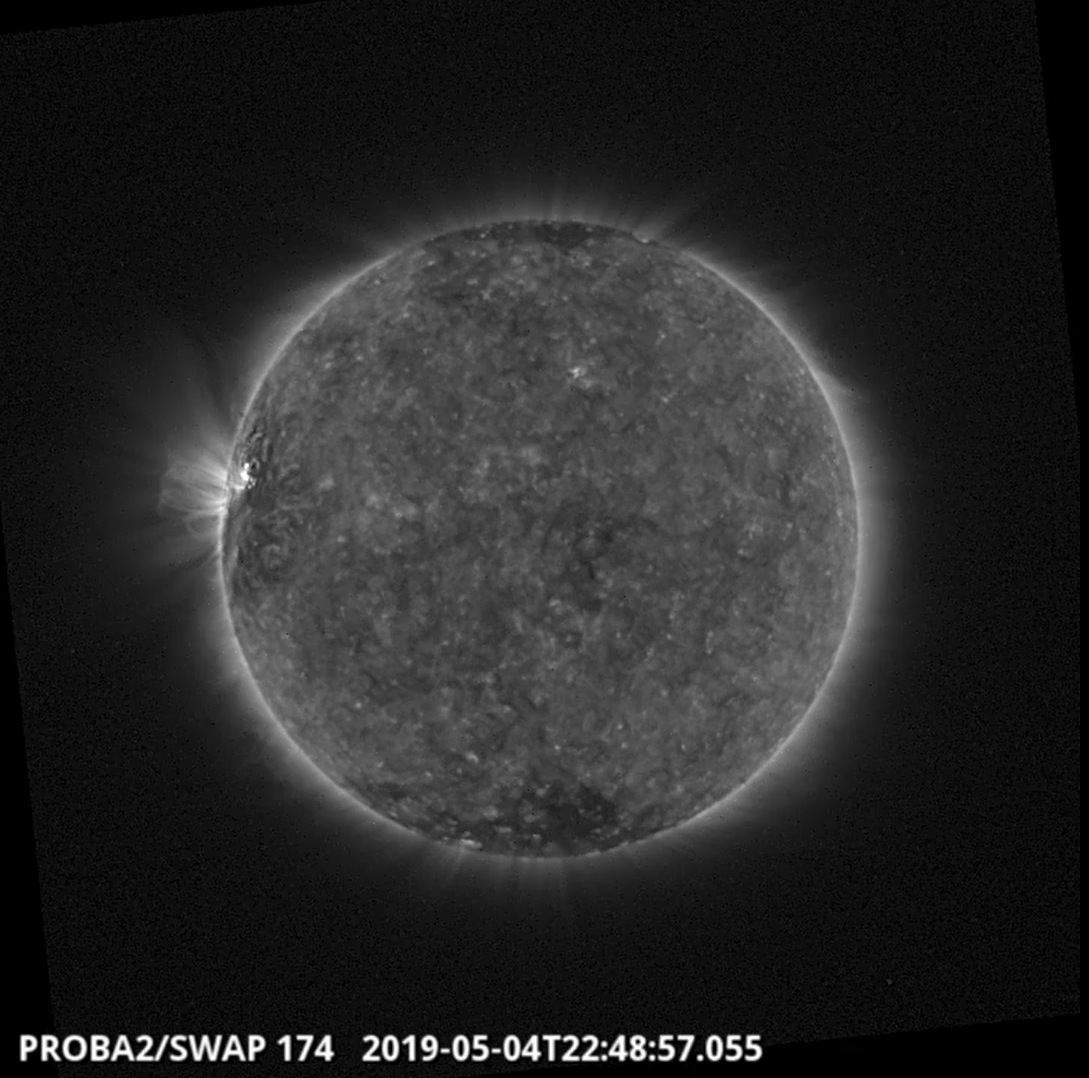
The largest flare of the week (C2.1), associated with NOAA AR 2740, was observed by SWAP and LYRA on 2019-May-04 and is visible on the east limb of the Sun in the SWAP image above taken at 22:48 UT.
Find a movie of the event here (SWAP movie): http://proba2.oma.be/swap/data/mpg/movies/20190504_swap_movie.mp4
Review of solar activity
Solar flaring activity was low with 11 B-class and 2 C-class flares reported. These flares originated from NOAA 2740, the only active region observed.
Several narrow CMEs associated with the flares mentioned were observed.
A partial halo CME was detected in the SOHO/LASCO C2 field of view at 15:24 UT, on April 30. The CME had angular width of about 190 degrees and a projected plane of the sky speed of about 500 km/s (as reported by the CACTUS software).
The partial halo CME was a subsequent event (following a narrower CME) and was associated with an EIT wave and a coronal dimming. At the time of this partial halo CME left the Sun, its source region was just behind the east solar limb and therefore determined as back-sided and not Earth-directed.
The solar protons remained at the background level during the whole week.
Two coronal holes were observed on the visible side of the Sun, both equatorial and of negative polarity. The first coronal hole reached central meridian already previous week (April 28). The second coronal hole reached the central meridian on April 30.
The International Sunspot Number by SILSO
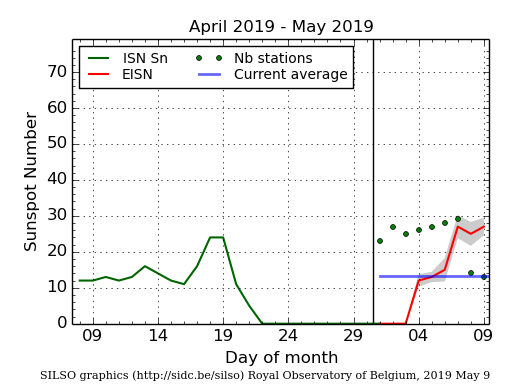
The daily Estimated International Sunspot Number (EISN, red curve with shaded error) derived by a simplified method from real-time data from the worldwide SILSO network. It extends the official Sunspot Number from the full processing of the preceding month (green line). The plot shows the last 30 days (about one solar rotation). The horizontal blue line shows the current monthly average, while the green dots give the number of stations included in the calculation of the EISN for each day.
Review of geomagnetic activity
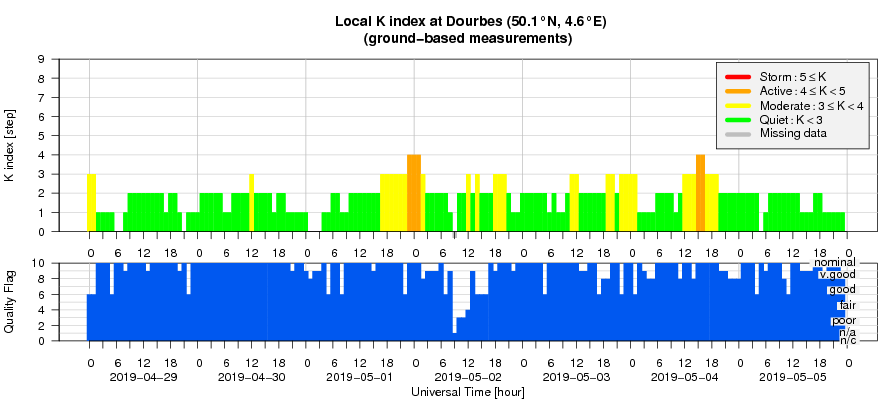
On April 29, the solar wind was slow and magnetically faint: about 350 km/s and 5 nT, respectively.
In situ observations indicated that the fast solar wind associated with the first equatorial coronal hole (which reached central meridian on April 28) arrived in the UT evening of May 01.
The solar wind associated with the second equatorial coronal hole (which reached central meridian on April 30) arrived at Earth in the early morning of May 04.
The first coronal hole induced active geomagnetic conditions (local station at Dourbes and NOAA reported K=4 and Kp=4, respectively). The second coronal hole induced disturbed geomagnetic conditions, local station at Dourbes reported K=4, but NOAA reported only Kp=3.
Geomagnetic Observations at Dourbes (29 Apr 2019 - 5 May 2019)
The SIDC space weather Briefing
The Space Weather Briefing presented by the forecaster on duty from April 29 to May 5. It reflects in images and graphs what is written in the Solar and Geomagnetic Activity report.
The pdf-version: http://www.stce.be/briefings/20190506_SWbriefing.pdf
The automatically running presentation: http://www.stce.be/briefings/20190506_SWbriefing.ppsm
Review of ionospheric activity (29 Apr 2019 - 5 May 2019)
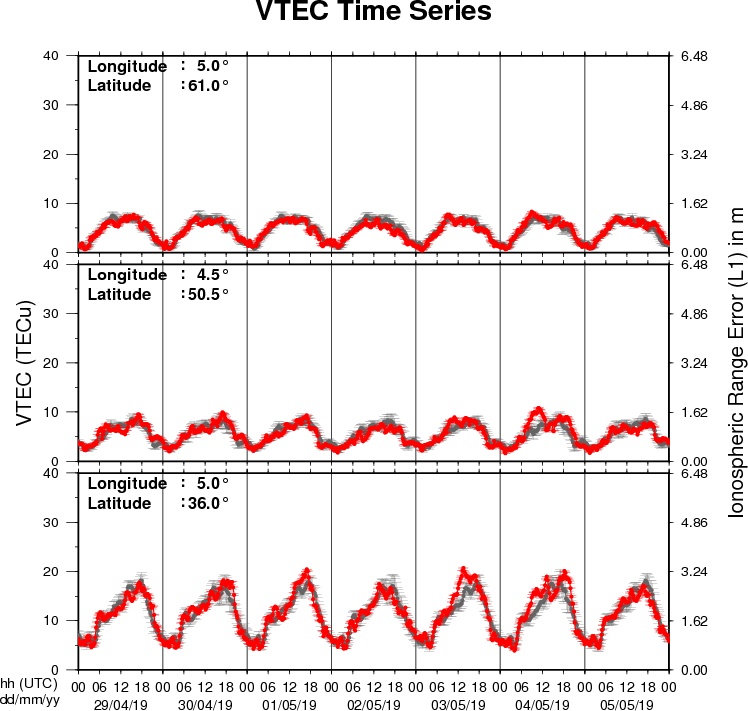
The figure shows the time evolution of the Vertical Total Electron Content (VTEC) (in red) during the last week at three locations:
a) in the northern part of Europe(N61°, 5°E)
b) above Brussels(N50.5°, 4.5°E)
c) in the southern part of Europe(N36°, 5°E)
This figure also shows (in grey) the normal ionospheric behaviour expected based on the median VTEC from the 15 previous days.
The VTEC is expressed in TECu (with TECu=10^16 electrons per square meter) and is directly related to the signal propagation delay due to the ionosphere (in figure: delay on GPS L1 frequency).
The Sun's radiation ionizes the Earth's upper atmosphere, the ionosphere, located from about 60km to 1000km above the Earth's surface.The ionization process in the ionosphere produces ions and free electrons. These electrons perturb the propagation of the GNSS (Global Navigation Satellite System) signals by inducing a so-called ionospheric delay.
See http://stce.be/newsletter/GNSS_final.pdf for some more explanations ; for detailed information, see http://gnss.be/ionosphere_tutorial.php