- Table of Content
- 1.PECASUS for ci...
- 2.PROBA2 Observa...
- 3.Review of sola...
- 4.The Internatio...
- 5.Review of geom...
- 6.Geomagnetic Ob...
- 7.The SIDC space...
- 8.Review of iono...
2. PROBA2 Observations (27 May 2019 - 2 Jun 2019)
3. Review of solar activity
4. The International Sunspot Number by SILSO
5. Review of geomagnetic activity
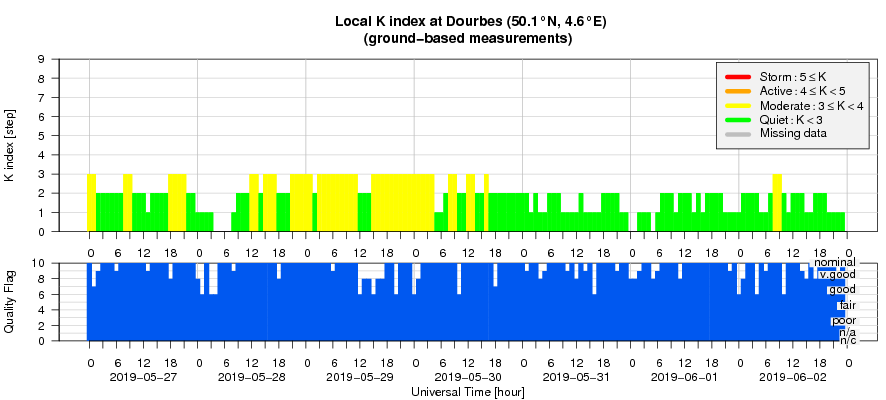
6. Geomagnetic Observations at Dourbes (27 May 2019 - 2 Jun 2019)
7. The SIDC space weather Briefing
8. Review of ionospheric activity (27 May 2019 - 2 Jun 2019)
PECASUS for civil aviation
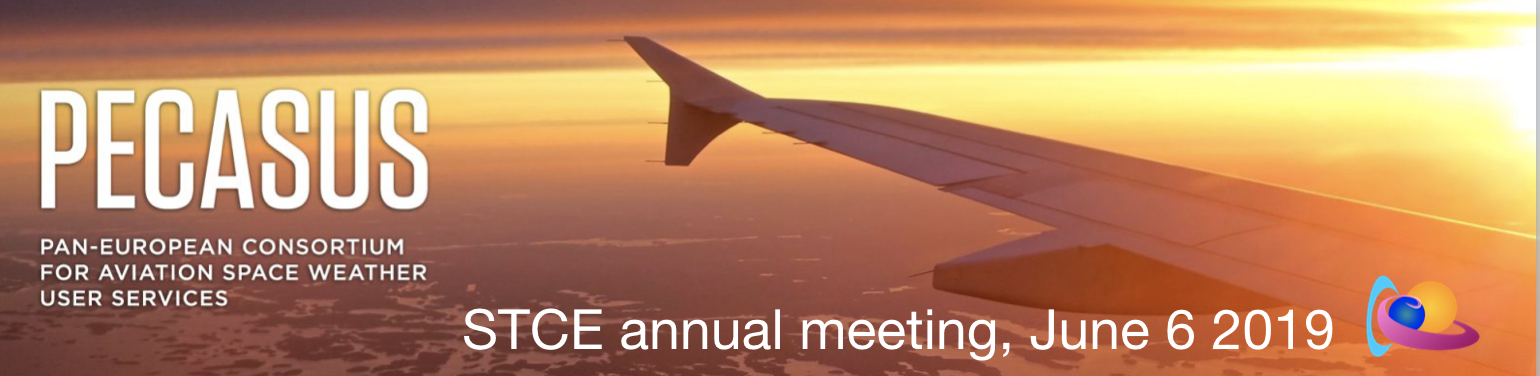
PECASUS, of which STCE is part, is one of the three selected global centres that delivers a worldwide space weather service for civil aviation.
Sporadic and massive eruptions of very high-energy matter and radiation from the Sun can have a pronounced impact on communications, navigation and the health of passengers and crew. The exposure of the aviation community to space weather has increased since the opening of the northern polar routes at the end of the 20th century. Measures to meet safety regulations in aviation are enforced. PECASUS delivers concise, accurate and timely information for preserving maximum possible flight safety during extreme solar events.
PECASUS is a collaboration between Finland, Belgium, UK, Poland, Germany, Netherlands, Italy, Austria, and Cyprus. STCE Belgium is the main data hub, provides solar data and generates 24/7 validated advisories bringing together the solar, GNSS and particle radiation expertise present at BIRA-IASB, RMI and ROB.
Impressions from the meeting:
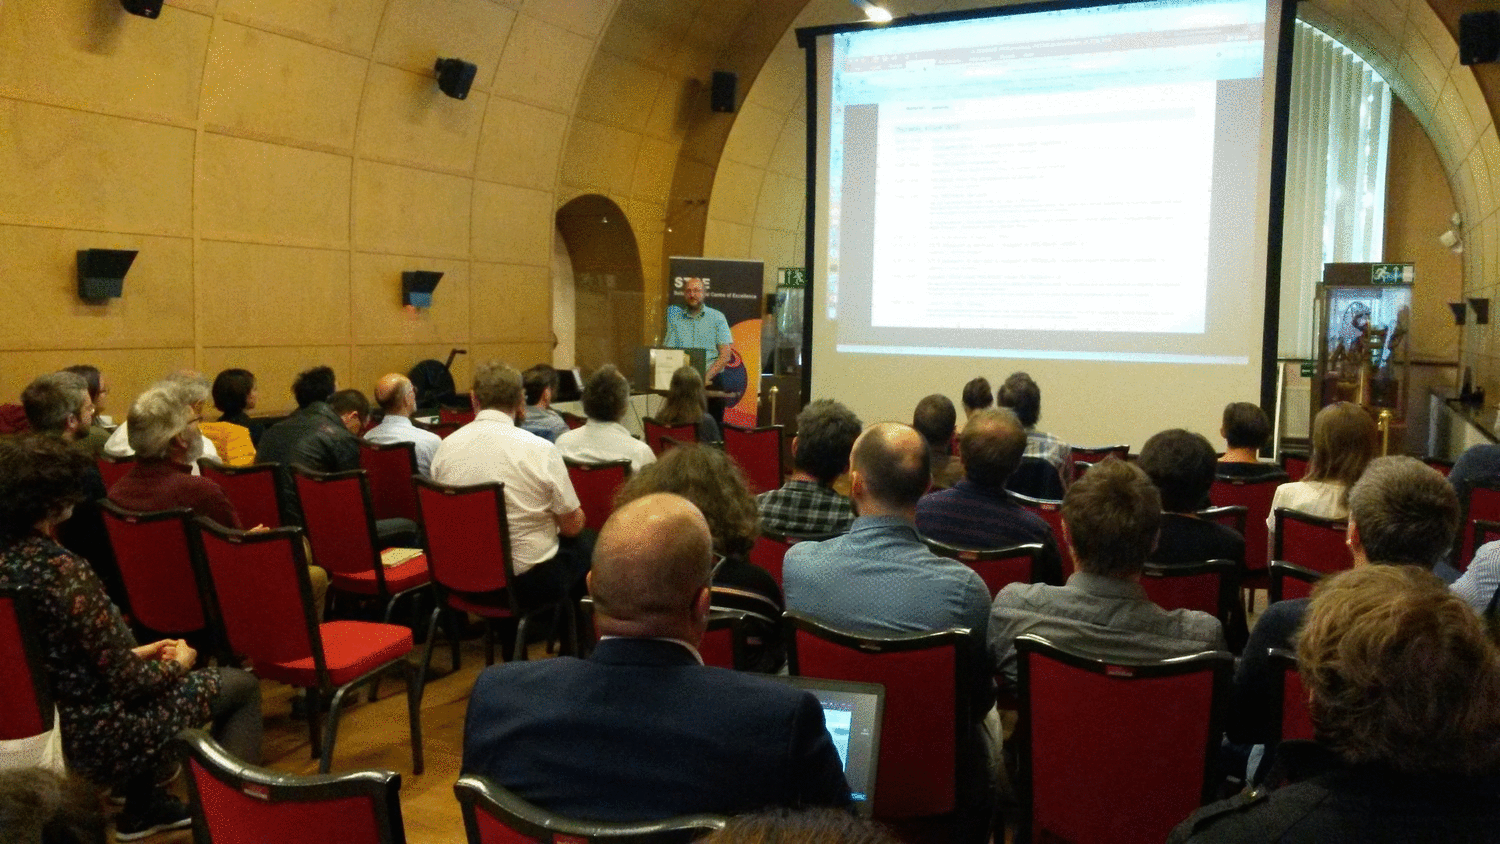
For the program and presentations, check: https://events.oma.be/indico/event/64/
PROBA2 Observations (27 May 2019 - 2 Jun 2019)
Solar Activity
Solar flare activity remained very low during the week.
In order to view the activity of this week in more detail, we suggest to go to the following website from which all the daily (normal and difference) movies can be accessed: http://proba2.oma.be/ssa
This page also lists the recorded flaring events.
A weekly overview movie can be found here (SWAP week 479): http://proba2.oma.be/swap/data/mpg/movies/weekly_movies/weekly_movie_2019_05_27.mp4
Details about some of this week's events, can be found further below.
If any of the linked movies are unavailable they can be found in the P2SC movie repository here: http://proba2.oma.be/swap/data/mpg/movies/
Saturday Jun 01
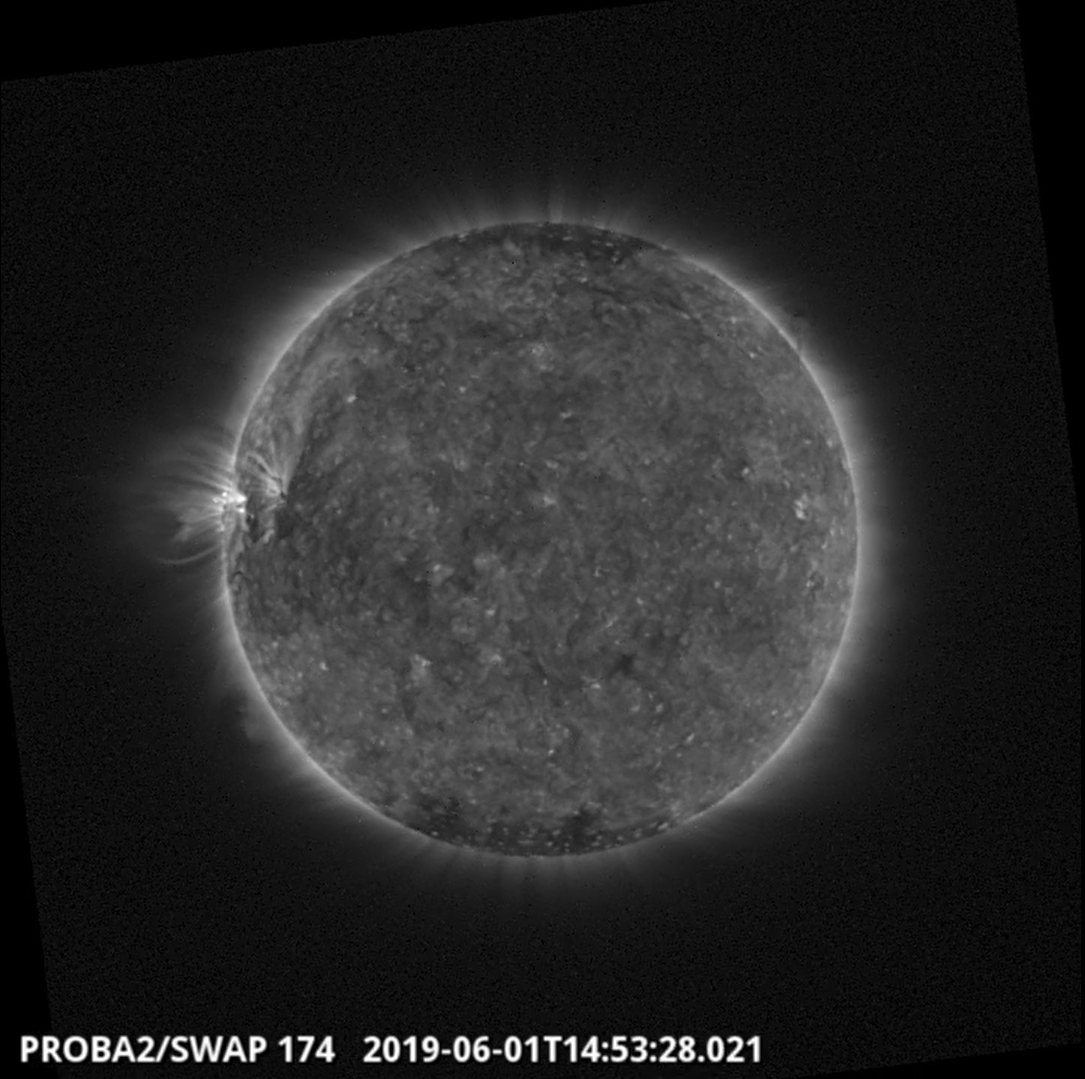
The largest flare of the week (B2.2) was observed by SWAP and LYRA on 2019-Jun-01 and is visible on the eastern limb of the Sun in the SWAP image above taken at 14:53 UT.
Find a movie of the event here (SWAP movie): http://proba2.oma.be/swap/data/mpg/movies/20190601_swap_movie.mp4
Review of solar activity
The solar activity has been quiet.
The X-ray flux remained mostly below B-level, and the visible solar disc was spotless.
No Earth directed Coronal Mass Ejection (CME) has been detected in the coronagraph imagery.
The greater than 10 MeV solar protons flux remained at nominal levels.
The International Sunspot Number by SILSO
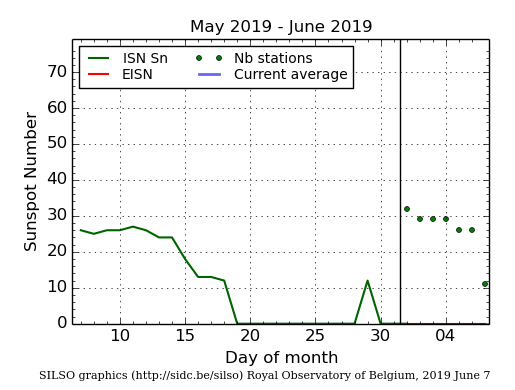
The daily Estimated International Sunspot Number (EISN, red curve with shaded error) derived by a simplified method from real-time data from the worldwide SILSO network. It extends the official Sunspot Number from the full processing of the preceding month (green line). The plot shows the last 30 days (about one solar rotation). The horizontal blue line shows the current monthly average, while the green dots give the number of stations included in the calculation of the EISN for each day.
Review of geomagnetic activity
On May 26, 21:25 UT the solar wind speed jumped from 300 km/s to 360 km/s at the L1 point. The interplanetary magnetic field strength increased rapidly and reached 12 nT, while the southward component reached -9.5 nT.
This solar wind structure was associated with the arrival of an interplanetary CME which could not be accurately identified in earlier coronagraph imagery. The most realistic candidate was the narrow and slow CME observed in STEREO-COR2 images on May 22 at around 04:30 UT.
After the passage of this solar wind structure, a fast solar wind arrived on May 29. The wind speed increased up to 566 km/s. The solar wind was associated with the negative polarity equatorial coronal hole, which began to traverse the central meridian on May 24. The interplanetary magnetic field strength peaked for a short duration at 12 nT, and the southward component ranged between -10 nT and +9 nT.
The solar wind parameters showed a slow and long return towards an ambient background and slow solar wind regime from May 30 to June 2. Solar wind speed decreased to 300 km/s. Total interplanetary magnetic field strength dropped to remain below 6 nT and the Bz component stayed between -4 nT and 4 nT.
The geomagnetic conditions were quiet to unsettled with Kp index (NOAA) and local K index (Dourbes) ranging between 1 and 3. A short period of active condition was observed at the planetary level on May 29. This was attributed to the high-speed solar wind stream emanating from the negative polarity equatorial coronal hole.
Geomagnetic Observations at Dourbes (27 May 2019 - 2 Jun 2019)
The SIDC space weather Briefing
The Space Weather Briefing presented by the forecaster on duty from Mau 27 to June 2. It reflects in images and graphs what is written in the Solar and Geomagnetic Activity report.
The pdf-version: http://www.stce.be/briefings/20190603_SWbriefing.pdf
The automatically running presentation: http://www.stce.be/briefings/20190603_SWbriefing.ppsm
Review of ionospheric activity (27 May 2019 - 2 Jun 2019)
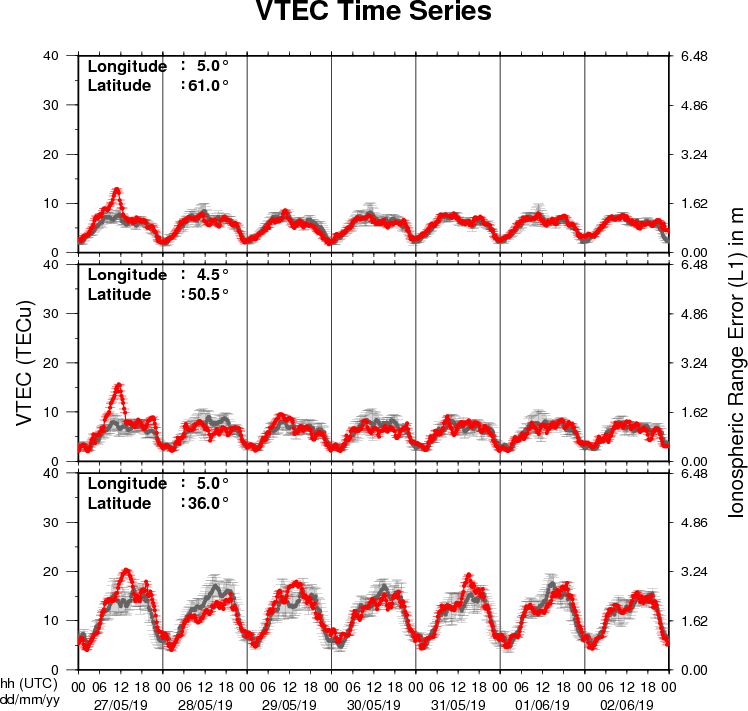
The figure shows the time evolution of the Vertical Total Electron Content (VTEC) (in red) during the last week at three locations:
a) in the northern part of Europe(N61°, 5°E)
b) above Brussels(N50.5°, 4.5°E)
c) in the southern part of Europe(N36°, 5°E)
This figure also shows (in grey) the normal ionospheric behaviour expected based on the median VTEC from the 15 previous days.
The VTEC is expressed in TECu (with TECu=10^16 electrons per square meter) and is directly related to the signal propagation delay due to the ionosphere (in figure: delay on GPS L1 frequency).
The Sun's radiation ionizes the Earth's upper atmosphere, the ionosphere, located from about 60km to 1000km above the Earth's surface.The ionization process in the ionosphere produces ions and free electrons. These electrons perturb the propagation of the GNSS (Global Navigation Satellite System) signals by inducing a so-called ionospheric delay.
See http://stce.be/newsletter/GNSS_final.pdf for some more explanations ; for detailed information, see http://gnss.be/ionosphere_tutorial.php