- Table of Content
- 1.The STCE in 20...
- 2.Review of sola...
- 3.PROBA2 Observa...
- 4.The Internatio...
- 5.Geomagnetic Ob...
- 6.The SIDC space...
- 7.Review of iono...
2. Review of solar and geomagnetic activity
3. PROBA2 Observations
4. The International Sunspot Number by SILSO
5. Geomagnetic Observations at Dourbes
6. The SIDC space weather Briefing
7. Review of ionospheric activity
The STCE in 2018
The STCE Annual Report 2018 is now available at http://www.stce.be/annualReport
It is a compilation of the activities done in 2018 within the frame of the Solar-Terrestrial Centre of Excellence (STCE). This report continues the style from the previous editions. Hence, as it is targeting a more general public, it presents only a selection of the 2018-activities in easy-to-digest summaries.
These bite-sized articles emphasize the intense collaboration between the institutes at the Space Pole, as well as with our external partners. It covers e.g. contributions on meteors and on research of the Sun's middle corona, on measurements of the auroral emission lines, on the development of tailored services to the civil aviation (PECASUS),... amongst many other topics. But also for those who want to know about the greenhouse experiments in the ROB garden, or the fate of our guest investigators, this annual report offers a glimpse on the life at the Space Pole.
We wish you an enjoyable reading experience!
Review of solar and geomagnetic activity
Solar activity
The solar activity has been at low levels. Few small and not very active sunspots were visible on the disc. No flaring activity above C-class flare has been observed in these regions and the X-ray flux was below C-level.
Two narrow and relatively slow (about 150 km/s) coronal mass ejections were observed on the East (Jan 6) and West limb (Jan 7), but no earth-directed components were identified in the available coronagraphic imagery over the week.
The greater than 10 MeV proton flux was at nominal values for the full week.
Geomagnetic activity
Space weather impact on Earth was dominated by high-speed streams originating from coronal holes. The solar wind speed was enhanced and reached up to 590 km/s on Jan 10, the total magnetic field fluctuated between 0.5 nT and 10.1 nT, and the southern component of the magnetic filed was between -8 nT and 6 nT (as recorded by the ACE spacecraft).
The geomagnetic field was in an active state on Jan 5 and 9 according to the Kp-index (NOAA) and K-Dourbes. This was in response to the solar wind enhancement.
PROBA2 Observations
Solar Activity
Solar flare activity was very low during the week.
In order to view the activity of this week in more detail, we suggest to go to the following website from which all the daily (normal and difference) movies can be accessed: https://proba2.oma.be/ssa
This page also lists the recorded flaring events.
A weekly overview movie can be found here (SWAP week 511): https://proba2.sidc.be/swap/data/mpg/movies/weekly_movies/weekly_movie_2020_01_06.mp4
Details about some of this week's events can be found further below.
If any of the linked movies are unavailable they can be found in the P2SC movie repository here: https://proba2.oma.be/swap/data/mpg/movies/
Friday Jan 10
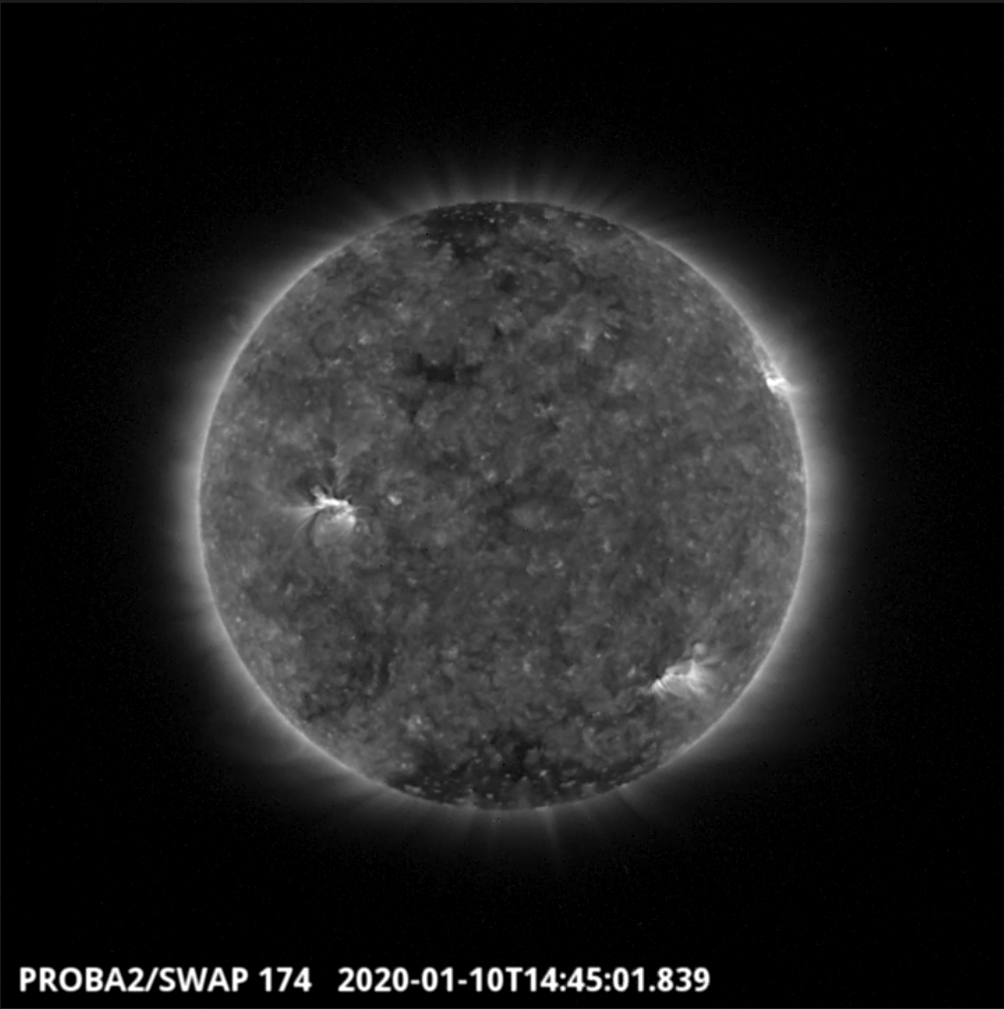
The newly emerged active region (NOAA AR2756) produced two B-class flares (B1.0) on 2020-Jan-10. The second of which is visible on the north-west limb of the Sun in the SWAP image above taken at 14:45 UT.
Find a movie of the event here (SWAP movie): http://proba2.oma.be/swap/movies/20200110_swap_movie.mp4
The International Sunspot Number by SILSO
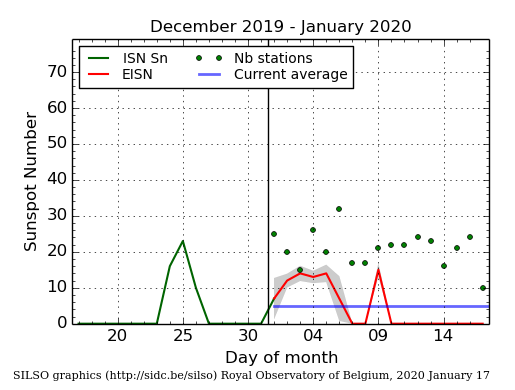
The daily Estimated International Sunspot Number (EISN, red curve with shaded error) derived by a simplified method from real-time data from the worldwide SILSO network. It extends the official Sunspot Number from the full processing of the preceding month (green line). The plot shows the last 30 days (about one solar rotation). The horizontal blue line shows the current monthly average, while the green dots give the number of stations included in the calculation of the EISN for each day.
Geomagnetic Observations at Dourbes

The SIDC space weather Briefing
The Space Weather Briefing presented by the forecaster on duty from January 5 to 12. It reflects in images and graphs what is written in the Solar and Geomagnetic Activity report.

The pdf-version: http://www.stce.be/briefings/20200113_SWbriefing.pdf
The automatically running presentation: http://www.stce.be/briefings/20200113_SWbriefing.ppsm
Review of ionospheric activity

The figure shows the time evolution of the Vertical Total Electron Content (VTEC) (in red) during the last week at three locations:
a) in the northern part of Europe(N61°, 5°E)
b) above Brussels(N50.5°, 4.5°E)
c) in the southern part of Europe(N36°, 5°E)
This figure also shows (in grey) the normal ionospheric behaviour expected based on the median VTEC from the 15 previous days.
The VTEC is expressed in TECu (with TECu=10^16 electrons per square meter) and is directly related to the signal propagation delay due to the ionosphere (in figure: delay on GPS L1 frequency).
The Sun's radiation ionizes the Earth's upper atmosphere, the ionosphere, located from about 60km to 1000km above the Earth's surface.The ionization process in the ionosphere produces ions and free electrons. These electrons perturb the propagation of the GNSS (Global Navigation Satellite System) signals by inducing a so-called ionospheric delay.
See http://stce.be/newsletter/GNSS_final.pdf for some more explanations ; for detailed information, see http://gnss.be/ionosphere_tutorial.php