- Table of Content
- 1.Launch of Sola...
- 2.Review of sola...
- 3.Review of sola...
- 4.Review of geom...
- 5.Review of geom...
- 6.PROBA2 Observa...
- 7.The Internatio...
- 8.Geomagnetic Ob...
- 9.Geomagnetic Ob...
- 10.The SIDC space...
- 11.Review of iono...
- 12.Review of iono...
2. Review of solar activity (20 Jan 2020 - 26 Jan 2020)
3. Review of solar activity (27 Jan 2020 - 2 Feb 2020)
4. Review of geomagnetic activity (20 Jan 2020 - 26 Jan 2020)
5. Review of geomagnetic activity (27 Jan 2020 - 2 Feb 2020)
6. PROBA2 Observations (20 Jan 2020 - 26 Jan 2020)
7. The International Sunspot Number by SILSO
8. Geomagnetic Observations at Dourbes (20 Jan 2020 - 26 Jan 2020)
9. Geomagnetic Observations at Dourbes (27 Jan 2020 - 2 Feb 2020)
10. The SIDC space weather Briefing - 2 weeks
11. Review of ionospheric activity (20 Jan 2020 - 26 Jan 2020)
12. Review of ionospheric activity (27 Jan 2020 - 2 Feb 2020)
Launch of Solar Orbiter - Feb 10, 05:03 CET
NASA will launch the Solar Orbiter spacecraft from Cape Canaveral, with 10 scientific instruments on board, including the space telescope Extreme Ultraviolet Imager (EUI). Solar Orbiter is an ESA mission, with an important contribution from NASA, which will study the Sun from close up. The EUI instrument was built by a European consortium under the leadership of the Centre Spatial de Liège. After the launch, the Royal Observatory of Belgium will manage the observations and coordinate the analysis of its unique solar images.
Belgian scientists will be present in Florida at the launch, a crucial step in the EUI project. Some eight weeks later, another milestone will follow when the telescope doors will open for the first time. It is only during this 'First Light' moment that the EUI team will know whether the telescope survived the launch and is working properly.
By making several Venus flybys in the coming years, the Solar Orbiter spacecraft will use the gravity of the planet to approach the Sun. The EUI images will be exceptionally sharp such that details of a few hundred kilometres large in the solar atmosphere can be studied. Later on, the gravity of Venus will be used to tilt its orbit and to enable EUI to take images from a polar perspective, something that has never been done before.
Studying the solar poles is of great scientific importance for understanding the Sun's magnetism and the solar activity cycle. The solar cycle lasts about 11 years and takes us from a 'low solar season' with few solar storms to a 'high solar season' with more frequent solar storms. Technology on Earth can be seriously disrupted by these solar storms, which are studied in the context of “space weather”. By visualising the poles and magnetic forces, the EUI instrument will contribute to unravelling the secrets of the solar cycle.
Partners
The EUI project was launched in 2008 under the scientific leadership of the Royal Observatory of Belgium and the technical leadership of the Centre Spatial de Liège. EUI was developed by a European consortium with significant contributions from France (Institut d'Astrophysique Spatiale), Germany (Max-Planck-Institut für Sonnensystemforschung), the United Kingdom (UCL-Mullard Space Science Laboratory) and Switzerland (Physikalisch-Meteorologisches Observatorium Davos/World Radiation Center). The Belgian contribution was funded by BELSPO (Federal Science Policy Office) through ESA/PRODEX.
More information
Launch: Cape Canaveral (Florida, US), Sunday 9 February, 23:03 EST (local time). This corresponds to Monday 10 February, 05:03 CET (Belgian time). The launch can be followed live online on ESA TV: https://www.esa.int/ESA_Multimedia/Transmissions/2020/02/Solar_Orbiter_launch_from_Cape_Canaveral
EUI website: http://sidc.be/EUI
Follow the EUI Twitter account: https://twitter.com/EuiTelescope
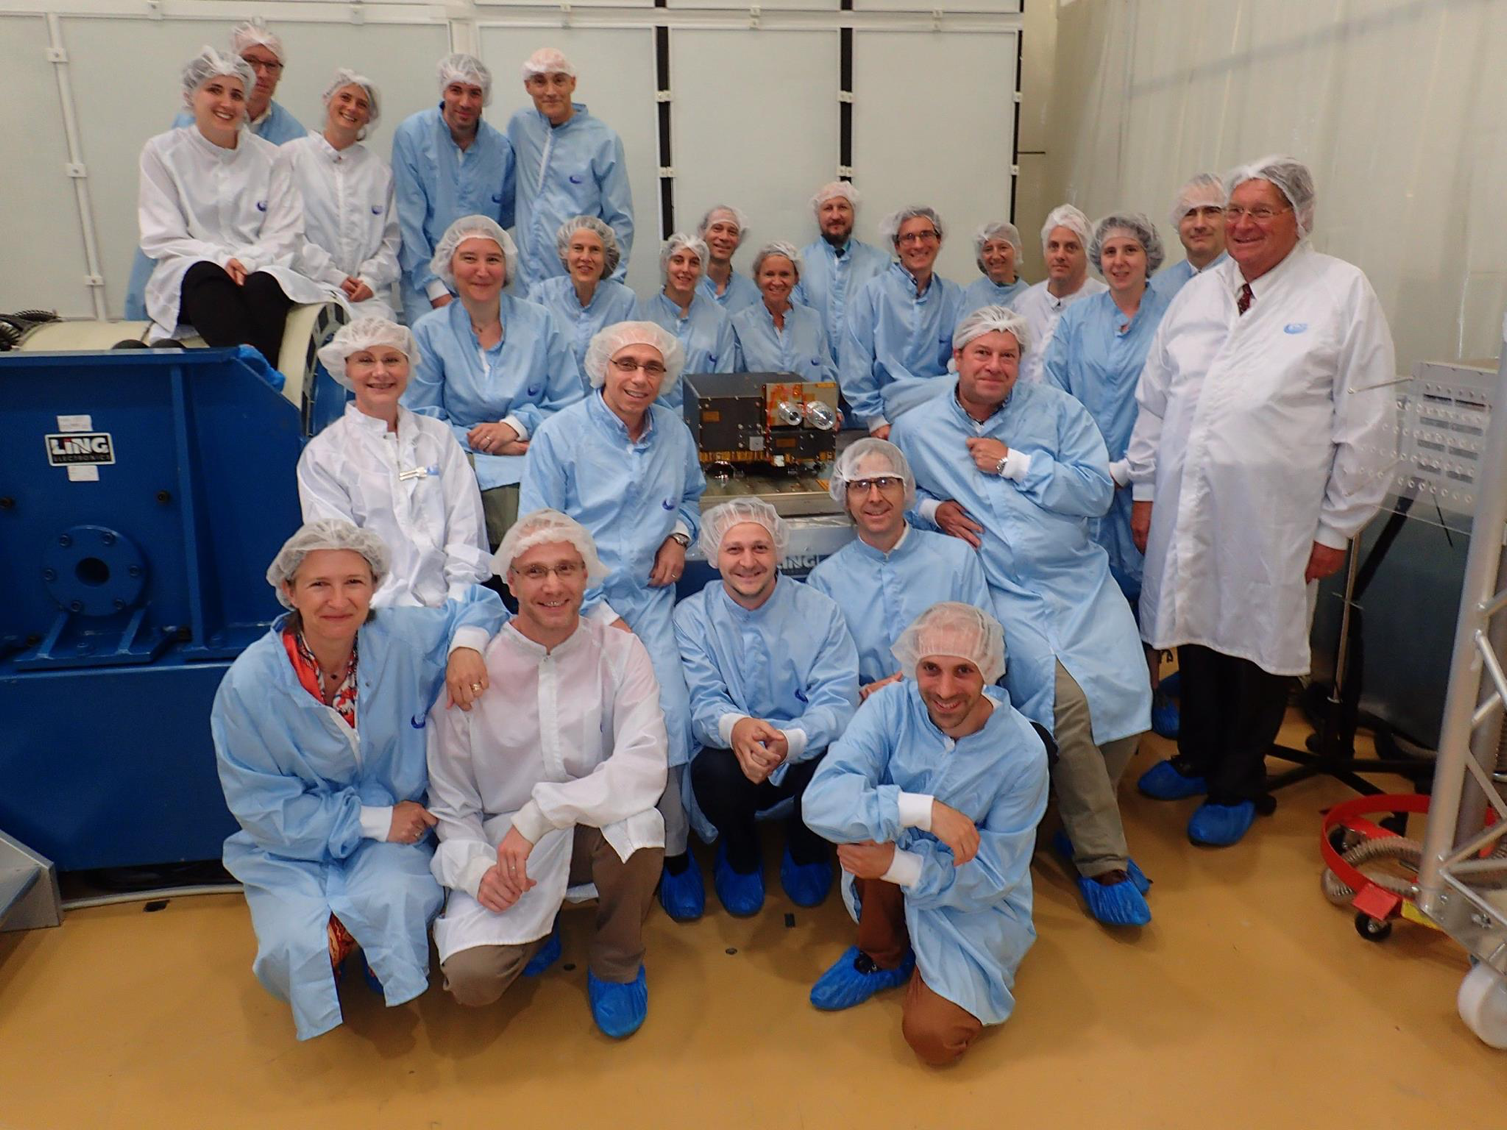
EUI at CSL surrounded by its friends
Review of solar activity (20 Jan 2020 - 26 Jan 2020)
Solar flaring activity was very low.
Active region (Beta, NOAA 2757) emerged on Jan 24 and continued to develop but produced no significant flares.
One CME was seen, at 17:54 Jan 25 in the STEREO/COR2 coronagraph. It was rather weak and slow (approximately 200km/s).
The solar protons remained at the background level.
A small extension of the southern polar coronal hole reached the central meridian on Jan 25.
Review of solar activity (27 Jan 2020 - 2 Feb 2020)
The solar activity was low.
No significant solar flares have been observed.
Catania sunspot group 28 (NOAA Active Region 2757)was visible at the beginning of the week. It remained quiet. Catania sunspot group 28 decayed, reducing its complexity from Hale class beta to Hale class alpha and rotated behind the west limb on Feb 02.
A long-lived plage region was observed during the entire week, which did not develop into an active region and remained quiet.
No Earth-directed coronal mass ejections (CMEs) have been observed. A very slow back-sided CME with speed below 200 km/s left the Sun from beyond the east limb starting at 9:24 UTC on Jan 29th. The CME had no visible Earth-directed component and did not impact the Earth.
There was no further track of the west-limb CME, which was detected by STEREO-A at 17:54 on Jan 25th, with no measurable impact on Earth.
The greater than 10 MeV solar proton flux was at nominal levels.
Review of geomagnetic activity (20 Jan 2020 - 26 Jan 2020)
The solar wind was in the slow regime for the whole week, where the speed remained below 400 km/s (ACE). The wind speed showed a slight enhancement on Jan 21, simultaneously with the density, temperature and magnetic field measurements. These observations suggest the possible arrival of the solar wind associated with the negative polarity coronal hole that reached central meridian on January 16.
Over the week, the total magnetic field varied between 0 and 10 nT while Bz varied between -9 and +8 nT. The interplanetary magnetic field (phi angle) was predominantly directed towards the Sun (negative sector), switching to be mostly in the positive sector from Jan 24.
The geomagnetic field was mostly quiet with a few intervals of unsettled conditions (K Dourbes and NOAA Kp equal to 3) between Jan 21 and Jan 23, coinciding with the slightly enhanced solar wind parameters.
Review of geomagnetic activity (27 Jan 2020 - 2 Feb 2020)
At the beginning of the week the solar wind parameters were typical for a slow solar wind. Towards the middle of the week, the high speed stream from a negative coronal hole arrived. The solar wind speed increased from 300 km/s to almost 500 km/s, reaching a maximum value of about 550 km/s on Jan 31st. The enhanced conditions lasted until midday on Feb 02. From that moment, the solar wind speed decreased.
The total magnetic field varied within 0-8 nT. It was predominantly in the negative sector with several sustained positive intervals. The north-south Bz component was negative for long periods. It reached -8 nT on Jan 28th.
The geomagnetic field were very quiet on Jan 27th, became unsettled on Jan 28th when the high speed stream arrived leading to active intervals on Jan 30 and Jan 31 with K Dourbes and NOAA Kp equal to 4.
At the end of the week, the geomagnetic field returned to a quiet state with a single isolated unsettled interval (NOAA Kp equal to 3).
PROBA2 Observations (20 Jan 2020 - 26 Jan 2020)
Solar Activity
Solar flare activity was very low during the week.
In order to view the activity of this week in more detail, we suggest to go to the following website from which all the daily (normal and difference) movies can be accessed: https://proba2.oma.be/ssa
This page also lists the recorded flaring events.
A weekly overview movie can be found here (SWAP week 513): https://proba2.sidc.be/swap/data/mpg/movies/weekly_movies/weekly_movie_2020_01_20.mp4
Details about some of this week's events can be found further below.
If any of the linked movies are unavailable they can be found in the P2SC movie repository here: https://proba2.oma.be/swap/data/mpg/movies/
Saturday Jan 25
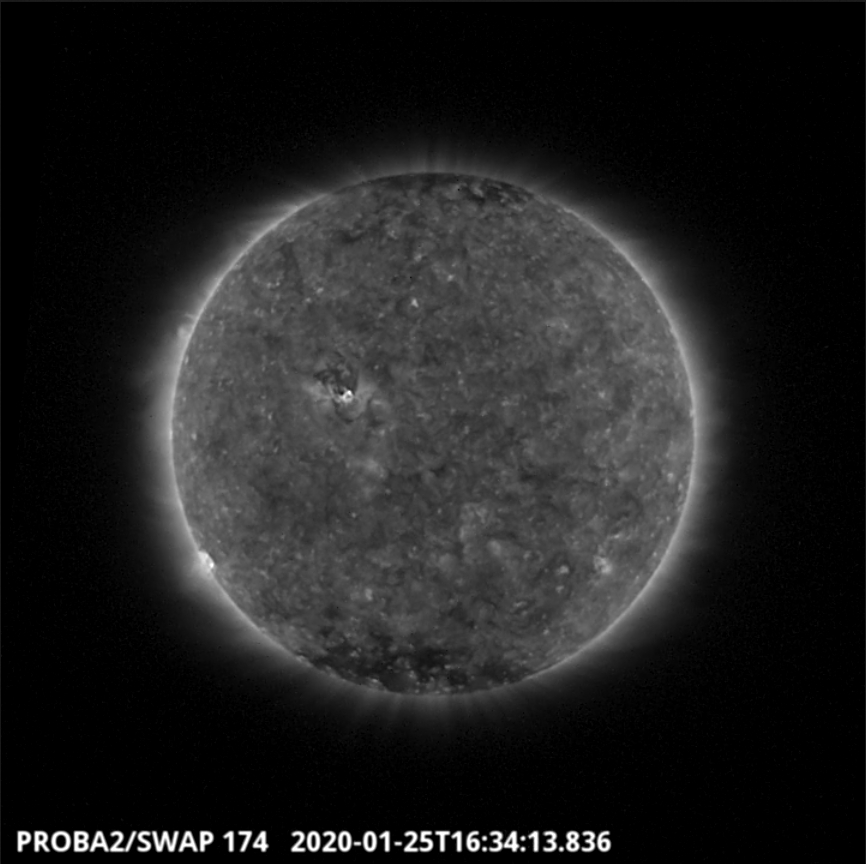
Active region NOAA AR2757 emerged on 2020-Jan-24 and is shown near the centre of the solar disk in the SWAP image above taken on 2020-Jan-25 at 16:34 UT.
Find a movie of the day here (SWAP movie): http://proba2.oma.be/swap/movies/20200125_swap_movie.mp4
The International Sunspot Number by SILSO
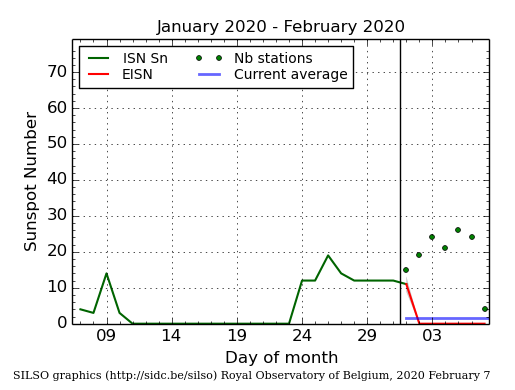
The daily Estimated International Sunspot Number (EISN, red curve with shaded error) derived by a simplified method from real-time data from the worldwide SILSO network. It extends the official Sunspot Number from the full processing of the preceding month (green line). The plot shows the last 30 days (about one solar rotation). The horizontal blue line shows the current monthly average, while the green dots give the number of stations included in the calculation of the EISN for each day.
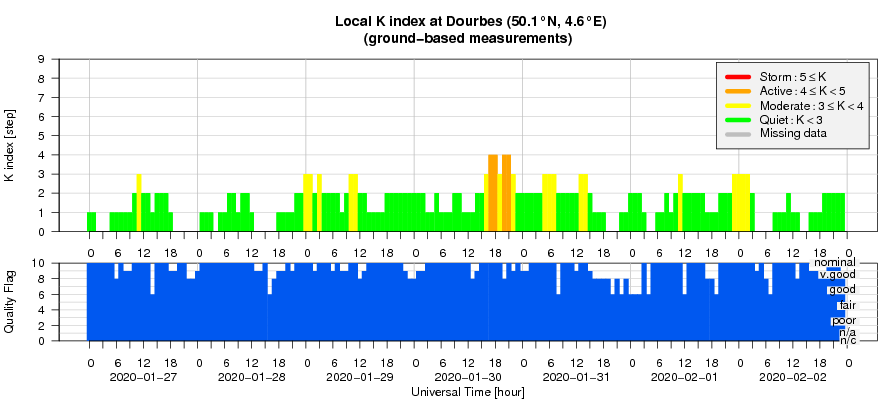
Geomagnetic Observations at Dourbes (20 Jan 2020 - 26 Jan 2020)

Geomagnetic Observations at Dourbes (27 Jan 2020 - 2 Feb 2020)
The SIDC space weather Briefing - 2 weeks
The Space Weather Briefing presented by the forecaster on duty from. Jan 19 to Feb 2. It reflects in images and graphs what is written in the Solar and Geomagnetic Activity report.
The pdf-version, Jan 26-Feb 02: http://www.stce.be/briefings/20200203_SWbriefing.pdf
The pdf-version, Jan 19-Jan 26: http://www.stce.be/briefings/20200127_SWbriefing.pdf
The automatically running presentation, Jan 26-Feb 02: http://www.stce.be/briefings/20200203_SWbriefing.ppsm
The automatically running presentation, Jan 19-Jan 26: http://www.stce.be/briefings/20200127_SWbriefing.ppsm
Review of ionospheric activity (20 Jan 2020 - 26 Jan 2020)

The figure shows the time evolution of the Vertical Total Electron Content (VTEC) (in red) during the last week at three locations:
a) in the northern part of Europe(N61°, 5°E)
b) above Brussels(N50.5°, 4.5°E)
c) in the southern part of Europe(N36°, 5°E)
This figure also shows (in grey) the normal ionospheric behaviour expected based on the median VTEC from the 15 previous days.
The VTEC is expressed in TECu (with TECu=10^16 electrons per square meter) and is directly related to the signal propagation delay due to the ionosphere (in figure: delay on GPS L1 frequency).
The Sun's radiation ionizes the Earth's upper atmosphere, the ionosphere, located from about 60km to 1000km above the Earth's surface.The ionization process in the ionosphere produces ions and free electrons. These electrons perturb the propagation of the GNSS (Global Navigation Satellite System) signals by inducing a so-called ionospheric delay.
See http://stce.be/newsletter/GNSS_final.pdf for some more explanations ; for detailed information, see http://gnss.be/ionosphere_tutorial.php
Review of ionospheric activity (27 Jan 2020 - 2 Feb 2020)
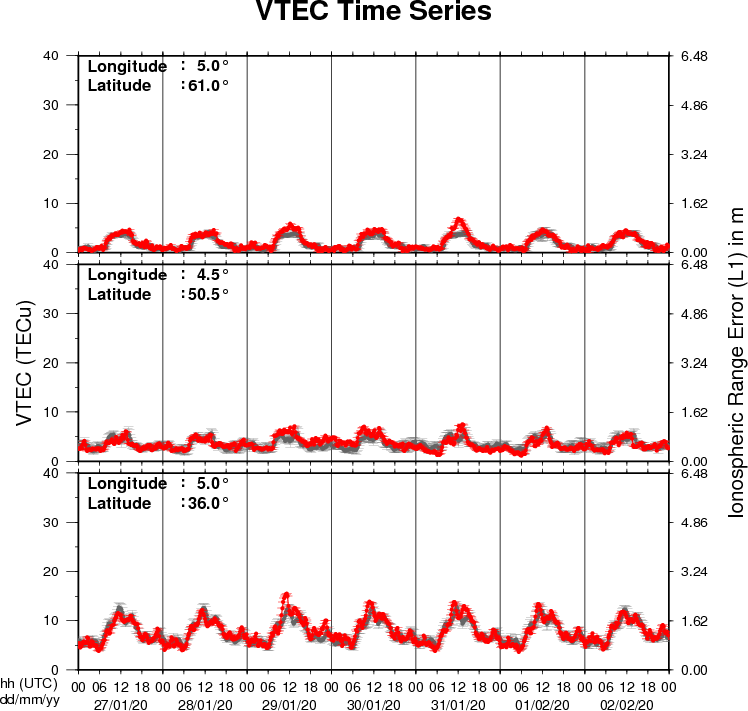
The figure shows the time evolution of the Vertical Total Electron Content (VTEC) (in red) during the last week at three locations:
a) in the northern part of Europe(N61°, 5°E)
b) above Brussels(N50.5°, 4.5°E)
c) in the southern part of Europe(N36°, 5°E)
This figure also shows (in grey) the normal ionospheric behaviour expected based on the median VTEC from the 15 previous days.
The VTEC is expressed in TECu (with TECu=10^16 electrons per square meter) and is directly related to the signal propagation delay due to the ionosphere (in figure: delay on GPS L1 frequency).
The Sun's radiation ionizes the Earth's upper atmosphere, the ionosphere, located from about 60km to 1000km above the Earth's surface.The ionization process in the ionosphere produces ions and free electrons. These electrons perturb the propagation of the GNSS (Global Navigation Satellite System) signals by inducing a so-called ionospheric delay.
See http://stce.be/newsletter/GNSS_final.pdf for some more explanations ; for detailed information, see http://gnss.be/ionosphere_tutorial.php