- Table of Content
- 1.STCE March eve...
- 2."B" as in "Bab...
- 3.EUI as a guest...
- 4.Review of sola...
- 5.PROBA2 Observa...
- 6.The Internatio...
- 7.Geomagnetic Ob...
- 8.The SIDC space...
- 9.Review of iono...
2. "B" as in "Baby"
3. EUI as a guest in a science TV program
4. Review of solar and geomagnetic activity
5. PROBA2 Observations
6. The International Sunspot Number by SILSO
7. Geomagnetic Observations at Dourbes
8. The SIDC space weather Briefing
9. Review of ionospheric activity
STCE March events are cancelled
Due to the corona-crises, the Space Weather Introductory Course, the post Space Weather Introductory Course and the workshop 'Space Weather science and services in support of lunar missions' are postponed: https://events.spacepole.be/category/4/
Keep it healthy and take care of each other.
the STCE
"B" as in "Baby"
The most recent C-class flare dates already back from 15 May 2019. With nearly 300 days and counting, this period without C-class flares shatters the previous record when no such flares were seen from 3 April till 3 November 2008 (213 days). Similar story with the M-class flares ("M" as in medium; 10 times stronger than a C-class flare), with the latest recorded on 20 October 2017. This ongoing lapse of more than 870 days is much longer than the previous record (25 March 2008 - 19 January 2010) of 664 days. We're going through a deep solar cycle minimum indeed.
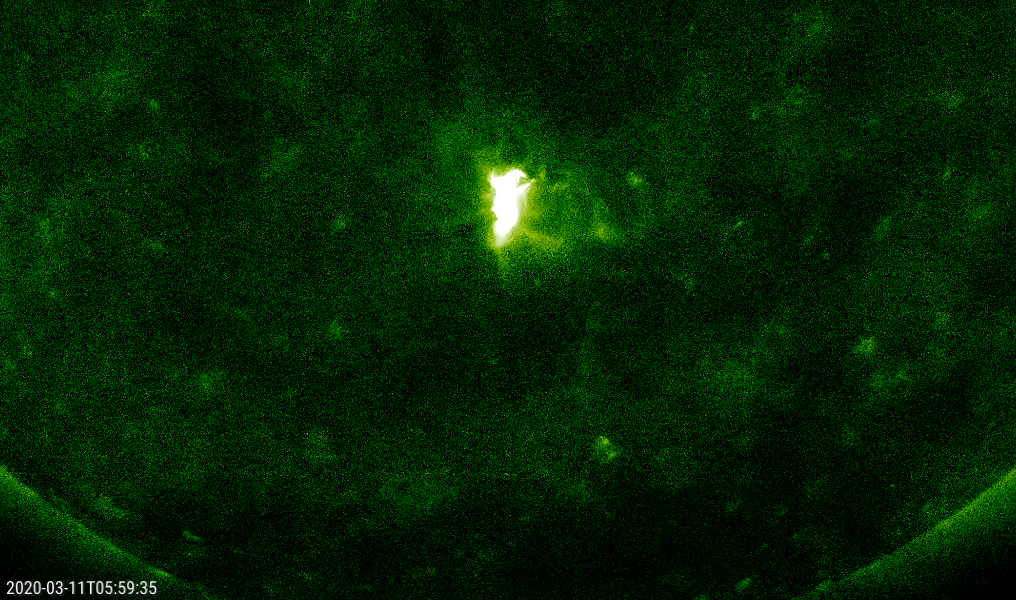
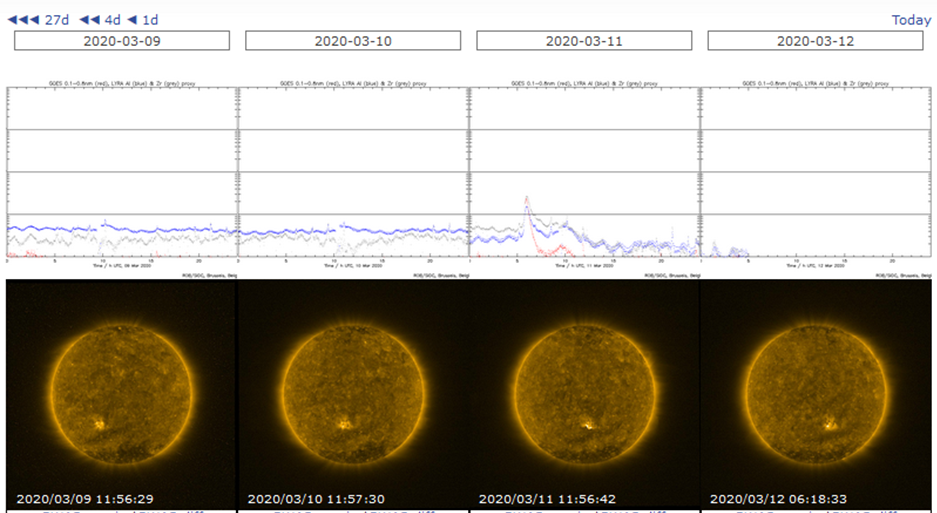
In absence of their bigger brothers, space weather (SWx) forecasters have to indulge their appetite for solar flares by looking for the kiddies of the family: the B-class flares. These are even 10 times weaker than the ones from the C-class. On top of that, as this cycle minimum is so deep, even these baby-flares have become rare. Under these conditions, the observation of a B-class flare on 11 March put a smile on the face of every SWx forecaster. This x-ray flare reached a maximum of B2.3 at 05:56UT and had its source in active region (AR) NOAA 2758. See SDO's imagery in extreme ultraviolet (EUV) above (SDO/AIA 94 ; https://sdo.gsfc.nasa.gov/data/ ). The screen-shot underneath shows, from 9 till 12 March, the daily UV measurements by PROBA2 (top; LYRA instrument) with a small spike on 11 March (B2 flare), while the bottom row has an image in EUV for each day around noon (bottom; SWAP) showing the transit of active region NOAA 2758 as a somewhat brighter area over the solar disk. Data and movies are available at the website of the PROBA2 Science Center (https://proba2.sidc.be/ssa ).
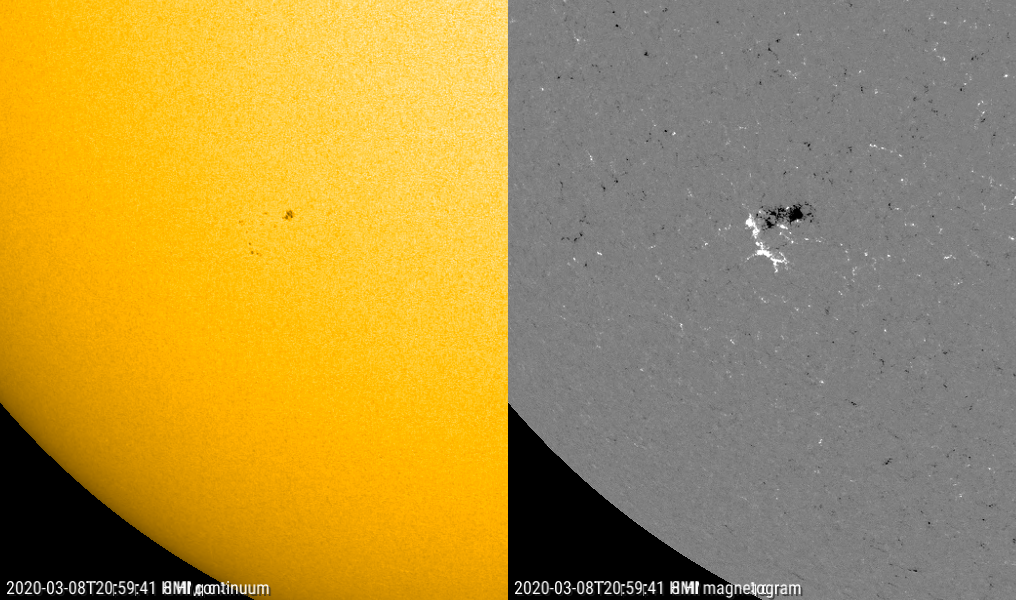
NOAA 2758 gathered a few sunspots on 8 and 9 March, but remained quiet at that time. It's also a member of the new solar cycle 25, in view of its high southern latitude (-32 degrees) and correct magnetic polarity (see the SDO/HMI imagery underneath). The appearance of NOAA 2758 ended a stretch of 35 consecutive days with no sunspots. That's almost as long as the longest spotless stretch so far this solar cycle transit (40 days), from 14 November till 23 December 2019 (See SILSO's spotless days page at http://sidc.oma.be/silso/spotless ).
EUI as a guest in a science TV program
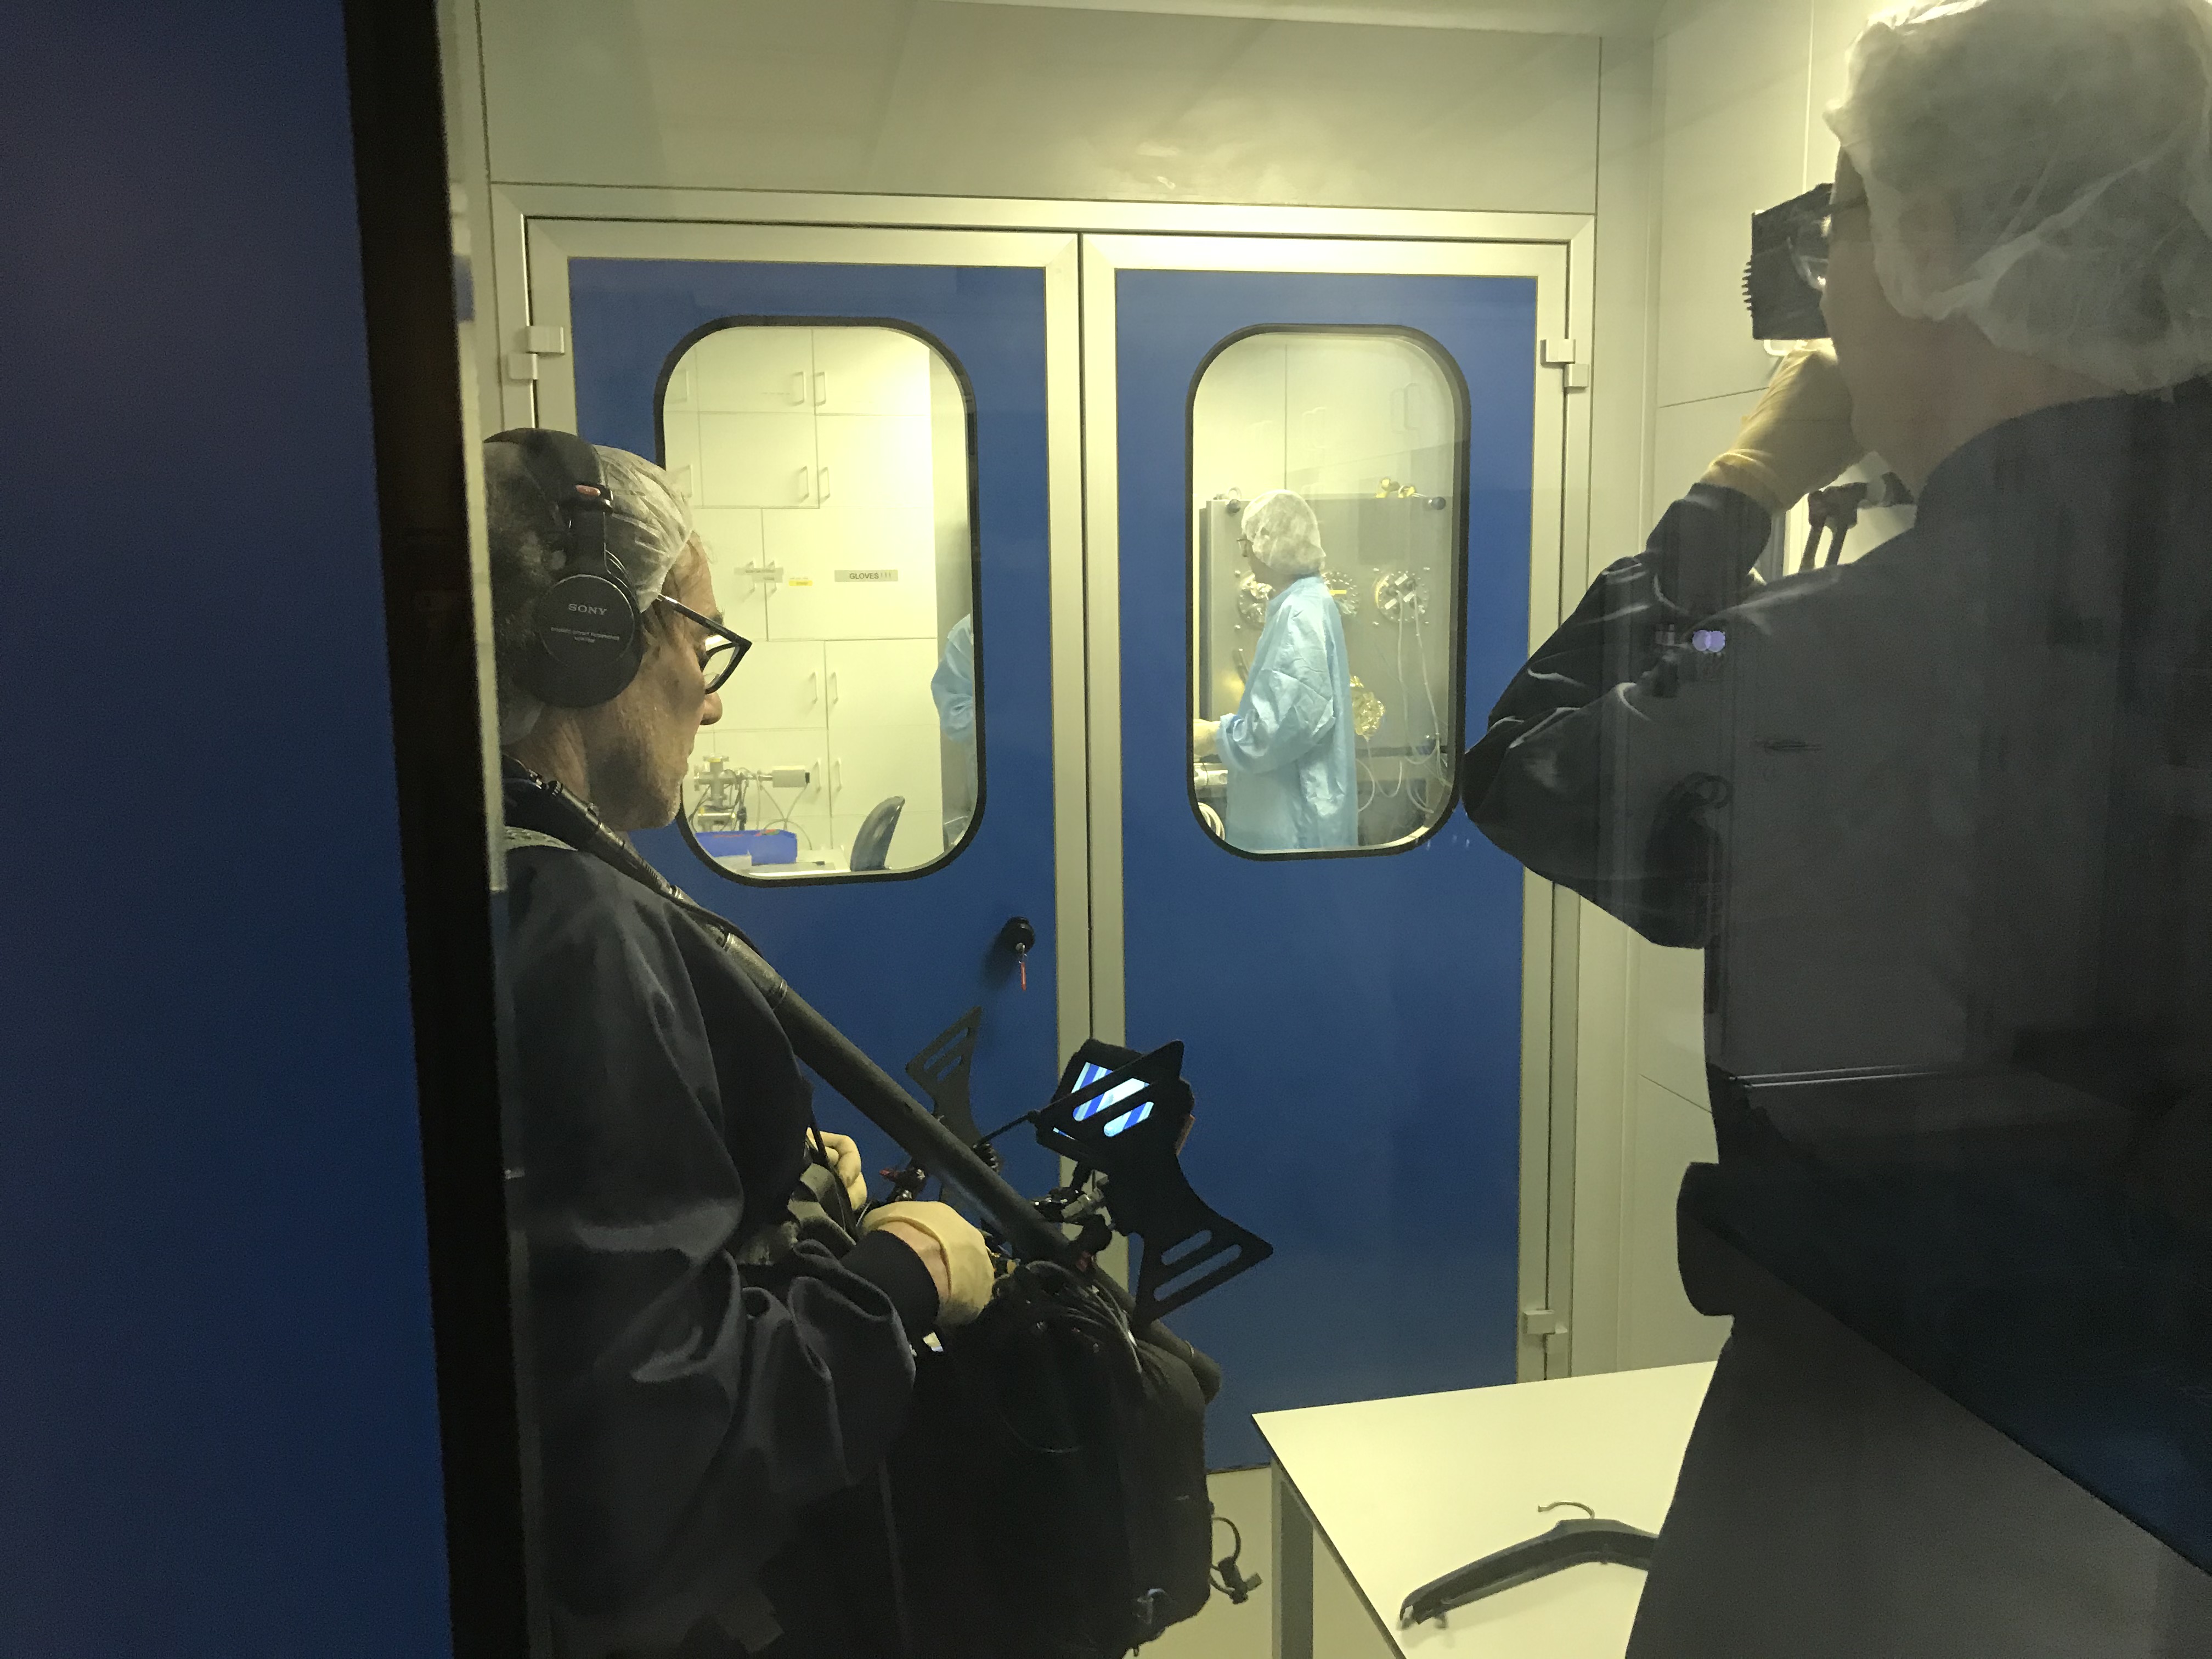
March 11, a camera-crew from a television channel NPO, the Netherlands, visited us. They recorded the scenes of a broadcast on Solar Orbiter and EUI in the program 'Kennis van nu' or 'Knowledge of now'.
Our EUI stars were interviewed in the clean room (see picture), near the planeterrella, in the Space Weather Service Centre, PECASUS operations room, in the solar dome, in the library, in the lunch room, outside.
As a surprise, they brought cake with an image taken by EUI while the doors were still closed. The cake contained even 'file format information'. Everybody could eat at least 70 on 70 pixels of the grey/white square!

To be continued ...
Review of solar and geomagnetic activity
SOLAR ACTIVITY
Solar activity was low with the X-ray flux below the B-level. A new sunspot emerged on the March 7 in the South-East quadrant on the solar disc (NOAA Active Region 2758, Catania group 29).
No earth-directed coronal mass ejections (CMEs) have been identified in available coronagraphic imagery. The greater than 10 MeV proton flux was at nominal values.
GEOMAGNETIC ACTIVITY
The solar wind stayed most of the time in the background level. Its speed was slow with only a few minor enhancements.
At first, its speed was around 450 km/s. It was the wind emanating from an equatorial coronal hole which was facing Earth on February 27. The solar wind speed then slowly decreased and reached a minimum value of about 300 km/s on March 06.
The speed went up again to values between 320 km/s and 410 km/s. The total Interplanetary Magnetic Field peaked at 9.5 nT on March 6 while the southward component fluctuated between -6 nT and 7 nT. This was probably because of the influence of a southern coronale hole which expanded to 20 degree South and the heliospheric current sheet being close to the heliographic equator causing sector changes.
The geomagnetic conditions were quiet. Locally at Dourbes, the geomagnetic field was unsettled.
PROBA2 Observations
Solar Activity
Solar flare activity was very low during the week.
In order to view the activity of this week in more detail, we suggest to go to the following website from which all the daily (normal and difference) movies can be accessed: https://proba2.oma.be/ssa
This page also lists the recorded flaring events.
A weekly overview movie can be found here (SWAP week 519). http://proba2.oma.be/swap/data/mpg/movies/weekly_movies/weekly_movie_2020_03_02.mp4
Details about some of this week's events can be found further below.
If any of the linked movies are unavailable they can be found in the P2SC movie repository here https://proba2.oma.be/swap/data/mpg/movies/
Wednesday Mar 04
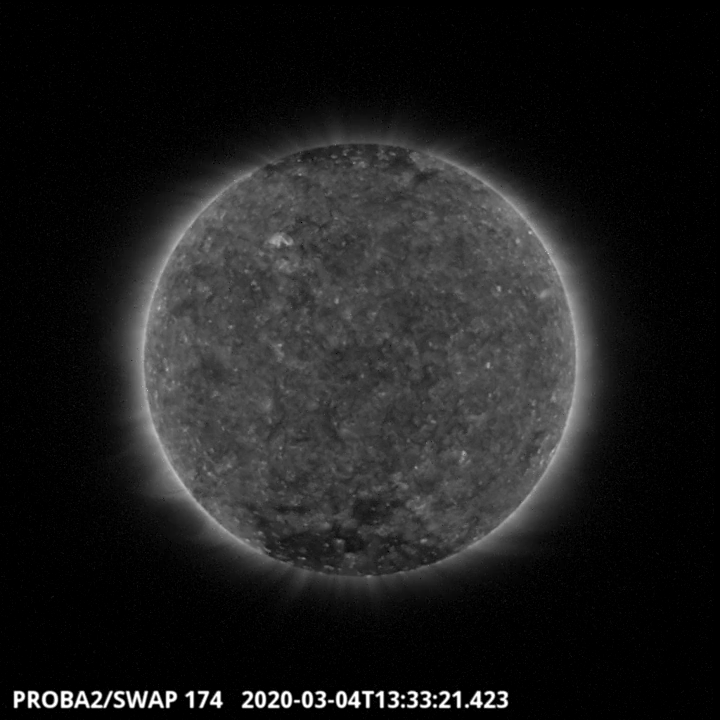
An eruption was observed by SWAP on the North-West part of the solar disk on 2020-Mar-04 as shown in the SWAP image above taken at 13:34 UT. Find a movie of the event here (SWAP movie) https://proba2.sidc.be/swap/movies/20200304_swap_movie.mp4
Sunday Mar 08
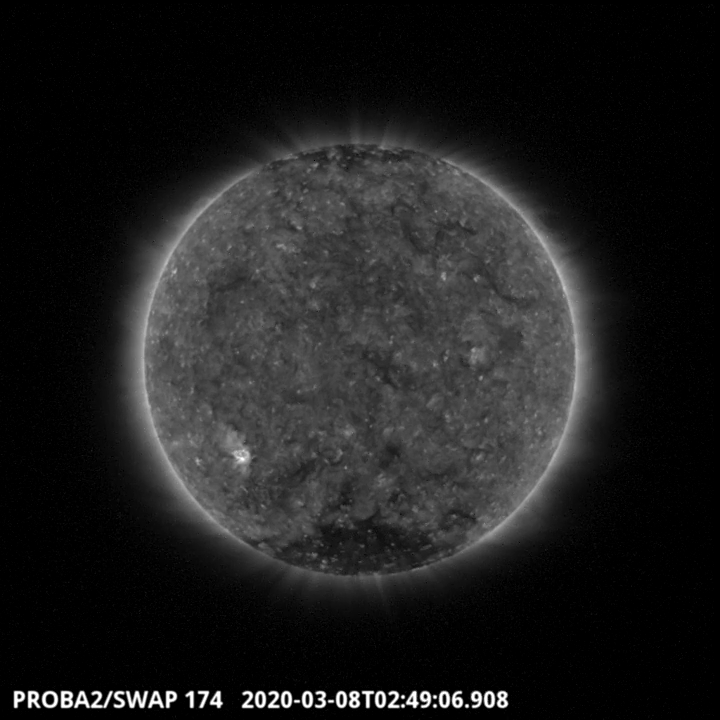
The SWAP image above shows an elongated Coronal Hole in the Southern part of the solar disk.
Find a movie of the event here (SWAP movie). https://proba2.sidc.be/swap/movies/20200308_swap_movie.mp4
The International Sunspot Number by SILSO
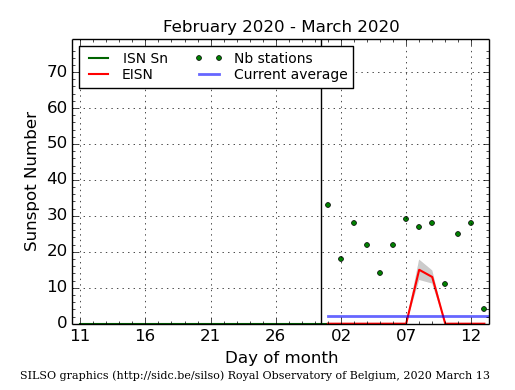
The daily Estimated International Sunspot Number (EISN, red curve with shaded error) derived by a simplified method from real-time data from the worldwide SILSO network. It extends the official Sunspot Number from the full processing of the preceding month (green line). The plot shows the last 30 days (about one solar rotation). The horizontal blue line shows the current monthly average, while the green dots give the number of stations included in the calculation of the EISN for each day.
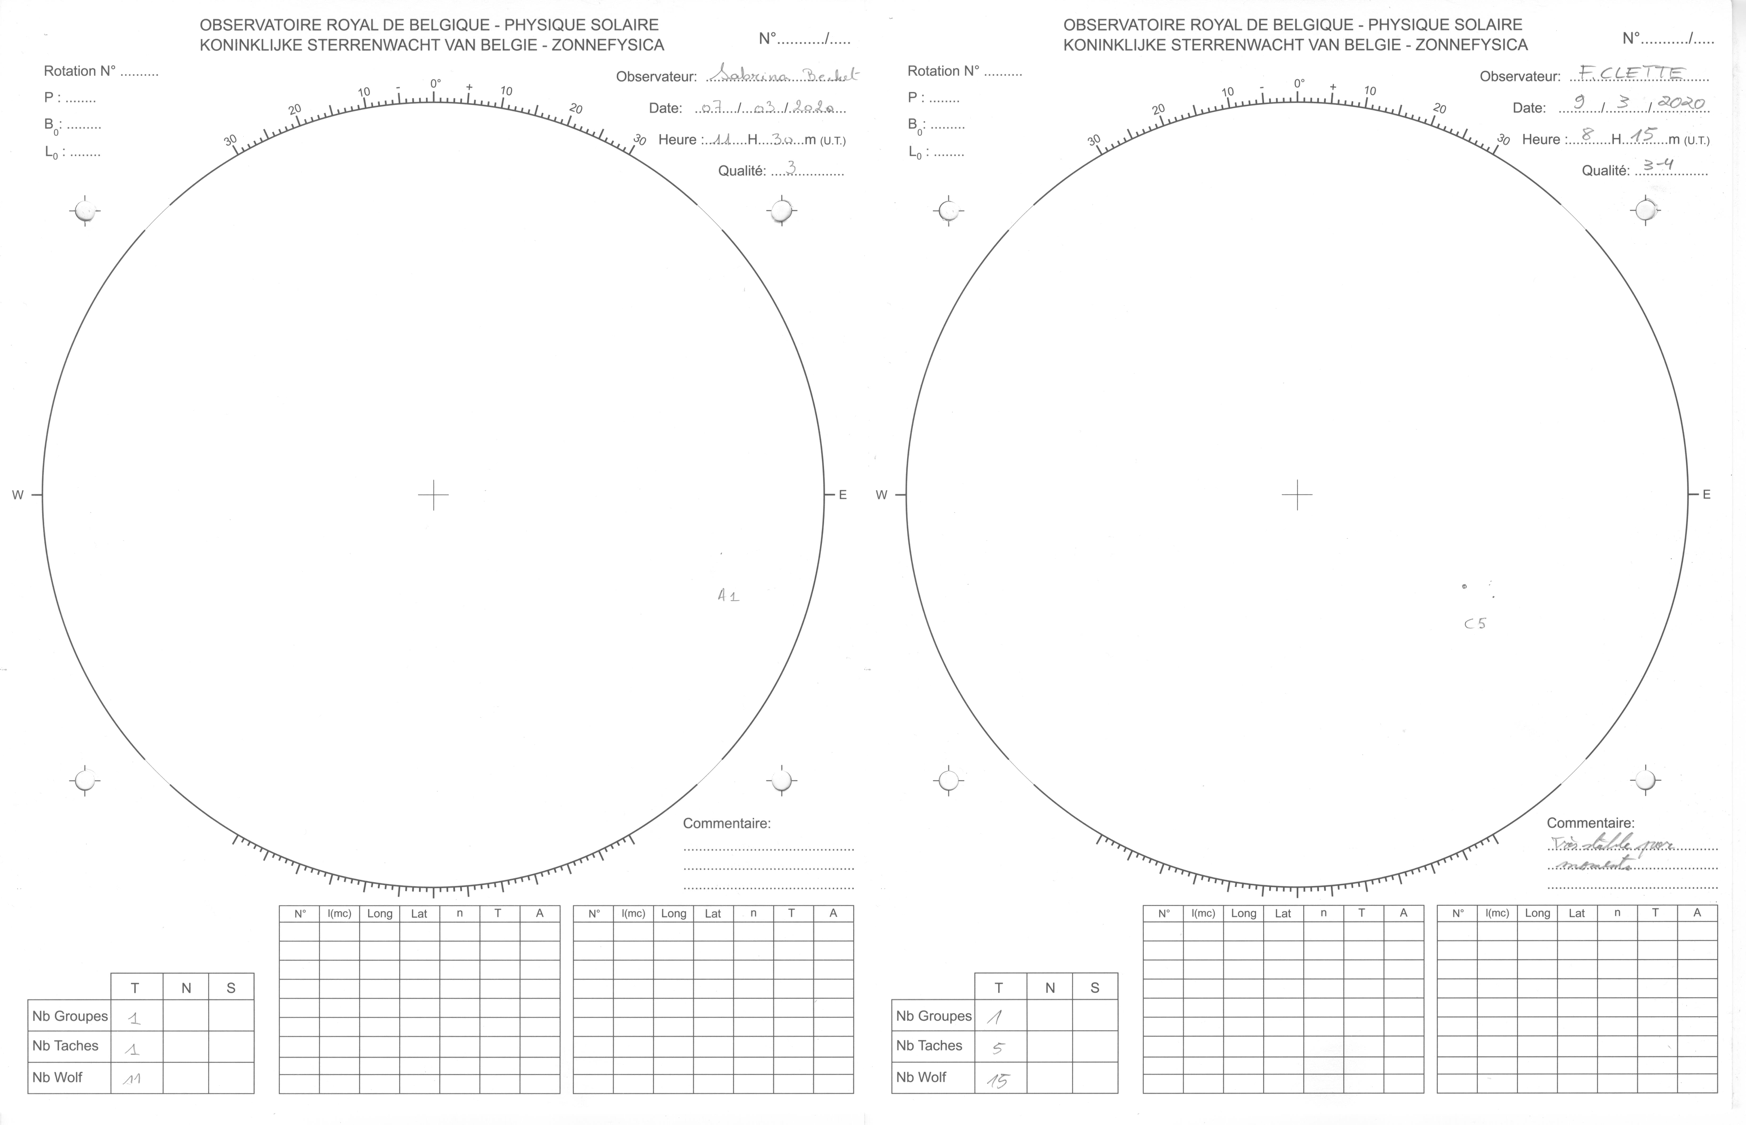
There was 1 sunspot group seen. It was one of solar cycle nr 25, the next cycle which is slowly picking up activity. Just below, the USET (Uccle Solar Equatorial table) sunspot drawings of March 7 and 9 with the sunspot of the new cycle. It vanished on March 10.
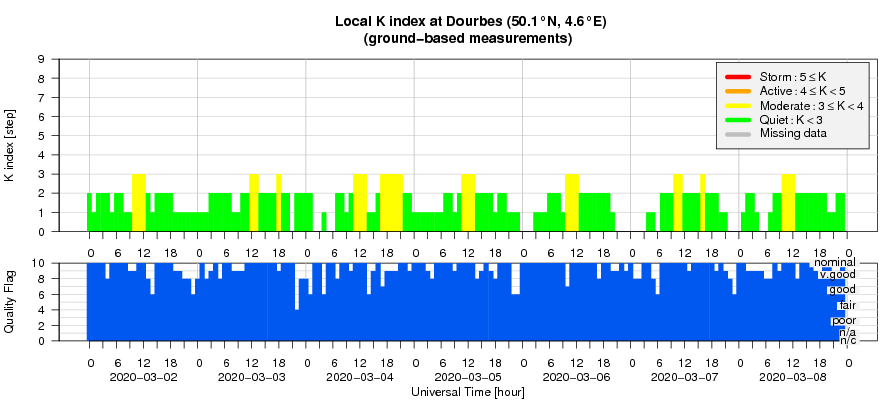
Geomagnetic Observations at Dourbes
The SIDC space weather Briefing
The Space Weather Briefing presented by the forecaster on duty from March 2 to 9. It reflects in images and graphs what is written in the Solar and Geomagnetic Activity report.
The pdf-version: http://www.stce.be/briefings/20200309_SWbriefing.pdf
The automatically running presentation: http://www.stce.be/briefings/20200309_SWbriefing.ppsm
Review of ionospheric activity
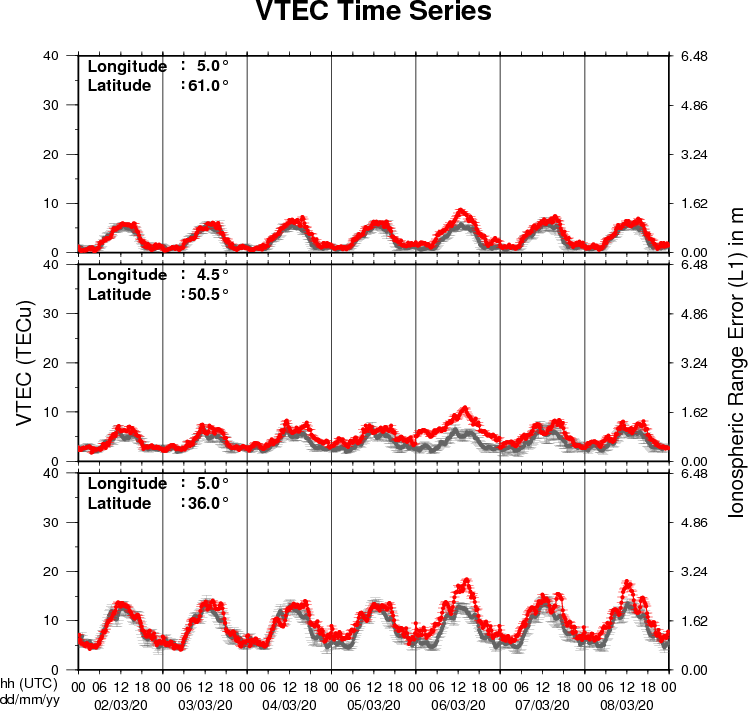
The figure shows the time evolution of the Vertical Total Electron Content (VTEC) (in red) during the last week at three locations:
a) in the northern part of Europe(N61°, 5°E)
b) above Brussels(N50.5°, 4.5°E)
c) in the southern part of Europe(N36°, 5°E)
This figure also shows (in grey) the normal ionospheric behaviour expected based on the median VTEC from the 15 previous days.
The VTEC is expressed in TECu (with TECu=10^16 electrons per square meter) and is directly related to the signal propagation delay due to the ionosphere (in figure: delay on GPS L1 frequency).
The Sun's radiation ionizes the Earth's upper atmosphere, the ionosphere, located from about 60km to 1000km above the Earth's surface.The ionization process in the ionosphere produces ions and free electrons. These electrons perturb the propagation of the GNSS (Global Navigation Satellite System) signals by inducing a so-called ionospheric delay.
See http://stce.be/newsletter/GNSS_final.pdf for some more explanations ; for detailed information, see http://gnss.be/ionosphere_tutorial.php